AAPL in weekly chartHello everyone
I do not want to mention any entry signal in this chart but I just want to say that Apple a few waves 1,2 that are the part of extensions, so I do not believe that Apple experience very deep corrections yet and Rally has not finished yet.
AAPL trade ideas

william % R simple yet powerfulThis indicators has unleashed a powerful mental clarity for placing positions in bullish stocks and indices as well as Crypto
buy the dip is the MOTTO of this indicator "LITERALLY BUY THE DIP"
If you trade ICT methods use the FVG when you buy the dip
This indicates the timeframe in play and its holding time:
Monthly : use global liquidity cycle
weekly : takes a couple of years
daily : takes a couple of months
4 hr : takes a couple of weeks
1 hr : takes a couple of days

APPL is hitting cluster support!🔭🤔boost and follow for more ❤️🔥
apple is at extremely oversold RSI levels, resistance = support area and is approaching a local support zone. all signs that a reversal is likely... I wont be surprised to see apple back to 181-196 targets very soon!
not the most volatile stock but pretty predictable, no wonder buffet loves apple! 🔥
last chart from me today, hopefully I will see you soon with more 🤝

AAPLPair : Apple Index
Description :
Completed " 12345 " Impulsive Waves
Break of Structure
RSI - Divergence
Fibonacci Level - 161.8%
Rising Wedge in Short Time Frame

AAPL Scalping Zones 5/20Outlook
-Apple falls premarket after reports of slashing iPhone prices
in China amid fierce Huawei competition
-Apple has been trading in a tight range and had a lot of selling
volume going into market close friday. Would need 188.8 to
hold for any upside potential. Weekly and daily still bullish so
will look to go long on open if selling pressure seems exhausted
Upside Targets:
* 189.34/189.93/190.77
Downside Targets:
*188.93/188.6/187.46
Daily Trend Tracker -
*AAPL+ *DXY+ *VIX- *US10Y+

Apple Rebounds with Strong Earnings and $110B BuybackApple and Nvidia have been dominating the market conversation lately. Apple's stock rebounded significantly after a rough start to the year, partly due to better-than-expected earnings and a massive $110 billion buyback announcement. Despite concerns about China and the iPhone cycle, the sentiment has turned positive. With WWDC and AI developments on the horizon, Apple’s outlook appears strong.

AAPL Long $248 PTParallel channel + horizontal support/resistance pattern.
Similar look to price movement - initial channel is more exaggerated, but the general pattern of the price movement is the same.
Arrows denote price expansion after breaking out of the channels for the third time each.
$248 price target based on replicated price movement.
Apple fundamentals support this.
My article on Apple's buybacks, R&D, and stock price:
wire.insiderfinance.io

AAPL: Sideways Trend(Short Term)Key Points: NASDAQ:AAPL
* Sideways Trend may be continued.
* The price may be stayed between Resistance and support .
Resistance - 192.70
Support - 186.67
N.B:
I am skilled in day and swing trading. Otherwise, I am skilled in technical analysis such as trend, chart pattern, trade set up, entry and target set up, resistance, support, etc.

0.4142 Fib Level example on AAPLThe system works. This is so I can link this idea in my longer idea I am posting shortly.

Resistance and Take Profit"Stock AAPL analysis using the Zigzag indicator, RSI, and technical signals from resistance levels, according to the predicted price, which can be analyzed and tracked further."

aapl worse scenerioA scenerio like that can happen but wont neceserily happen.
its always important to trade with caution
Signals to look for
Death cross
head and shoulders like shown in the chart
bad news
Nvidia falling
spx falling

AAPL : Trade Idea (Short) / Date:24.05.24 Key Points:
1. A short opportunity may be seen here.
2. A small correction is expected
3. 192.26 may act as a resistance
4. 182.62 may act as a support.

AAPL at a crossroadsApple seems to have just broken out of a descending triangle. Although seemingly bullish, there is bearish divergence on the RSI, the stochasting RSI is also pointing straight down on the daily after just crossing (see update below for indicators). A pullback is likely on its way. The interesting thing to watch will be if the previous resistance from that descending triangle turns into support or falls through rather quickly.
In my opinion, the lower volume breakout to me does not ascertain a bullish environment, coupled up with the indicators listed above. Travel with caution in the meantime, it does not seem like the time to chase a trade.


APPLE: Short Trade Explained
APPLE
- Classic bearish setup
- Our team expects bearish continuation
SUGGESTED TRADE:
Swing Trade
Short APPLE
Entry Point - 189.93
Stop Loss - 195.31
Take Profit - 180.47
Our Risk - 1%
Start protection of your profits from lower levels
❤️ Please, support our work with like & comment! ❤️

Apple looking fruity.With strong fundamentals plus released numbers beating what the experts have predicted, is it safe to say apple Inc is heading to new heights? Yes the sales are down.. for now, but have you seen what apple has in store for us in 2025? Quite penny stocks trading and buy right companies at the affordable price.

Short AAPLApple is back at the underside of the 2003 uptrend support, now resistance. Chart AAPL/SPY ratio and it is also at a resistance level.


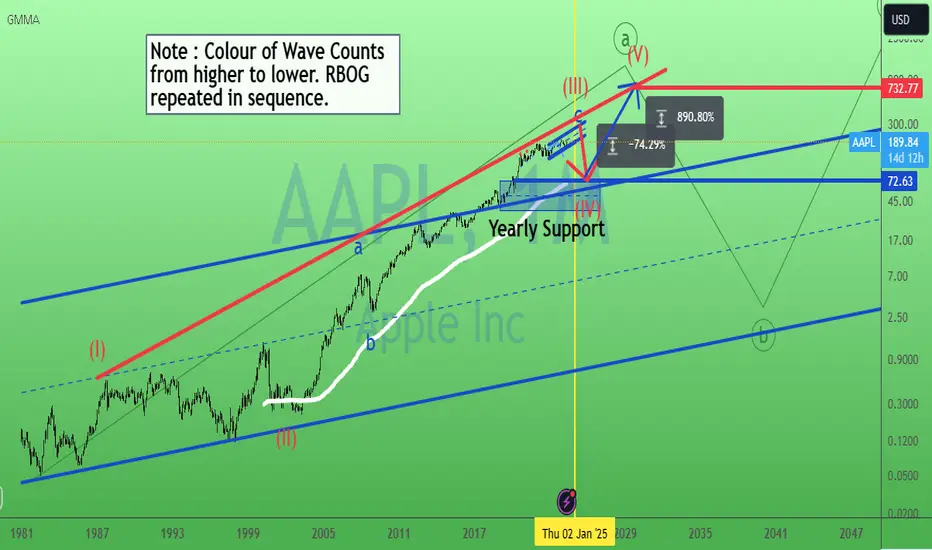
Apple bigger pic. 17/May/24AAPL bigger picture on monthly chart, possible a more than 70% (-74.29&) drop on year 2025 toward 72.63 +/- which is multi confluence zone of 1) Monthly 233 EMA ( thick white MA line) 2)Upper Support of parallel channel ( blue line) 3) Yearly Support Zone.
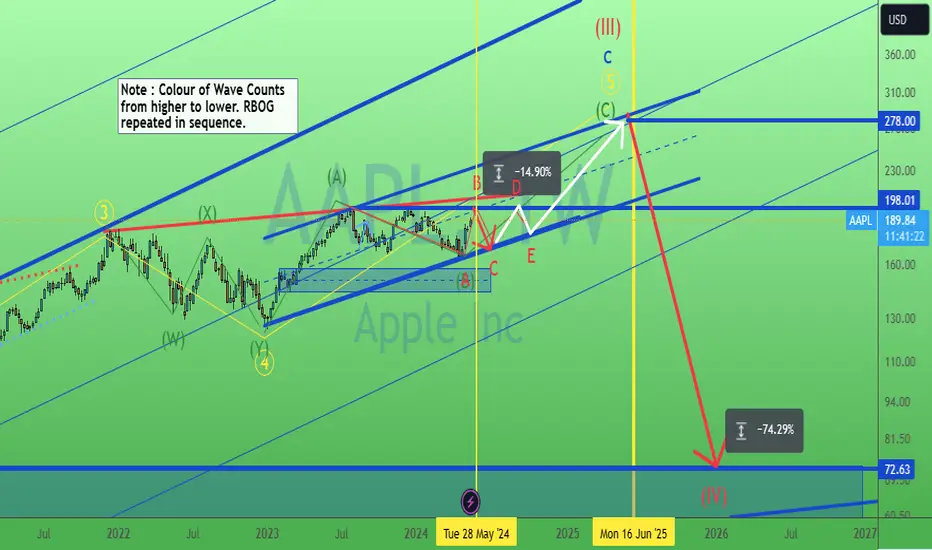
Apple still not out of wood (triangle). 17/May/24AAPL still forming a triangle pattern. Probably a -14.90% drop by end of May ( so sell in May still working") or early June.
Navigating Investment Decisions with Tradingview: Apple exampleHello,
Investing and trading can easily scare participants in most cases. However, the different tools that Tradingview offers can make the work easier for you the investor. In this case I will be using a candlestick chart, a closer look at the price action, The date & price range tool, The vertical line tool and a combination of the financial data provided on the TV platform.
1st, My goal is to seek to understand the company. This can be done on the tradingview platform. This is very important because it builds a base on how the company makes its revenue as well as how its costs would look like. As per the platform.
www.tradingview.com
Apple, Inc engages in the design, manufacture, and sale of smartphones, personal computers, tablets, wearables and accessories, and other variety of related services. It operates through the following geographical segments: Americas, Europe, Greater China, Japan, and Rest of Asia Pacific.
Investing is greatly an act of faith and understanding how the organization has performed in numbers is very key. Although this cannot be assurance that the company will keep performing that way in future, the Tradingview platform gives you a historical view of how the company has performed, its asset quality vs liabilities as well as the cashflow positions. The above for our specific company can be found here www.tradingview.com
Once you have understood the story of the company and linked your narrative to the numbers, very key is to understand key upcoming events for the company and also how investors have reacted to the share price over a considerable period of time.
Our company apple has ranged between prices of USD 165 & USD 200. This is since July 2023. The company continues to be in a range for that period and is currently trading at around USD 168.45. This gives us a great entry price since the company's fundamentals remain quite strong. Using the date & range tool shows us that the company took 99 days to move from price USD 198 to USD 166. This represents an erosion of -16% but still a short opportunity. The company then took 51 days to move back to its top of USD 198 per share.
Just by merely looking at how fast the company is rising when it hits our bottom is great to show that the upwards momentum is stronger. Using this I shall be looking for buy opportunities from our current level with my target at the top.
The vertical line is very key in helping us know where we begin our analysis.
Very key also to bring into the analysis is the aspect of risk management which helps us set targets as well as identify areas where we need to exit our trades & relook at our analysis once again.
Conclusion:
Tradingview offers powerful tools that empower investors to make informed investment decisions. By leveraging features such as financial data analysis, market sentiment tracking, technical analysis, and risk management, investors can navigate the complex world of investing with confidence. Using Apple Inc. as a case study, we've demonstrated how Tradingview's tools can enhance investment strategies and drive success in the dynamic financial landscape.

Apple ,,, Watching In my idea, after confirmation above 187, it will enter to a new uptrend.
Based on my strategy, breakout of a descending trend line then passing out of a price level can be considered as a new trend.
About 180 could be a sure spot for setting the SL.

APPLE TO 189-190NASDAQ:AAPL NASDAQ:AAPL
After breaking through former Bearish FVG, while in a bullish pennant, APPLE has made a breakout. I expect price to reach 189-190 soon.
