AMD BACK TO $200AMD has successfully retested its previous weekly resistance. I have also observed an inverse H&S pattern off of the resistance zone as well which is a strong indication of reversal. I expect this stock to preform well over the next few years.

Atlassian Corp (TEAM) BUYThe paper is in a weakening trend,
but it is now touching the level shown in the picture for the second time.
A rise can be expected again.

NKTX running out of steamAs evident, NKTX is firmly away from the nice bull channel it had found itself in, seems to be losing grip of support, and is in danger of falling into a pretty steep down channel. My short thesis is that the gravity of the situation is too much, and it will break. Stop are above Friday's high.

NFLXPair : NFLX - Netflix
Description :
Double Top
Resistance Level
Completed " 12345 " Impulsive Waves
Impulse Corrective
Break of Structure
CHoCH

RYCEY - potential C&HRYCEY seems to have complete a 5-count EW cycle and is due for a correction. This correction would create the handle of the C&H pattern, fulfillment of the pattern would launch RYCEY into another 5-count EW cycle potentially returning it to pre-COVID share prices.

MARA, gathering strength for multi day gains -- coincides marketMARA tri-monthly chart is clearly showing initial upside shift.
Accumulation and volume has been notable this past few days. Net buyers are definitely positioning in anticipation of crypto market's season breakout.
KEY NOTES:
Tri monthly histogram has registered higher lows -- cementing the current price range as the base for the coming series of ascend.
First "bubble up" volume indicator below indicates warning sign of an incoming series of UPSIDE movement.
Near term goal is x4 price -- with extended high prospect of x10 returns within 12 months.
Spotted at 10.0
TAYOR.
Safeguard capital always.
_______________________________
FUNDAMENTAL NEWS / from tradingview:
Mining Output Up 77% In May
Jun 3, 202306:35 GMT+8
KEY POINTS:
Marathon Digital’s Bitcoin mining output in May is up 77% from the previous month.
The Bitcoin mining firm mined a record 1,245 BTC during May 2023 thanks to increased hash rates and transaction fees.
The Bitcoin miner has increased its Unrestricted Bitcoin Holdings to 12,259 BTC, worth roughly $333 million.
Marathon’s stock (MARA) surged by almost 7% following the latest mining metrics.
Bitcoin mining giant Marathon Digital has reported optimistic metrics for the month of May 2023. The Fort Lauderdale-based firm mined 77% more BTC in May as compared to the previous month. The increase in mining output was attributed to surging hash rates and transaction fees thanks to the growing popularity of Bitcoin ordinals. The Bitcoin miner revealed that in some cases transaction fees were so high that they exceeded the 6.25 BTC block reward.
Marathon Digital’s Share Price Up 7%
According to the unaudited Bitcoin production and miner installation updates published by Marathon Digital Holdings, the Bitcoin mining firm mined 1,245 BTC during May 2023, marking a 77% increase from April. The latest BTC addition brought the firm’s year-to-date mined BTC number to 4,141 BTC. The bitcoin miner also increased its operational hash rate by 9% to 15.2 EH/s and installed hash rate by 13% to 20.1 EH/s in May. The Bitcoin miner has increased its Unrestricted Bitcoin Holdings to 12,259 BTC, worth roughly $333 million.
With the construction of Applied Digital’s facility in Ellendale, ND progressing and optimizations across our fleet continuing, we believe we are on track to reach our 23 EH/s target near the middle of this year.”
Fred Thiel, Chairman and CEO of Marathon Digital Holdings
Marathon’s CEO Fred Thiel stated that apart from the Bitcoin mining operations, the firm also collaborated with Brink to raise nearly $800,000 for Bitcoin core developers, of which $500,000 was contributed by the Bitcoin miner. The latest Bitcoin mining metrics had a bullish impact on Marathon Digital’s stock (MARA). The share price gained nearly 7% after the numbers for May 2023 were released. At the time of writing, the stock was trading at $10.03.

LIDR a technology penny stock LONGLIDR in the past week enjoyed a price and volume surge as can be seen on the 2H chart.
It is currently price at a discount of 99% off the prior ATHs of three years ago. LICR makes the
laser and vision systems to be used in self driving vehicles which is part of the story for TSLA
and others in terms of future growth including the concept of RoboTaxis. That is to say LIDR
is part of the supply chain for EVs and will play a role in their market penetration in future
years. I will take a long trade here and swing it into the next earnings period for LIDR. My initial
target is 4 with a stop loss at 3.25 to be raised as the price moves higher.

Can we go back to reality?Congratulations NVDA, because you delivered everything you could deliver in terms of good results, however, can we get back to reality?
Will the Black Monday that we experienced in 1987, in the DOW JONES index, be experienced again in 2024, and thanks to NVDA and technology companies?
We know what happened between 1980 and 1985 to the American economy, right?
It is known that in the 1980s and early 1990s, dollars could circulate freely around the world, so much so that we had a global economic miracle, and the world was swimming in booming growth.
But, at the current moment, dollars can no longer circulate freely around the world (FED, China, Russia) and continue contributing to global growth? Therefore, the technological war we are experiencing today (chips and electric cars), diverted dollars to these sectors, further inflating this bubble that is about to burst.
Speaking of electric cars, China is firmly dumping its electric cars around the world at very reasonable prices (as it has no intention of breaking its internal market – control), once and for all destroying the automobile industry in many emerging countries, oh my, no?
Let's go graphics.
Monthly: NVDA has reached the three golden levels of the FIB of the SETUP used, so there is nowhere else to go. So, SPX, get ready.
The red lines are resistance points.
Weekly: With the brilliant financial report recently released, prices are ready to seek the golden region of this chart period.
The red lines are resistance points.
Daily. Prices have reached the region of 100% of the bullish pivot.
The red lines are resistance points.
Do your analysis and good business.
Be aware, if you buy, use stop loss.
See other graphical analyzes below.

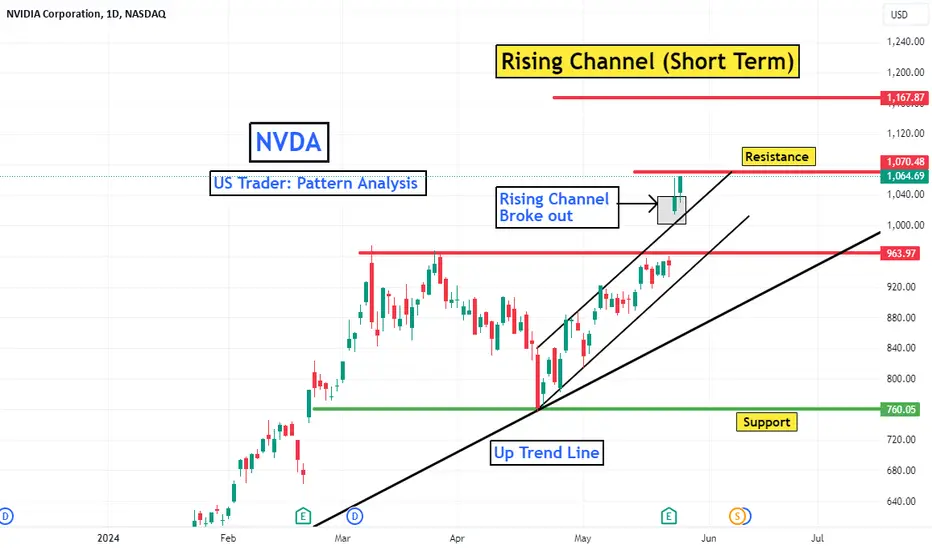
NVDA: Rising Channel (Short Term)Key Points: NASDAQ:NVDA
1. A raising channel shows a clearly defined uptrend. It is generally considered a bullish continuation pattern.
2. A breakout above an ascending channel can signal a continuation of the move higher.
3. A breakdown below an ascending channel can indicate a possible trend change.
Notice :
looking for a job
------------------------
Is Your company hiring an assistant day & swing Trader/ assistant technical analyst/ assistant equity analyst?
I am a day & swing trader, freelancer technical analyst & equity analyst. Now, I am looking for a job .
Skills: Chart analysis, Trend identification, Price pattern recognition, important support and resistance levels identification,
Set up trade idea ( long /short),
Set up entry and target price.
Valuation, making analysis report etc...
Experience: 5 years.
Deckers Outdoor Corp. The Epic Bullish BreakthroughShares of Hoka-owner Deckers Outdoor rose in after-hours trading Thursday after the company handily beat Wall Street expectations in its fiscal fourth quarter.
The stock was recently up 9.4% to $990, following a 1.3% rise at the close. Shares are up about 35% this year as of the close.
The Goleta, Calif.-based shoe and apparel company, which also owns the Ugg and Teva brands, said its sales rose 21% to $959.8 million, ahead of the $888.5 million expected by analysts polled by FactSet.
Hoka brand sales were up 34% and Ugg rose 15%. Teva brand sales fell 16%.
The company posted a profit of $127.5 million, or $4.95 a share, in the three months ended March 31, compared with a profit of $91.8 million, or $3.46 a share, a year earlier. Analysts polled by FactSet expected a per-share profit of $3.10.
Deckers expects revenue to increase about 10% to $4.7 billion in the fiscal year ending March 31, 2025.
The company expects $29.50 to $30 in per-share earnings for the period, compared with the $30.74 a share expected by analysts polled by FactSet.
Technical graph indicates on strong Bullish momentum in Deckers (DECK) shares, that based on my expectations is able to deliver stocks up to $1400 per share.

MARA - Deploy The Lifeboats 😱🙀❗❗Before posting this I did check through the first page of most recent and most popular threads on MARA and it was very interesting to see that every one of them is "LONG" MARA.
So this is a contrarian thread.
And why is that?
Well aside from the skill it takes to make a correct bearish call mid bull market; MARA is a fanboy hype stock.
Most of the posts are based in "technicals" funded by hope .
Hope is not a trading strategy.
Its very interesting because the no.1 Bitcoin miner has looked ugly for quite a while and there have been multi-time frame bearish divergences.
These days TradingView is even kind enough to highlight some of those divergences, but yet apparently no publishers have noticed them.
Yet again they are all too busy looking at the stars ✨.
The blind leading the blind.
Bitcoin slumped today and altcoins took quite a hit.
But MARA was already rolling down the hill for some time and continued today.
So the question; if MARA is plunging while Bitcoin is still yet to reach a conclusive top...
Where will it be if/when Bitcoin does turn bearish ❔
Where will it be at the end of a Bitcoin correction ❓
Probably not all the way up here.
I called this as a weak 1:0.786 three wave correction when MARA was up @$21 back on March 24th.
And so we'll see what how Bitcoin fairs over the weekend.
But I have deep targets for MARA.
Not advice.

TSLA (TESLA) falling continue. Target 150.Hi friend. So we have bears accumulation channel "1" between 166.4 - 186.5. I think in next few weeks price will fall to 150. On a road price have two transit levels 166.4 and 158.7 (there can be correction). Volume analysis based on my author indicators. Levels thanks to X-Lines script.
Follow me;)

Nvidia Where iT Will Break ?Hi mates and Trading community so here i am sharing mine a very simple and ordinary idea on Nvidia on the basis of price action support and resistance but hope it will work and will respect to the marked levels.
So as we can see that price reaching third time to the marked resistance and getting rejections again from there so i marked up an immediate support (920) if price break this and close below we can see price can touch marked target zone below which is also a support zone based target and if price will break resistance and succeed to close above we can see marked potential upside target in coming sessions target taken from the length of consolidation channel.
My view for coming trade execution is not clear so far that is the reason not tagging this publication in long or short category so after any breakout i will update my trade idea accordingly.
This idea is meant for only educational purpose this not any kind of trading or investment advice.
Best Regards- Amit

What's next for #NVDA ? I see $1200+Lovely continuation pattern
$1000 is going to be reclaimed today
And with a potential 20% upside. Expect momentum to help push this thing to these projections.
Best of Luck
Make the most of the meltup!

$NVDA to 1150 by May.. Look back at THEE NVDA call.. #BullflagAfter multiple retests of 61.8 fib, I think JPOW just gave clearance past 1k. I implore you to look at what AVGO did when it broke 1,000 critical level as well as look back at TSLA in 2020 pre/post stonk split. NVDA is now a STONK, and those only go up. AMEX:SPY trend line was regained today, classic shake out before next leg up, thought we'd get a better dip honestly, jobless claims tomorrow probably priced in,,, kind of hard not to long this bull flag setup with the trend on your back, look for cheap 1050c for a couple weeks out is my target. Will post position in AM.

$GME Show me the tendiesIf we bounce from $20.20 (gap needs to be cleared) I would expect a move back to current highs - $64.83.
Once the current high is taken out at $64.83, I would expect a move to my wave 3 target.
It's all doable but will take patience and large amount of buying from retail investors from ITM calls options to send this rocket!
Hindsight is a wonderful thing, so time will tell.
Wave 3 target = $432
Wave 4 target = $65.60
Wave 5 target = $2852

TSLA eyes on $179.94 then 157.16 for possible bottomsTSLA has just hit a Genesis fib at $179.94.
Expecting some bounce but looking lower.
Golden fib below at $157.16 would be ideal.
Here is a full view of the Genesis Fib
See "related Ideas" below for my methodology.

WKHS will it rally 50% or fall below its ATL WKHS has been sideways or down since the bullrun in late February. Another EV small cap
is nearing bankruptcy unless it finds a suitor ( FSR trying to attract Nissan) WKHS has a niche
with its delivery trucks ( like for Amazon Prime and USPS). Is the concept to production
hangups and slow downs going to cause its demise? Trader confidence is lacking or are
traders simply waiting for the best possible price? Price is now about to match the all-imte lows
of mid February. Will there be support or will it fall.? Dould WKHS dead cat bounce to rise
to recent high pivots? This may be interesting and potentially profitable.

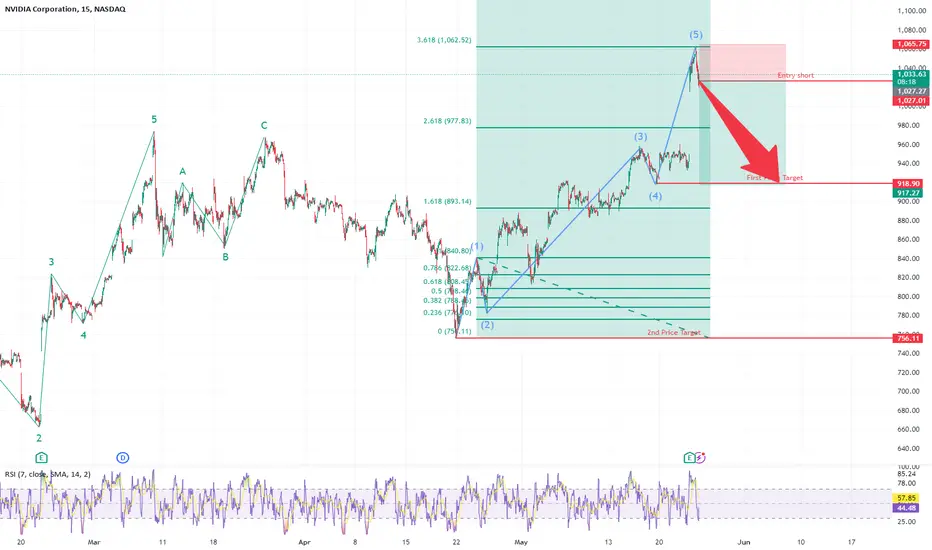
NVDA short: Hit Price Target from Fibonacci extensionI had previously mentioned to wait to short NVDA with resistance around $970 and expected their earnings to push the stock to gap up to just below $1000 (I had expected around $991). But good thing is that it gapped up way above the 2 prices mentioned above and actually made a perfect top at the Fibonacci extension level. Meaning if people had waited according to what I said, they could enter the short position at a much more favourable price.
TSLA MEGA Bearish StructureTime for a new updated chart in TSLA.
TSLA has now formed a MEGA Bearish structure. While we are not near a Key area at the moment. The initial formation does not look good for the Bulls going forward.
At this point, it would take a lot of effort (buying) to change the message of the market in this chart. While anything is possible it does not appear likely at this point.
Having said that it can still bounce around in the middle of nowhere since the structure is so big, but the results will reveal themselves in time. For this reason, I will go ahead and mark it as bearish.
CAUTION! is in order.
Here are some of my previous charts and calls in TSLA. As you can see I don't miss too often in this name.

GILD will be selected for the new Tamiflu vaccine for Pandemic2It's no secret the elite are manufacturing pandemics to herd, destroy and remake society into a neofeudal system controlled by social credit scores. The next pandemic will be H1N1 which has already been shared within the news that milk in the markets has trace amounts of (no worry they say!).
After the establishment rolls out bird-flu for everyone's summer bingo card - Gilead Sciences, the only company that manufactures Tamiflu with options, will be selected to mass create these new vaccines.
The call options on this company are going crazy right now, July, August have a ton of OTM calls being bought, almost like someone is expecting this company to get the greenlight on something major. You could effectively buy .05 OTM calls on this company, but I'd wait a little longer. The TTM squeeze shows the last leg down is being finished. If the market's capitulate a little more, this would be a perfect time to buy those calls for this company.

Newegg bottoming might be in progress? First target 2.30 USDI have following newegg for quiet a few years now. Tehcnicly it is possible we have either bottomed, OR will bottom in the very near future.
From an elliott wave perspective I have 2 scenarios, where scenario one assumes we have already bottomed in the consolidation zone down around 1 USD. (Even if we have not bottomed, we gonna get a bigger ABC-or WXY correction possibly reaching at least the 1:1 target).
It is possible (but not guaranteed) we have put in the first subwave 1 as a leading diagonal (expanding rising wedge), where we have moved in 3 counts in each wave as an abc (watch for extended trading hours!!!).
We could argue where is the white wave 1 top - either we had an overshooting b wave and the yellow c wave already bottomed as well (possible), OR the b wave currently forming and will followed by the yellow c wave down, but keeping the higher low overall.
I am scaling in slowly on the pullbacks for now with the stoploss just under 1.00 USD. Since it is a leading diagonal at best, we cannot really trust it until it proves itself. I am waiting to see a more defined abc pullback structure for now, support areas are added.
Overall we have just danced around the 200day MA, 180day MA provided support, all the other moving averages (9/21/50) are below us, in case pullback coming possibly giving as more support. Daily RSI and MACD turning upside, selloff slowing down, and about to diverge (already in convergence). Weekly datas getting stronger (RSI/MACD), and currently we are above the defined baseline, which will also possibly provide support on pullbacks. Whoever like formations, seemingly we are forming a bigger falling wedge (bullish), even is the lows not in YET (then it is quiet near probably). Also, it is not uncommon that if wave 2 have finished and starting/started the white wave 3, will form some kind of inverse head and shoulders, watch for that as a little confirmation (still not guarantee).
Overall I think it has a good chance now to bottom and start an upside cycle.

Dont Miss the 'Byte' APPLEHello Traders,
This is our view on Apple Stock. After made a bearish movement rolling from $200 to $165 for past 4months, the price has gapped up to $185% on last Friday. The price has nicely land on bearish equidistant upper channel and retesting. If all goes well, we can expect the price will fill the previous gap and rally up again towards $200 mark and making a Famous Pattern. What do you all think?? If you like this idea, help me to boost it. Thank You. Have a great day!
