UCAD FOR BULLISHBe patient as the market fooling us hahaha. Let see if this structure can give me some money. Last week gained 100 pips and decide to close all entries before news. I still at the bullish side.
USDCAD trade ideas

USD-CAD Crosses above the channel boundary and risesTraders! USD/CAD is rising against the upper boundary of the large symmetrical triangle price pattern, there is a risk of a breakout to the upside as the NFP fundamentals are quite good so we believe the price will create a bullish wave .
But overall on the USDCAD chart, although the uptrend is still well supported, there are signs of a potential top at 1.3786. I expect a correction to accumulate before the upside. Chief returns. The 1.3650 zone is the final support the bulls need to hold the price in order to strengthen, a break below this level will result in a significant decline in price.

Potential Long on UCI am not really sure about this. The area of interest is a 50% POI, and the next SWL is doable, but beyond that, not really. 20 PIP + SL aren't good.
Ideally, the price would come down lower to the prior areas of mitigation and sweep, and then back up, which would be the best option, but it may not as we have a WH at the top, and the momentum is bullish.

USDCAD Let's take off Not much to be said except get ready for take off flight taking off in 45 minutes

USDCAD: First red day in the backside moveHi everyone and welcome to my channel, please don’t forget to support all my work subscribing and liking my post, and for any question leave me a comment, I will be more than happy to help you!
“Trade setups, not movements”
1. DAY OF THE WEEK (Failed Breakout, False Break, Range Expansion)
Monday DAY 1 Opening Range
Tuesday DAY 2 Initial Balance
Wednesday DAY 3 (reset DAY 1) Mid Point Week
Thursday DAY 2
Friday DAY 3 Closing Range ✅ Day 2 cycle
2. SIGNAL DAY
First Red Day ✅
First Green Day
3 Days Long Breakout
3 Days Short Breakout
Inside Day
3. WEEKLY TEMPLATE
Pump&Dump ✅
Dump&Pump
Frontside
Backside
4. THESIS:
Long: secondary, I saw many times monday placing the high low of the week (opening range), and market coming back into that level for a breakout, pullback, continuation into the original trend, however, considering the market overall in the backside move, counter trending (as a scalp), will be my second option if a buy low opportunity is presented.
Short: primary, first red day, yesterday the HOW failed and started dropping down with interesting bearish momentum. Waiting the news release before looking for a sell high opportunity, going to stop traders long from Tuesday.
Please note that the purpose of my analysis is to help me and you hunting the best trade setup for the day, none of my technical aspects are a way to forecast any directional market movement.
Gianni

USDCAD Expected move today USDCAD is expected to respect our -OB which was respected before in the past

USDCAD - Change of Character Hello Traders !
On Monday 3 June, The USDCAD reached a strong support level (1.35898 - 1.36168).
Today, The price broke the lower high (1.36687 - 1.36549).
So, I expect a bullish move📈
--------------
TARGET: 1.37170🎯

USDCAD: Short Signal Explained
USDCAD
- Classic bearish formation
- Our team expects fall
SUGGESTED TRADE:
Swing Trade
Sell USDCAD
Entry Level - 1.3731
Sl - 1.3764
Tp - 1.3676
Our Risk - 1%
Start protection of your profits from lower levels
❤️ Please, support our work with like & comment! ❤️

USDCAD Will Go Higher From Support! Buy!
Here is our detailed technical review for USDCAD.
Time Frame: 5h
Current Trend: Bullish
Sentiment: Oversold (based on 7-period RSI)
Forecast: Bullish
The market is testing a major horizontal structure 1.362.
Taking into consideration the structure & trend analysis, I believe that the market will reach 1.367 level soon.
P.S
The term oversold refers to a condition where an asset has traded lower in price and has the potential for a price bounce.
Overbought refers to market scenarios where the instrument is traded considerably higher than its fair value. Overvaluation is caused by market sentiments when there is positive news.
Like and subscribe and comment my ideas if you enjoy them!

UC for bulls.Welcome back traders. We see how UC has formed a triple top pattern on the monthly+ timeframes. First spike was January 2016 to 1.46. Then second spike in March 2020. And finally we can see in 2024 I predicted by may it would go up. but it retraced. Lets see if June can complete the final leg up. Drop a like if you agree also follow me to stay updated on my future posts. As always comment down below if you disagree and why. Thanks!

Elliott Wave Analysis: Anticipating an Upward move in USDCADHello Traders,
Trust you are great.
Below is my Elliott wave analysis of USDCAD currency pair
Analysis:
The structure of the USDCAD currency pair suggests the formation of an irregular Flat corrective pattern. The initial Wave A has taken the form of a leading diagonal, moving downward.
Current State:
Wave B appears to have completed its formation. The next expected movement is the formation of Wave C.
Expectation:
An impulsive Wave C is anticipated to move upward towards the 1.37445 - 1.38147 region before a subsequent decline.
Invalidation level for the upside projection: 1.3605.
Cheers!

USD-CAD Strong Support! Buy!
Hello,Traders!
USD-CAD is again retesting
A horizontal support level
Of 1.3602 but its a strong
Key level so one move
Local bullish rebound is
To be expected
Buy!
Like, comment and subscribe to help us grow!
Check out other forecasts below too!

USD/CAD Analysis: Bank of Canada Cuts Interest Rate by 0.25%USD/CAD Analysis: Bank of Canada Cuts Interest Rate by 0.25%
This occurred yesterday and was in line with analysts' forecasts, according to a Bloomberg survey.
According to statements from the Bank of Canada:
→ Price growth indicators for consumer price index components have further decreased and are close to their historical average;
→ Recent data has increased confidence that inflation will continue moving towards the 2% target;
→ Monetary policy no longer needs to be as restrictive.
At the press conference, Governor Tiff Macklem stated that there is “compelling evidence” of weakening inflation and it is “reasonable to expect” further rate cuts if inflation continues to slow.
Technical analysis of the USD/CAD chart:
→ Since mid-April, the market has been in a downtrend (indicated by red lines);
→ Simultaneously, a longer-term uptrend is shown by the blue channel;
→ Overall, the price is being squeezed into a symmetrical triangle between the upper red and lower blue lines, with the axis around the 1.3671 level acting as a "magnet," indicating a stable balance of supply and demand. Yesterday’s news caused a spike in volatility, with the USD/CAD price attempting to break the upper boundary, but the breakout was false (indicated by an arrow), and the price returned to the axis where it was before the announcement.
Thus, it can be concluded that the market had anticipated the rate cut, and it was not a surprise. This means that fluctuations within the triangle may continue until a fundamental event occurs that can lead to a breakout of this consolidation pattern in technical analysis.
Analysts at Think.ING predict a possible decline in the USD/CAD rate to the 1.35 level in the second half of 2024.
Trade over 50 forex markets 24 hours a day with FXOpen. Take advantage of low commissions, deep liquidity, and spreads from 0.0 pips. Open your FXOpen account now or learn more about trading forex with FXOpen.
This article represents the opinion of the Companies operating under the FXOpen brand only. It is not to be construed as an offer, solicitation, or recommendation with respect to products and services provided by the Companies operating under the FXOpen brand, nor is it to be considered financial advice.

USDCAD SHORTThis is just simple trading idea draw into chart using labels and lines. Please use it as educational purpose and you are free to modify any

USDCAD LongLong USDCAD:
Rejection off range low, breakout through countertrend line and head and shoulder.
Going in line with current fundamental biases for higher rates for longer from the FED and rate cuts this week from the BoC.
Keep in mind there is lots of high impact data this week for both the CAD and USD, weekly options expiries might be the safer choice around this potential volatility

USDCAD Target SmashedJust as predicted, USDCAD has completed the move to the upper part of the triangle. Partially waiting for confirmations for the next move
.

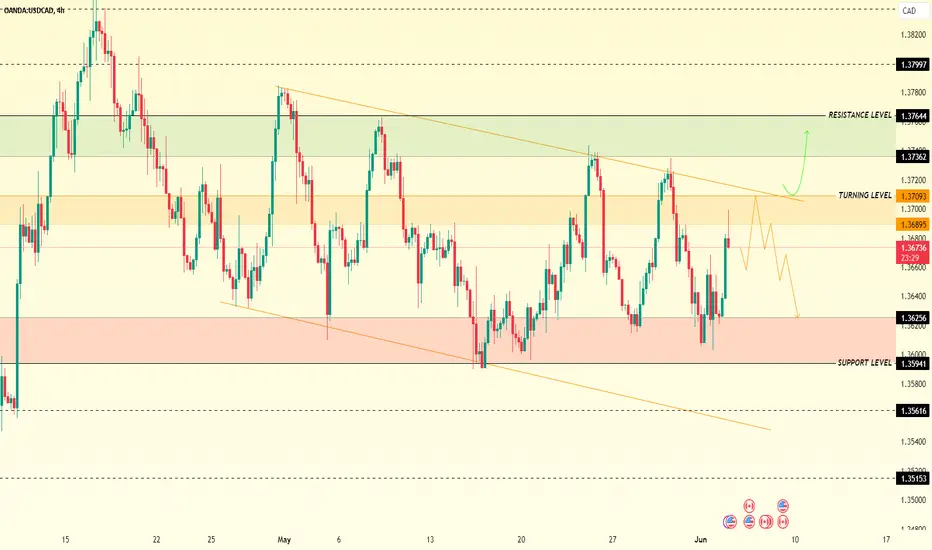
USDCAD ( 4H )USDCAD
Tendency the price is under bearish pressure between 1.36895 and 1.37093
Turning level : The turning level between 1.36895 and 1.37093 so as long as the price below this level, there will be a bearish trend
resistance level : Breaking the turning level 1.37093 , the price will rise to 1.37362 as long as the price stabilize this level , there will be reach 1.37644
support level : The trading stabilizing below1.36895 the price will reach the support level of 1.35941, and under this level it will be reach 1.35611
corrective level : price will attempt between between1.36895 and 1.37093, correct itself before falling
USDCADWe are waiting for the market, the purchasing area, to react to us and buy from the area we have specified


correction It is expected that the corrective trend will form up to the specified support ranges and then we will see a change in the trend.
It is expected that a trend change will be formed in the specified time frame and we will see the beginning of the upward trend

USDCAD1. the price is being created is a corrective move
2. Following the move it makes, it is going the high liquidity zone where the price moved by impulse.
3. As we see there is trendline liquidity which can be swallowed and move up again
4. We wait if it will eat all the liq down and join the move up.
#This is not a financial advise

USDCAD to $1.50 and beyondCanadian housing market is weak.
Bank of Canada needs to set interest rate low to bail out home owners and boomers
CAD is the next peso.

USDCAD demand bounceBullish bat = Reversal
Demand tap and bounce = Signal
Target = Next supply (bat recent high area)
