Bounce bit Long IdeaBounce bit although new coin has shown significant strength. On the daily chart, it looks to have retraced closed to the 0.5 Fib levels. If the area holds and we see volume, price could move to the 1.618 levels around 1.084.
These ideas are mine alone and do not constitute financial advice.
Crypto market

GTAI/USDT : Get Ready for another Bullish Swing ! (READ CAPTION)By checking the GTAI/USDT chart in the 12-hour time frame, we can see that after the last analysis we had, the price started growing again and reached $1.60 with an 8% yield! Every time I post an analysis of this cryptocurrency, we see a very attractive growth of it, today again the price has doubled the attraction of buying, both for those who are holders and those who are Scalpers! The expected yield of this cryptocurrency will be 30% to 44% in the short term and 180% to 250% in the long term!
Please support me with your likes and comments to motivate me to share more analysis with you and share your opinion about the possible trend of this chart with me !
Best Regards , Arman Shaban

BTC - Short-term View!Hello TradingView Family / Fellow Traders. This is Richard, also known as theSignalyst.
📈 BTC has been overall bullish, trading within the rising channel in blue.
Currently, BTC is undergoing a correction phase and it is currently approaching the lower bound of the channel.
Moreover, it is retesting a structure and trendline in red.
🏹 Thus, the highlighted blue circle is a strong area to look for trend-following buy setups as it is the intersection of the red structure and lower blue trendline acting as a non-horizontal support.
📚 As per my trading style:
As long as the red support zone holds, I will be looking for bullish reversal setups (like a double bottom pattern, trendline break , and so on...)
📚 Always follow your trading plan regarding entry, risk management, and trade management.
Good luck!
All Strategies Are Good; If Managed Properly!
~Rich


JTO ANALYSIS (4H)It seems that the price is in a large range, which is moving from the upper part to the lower part of this range.
The green range is a support range.
The price can move from this range to the targets.
The targets are clear on the picture.
Closing a daily candle below the invalidation level will violate the analysis
For risk management, please don't forget stop loss and capital management
When we reach the first target, save some profit and then change the stop to entry
Comment if you have any questions
Thank You

#FLOKI / USDT inverted head and shoulder. What is next?CRYPTOCAP:FLOKI gained 20% yesterday, indicating that its previous consolidation phase has ended. Are we going to see more uptrend?
What do we know?
CRYPTOCAP:FLOKI has a motivated team with a roadmap to become the most traded crypto in the world!
CRYPTOCAP:FLOKI has just been listed on Coinbase perp futures, similar to CRYPTOCAP:BONK and $PEPE. This shows that it is likely following in their footsteps, albeit a little later; both saw a 50% increase after their listings.
CRYPTOCAP:FLOKI has some utility compared to other memes, with integration into TokenFi, use as the native currency of Valhalla (a metaverse), and other projects.
Regarding the charts, I see an inverted head and shoulders pattern, a bullish signal with a target of 0.0004754, which represents a 65% pump. This aligns with the pumps seen in CRYPTOCAP:PEPE and CRYPTOCAP:BONK after their Coinbase listings.
I also see a parabolic trend that seems to continue for now.
There is a bearish divergence due to a CRYPTOCAP:BTC dump, which pushed down the RSI in the middle of the uptrend. In my opinion, this will not have any lasting effect since it was due to an external, temporary factor, but it needs to be mentioned.
The take profits are the fib extension.
Not a financial advice, DYOR.

SOL: Pullback in UptrendTrade setup : Price is in an Uptrend. Pullback near $160 support and long-term up trendline ($143) could be an attractive swing trend entry in Uptrend, with +25% upside to $200. Stop Loss (SL) level at $140.
Pattern : Pullback in Uptrend . Price remains in an Uptrend but has pulled back, which could present a 'buying dip' opportunity. Traders should look for the nearest support level where price could stabilize and resume its Uptrend. This support level could be a level where price bounced off of in the past, or a level that was previously resistance. (concept known as polarity).Learn to trade key levels in Lesson 3.
Trend : Short-term trend is Up, Medium-term trend is Strong Up and Long-term trend is Strong Up.
Momentum : Price is neither overbought nor oversold currently, based on RSI-14 levels (RSI > 30 and RSI < 70).
Support and Resistance : Nearest Support Zone is $160.00, then $125.00. Nearest Resistance Zone is $200.00.

BNBUSDT ready for a breakouthi traders,
Let's take a look at BNBUSDT on 1D time frame.
It looks like we're going to get a breakout in the next few days.
RSI in a neutral zone.
Enter the log position once we get a successful breakout.
Target: 772 $
Good luck

MDT/USDT Breakout alert!! This is bullish momentum for the move!💎 Paradisers, MDT is indeed displaying intriguing movements that demand close attention.
💎 The successful breakout from the descending channel is certainly a bullish signal for the movement. With the price already retesting the trendline, it appears poised for further upward movement towards the next target, which lies within the supply area of 0.09 to 0.0967.
💎 A successful breakout above this supply zone would confirm MDT's return to a bullish trend, potentially leading to significant upward momentum towards our target strong resistance area.
💎 However, if MDT fails to sustain above the supply area and experiences a strong rejection indicated by a bearish candle, there's a possibility of a retracement back to the downside.
💎 In such a scenario, the price could revisit the demand area and even potentially drop to the strong support area around 0.0555.
💎 When MDT reaches the strong support area, it's crucial for it to bounce back and resume its upward trajectory in order to make another attempt at breaking the resistance. Considering MDT's history of bouncing off key support levels, there's a chance it could repeat this pattern and move back towards the upside.
💎 It's important to remain vigilant and monitor MDT's price action closely. A breakdown below the demand area, confirmed by a daily candle close below it, would invalidate the bullish scenario and could lead to further downward movement.
MyCryptoParadise
iFeel the success🌴

LOBO: $0.00 17 | The Wolf in BTC's Runes Protocol a fungible token
only housed contained in the most secured and refined network
enhanced from the STACKS protocol (BTCS layer 2 think MATiC of ETH)
RUNES is a refined version of ORDiNALS in creating projects tokens etc..
Ordinals caused downtime in the BTC network calling attention of issuers to stop creating memes coins ... RUNES solves that problem...
in a NUTSHESLL.. this LOBO meme coin is like DOGE on ETH or LandWOLF on AVAX
for more in depth appreciation
just back read threads on STACKS ORDINALS BITMAP ... its quite a trip to the next EVOLUTION of Bitcoin which is MULTIVERSE
minting and dealing in MAGIC EDEN to setup wallet is a pain in the neck ..
just buy in DEX and submit your wallet address for AIRDROPS ALLOCATION in the future

KNC/USDT It will be bullish momentum if success break the supply💎 Paradisers, KNC is indeed presenting intriguing movements that warrant close observation.
💎 The successful break of the supply zone and transition to the demand area in the lower time frames indicate a potential shift in momentum.
💎 Currently, the price is testing the demand area following a strong rejection at the supply zone, which lies between 0.7 to 0.738. There's a possibility that KNC may attempt to move upward again to break through the supply area.
💎 If successful this time, it could signal a bullish momentum, potentially leading to the achievement of our target.
💎 However, if KNC fails to break above the supply area once more and experiences a strong rejection indicated by a bearish candle, there's a likelihood of a retracement back to the downside. In such a scenario, the price could revisit the demand area, which ranges from 0.620 to 0.58.
💎 KNC must bounce from this demand area, especially considering the presence of a support trendline within it. A breakdown below the support trendline could indicate a bearish trend shift, potentially leading to further downward movement toward the support level around 0.534.
💎 When KNC reaches the support area, it must bounce back and resume its upward trajectory, potentially making another attempt at breaking the resistance. Given KNC's historical behavior of bouncing off key support levels, there's a possibility of a similar scenario playing out, resulting in a return to upward movement.
💎 However, traders should remain vigilant and closely monitor KNC's price action. A breakdown below the demand area, confirmed by a daily candle close below it, would invalidate the bullish scenario and could lead to further downward movement.
MyCryptoParadise
iFeel the success🌴

Solana (SOL): Gameplan We Wait For = Selling ScenarioSolana is moving nicely after forming that local top near $188.
Ever since, the price has moved smoothly to lower zones, testing the EMAs and still pressing the zone there.
We are waiting for a clean breakdown from there and a potential movement to the lower support zone (or at least movement towards it).
Swallow Team

Sol / TetherUS _ Distribution price _ For 1st _ Week _ June. Sol / TetherUS _ Distribution price _ For 1st _ Week _ June.
Distribution price = $208.63
Market will take few weeks break from here for purpose of repeat cycle and expecting the drop to the level of $124.78

What's cooking with Bitcoin? BTCUSDTOn the daily timeframe, BTCUSDT is forming a large ascending triangle pattern. There is strong resistance at the current all-time high (ATH) levels. We can expect multiple retests in this supply zone. If BTC consolidates within this range and positive sentiment persists, we may see a breakout to the $84,000-$85,000 levels. The trendline will act as interim resistance.
However, if negative sentiment prevails, there is a chance of breaking down from this pattern.
Both the momentum (10) oscillator and the 100-day Moving Averages are signalling bullish trends. This suggests potential upward movement in BTC’s price.

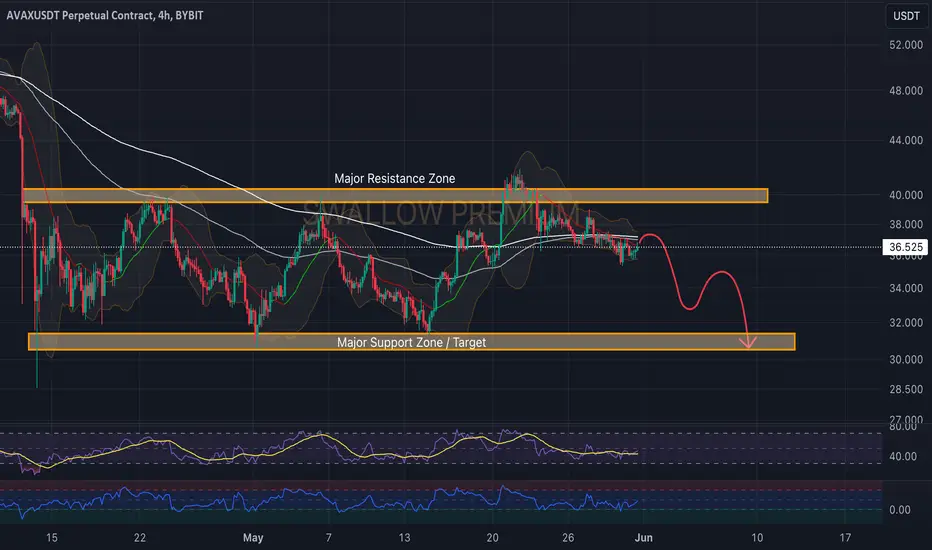
Avalanche (AVAX): Possible Rejection From EMAs (100&200)Avalanche has had a nice rejection and now broke also EMAs (where price is currently re-testing them).
We are waiting for that rejection to be successful, which would result in further movement to lower zones, towards the support zone.
Swallow Team
BITCOIN SELLBTCUSD looking continues to sell side trend line breaked another candle fall sell side momentum last one week its struggling in this area it shows no more buyers there ... so need liquidity down side 1:2 RR

$$$btcusdt, A new High is going to be formedWelcome, Trader. Welcome to our cryptocurrency community! 🚀We are delighted to welcome you, whether you are an experienced trader or a newcomer to cryptocurrency.
We are going to discussing #BTCUSDT 💹
#BTCUSDT 🔥🚀
---------------
Update:
#BTC forming a triangle pattern over a 4Hr time frame 👉✅.
Now it's ready to break this pattern
In case of successful breakout, We are expecting that #BITCOIN hit 73K 💰 very soon
Crypto Analyst Hub
#crypto #cryptocurrency #bitcoin #ethereum #blockchain #btc #cryptotrading #cryptonews #eth #cryptocurrencies #nft #bitcoinnews #bitcoins #trading #bitcoinmining #forex #binance #cryptoart #nfts#trading #forex #trader #investing #stocks #forextrader #stockmarket #daytrader #forextrading #invest #bitcoin #daytrading #cryptocurrency #crypto #investor #investment #forexsignals #nse #chartpattern #cedarforex #candlepatterns #learntrading #bseinstitute #shorttermtrade #bankniftytrading #stockmarketph #calloptions #mqlsignal #futuretrader #tradingmemes #chartpatterns #tradingview #tradinglife #tradinglifestyle #tradingstrategy #tradingtips #tradingplan #tradingsignals #tradingaccounts #tradingsignal #tradingforex #tradingsync #tradingroom #litecoin #ethereum #bitcoincash #cryptocurrencies #ripple #btc #bitcoinnews #bitcoinmining #blockchain #eth #bitcoin #bitcoins #coinbase #cryptocurrency #crypto #bitcointrading #dogecoin
BTC
ETH
USDT
PEPE
DOGE
ALT

Lingrid | BTCUSDT long term TARGETBINANCE:BTCUSDT made a significant surge on May 20th, and since then, the price has been oscillating within a narrow range zone. As we can observe, the price action is gradually narrowing down, indicating a potential breakout. On the weekly timeframe, an inside bar formation is developing, which suggests that the price may be building up energy for a move. Additionally, on the 1H chart, we see a double bottom formation, which could be a sign of a potential reversal. If the market respects the support level, it's likely that the resistance zone will be tested. The market is also forming higher lows and lower highs, which is characteristic of a triangle pattern. Bitcoin market has a history of reacting positively to this pattern. Given this setup, I expect the current sideways move to continue until we see a clear trend direction emerge. My long term goal is resistance at 80000
Traders, if you liked this idea or if you have your own opinion about it, write in the comments. I will be glad 👩💻

Are you feeling lucky? Trading is all about patience, managing positions efficiently and most importantly how risk adverse one could possibly be when a probable path for an asset emerges. BTC kept going up irrespective of Fed's rate hikes and the bond futures situation which was not to be expected. This was attributed to the institutions getting in and ETF's being approved. The problem with human nature is to always look at everything as a cause and effect pair. We seek to find cause to predict the future and use the effect to explain after something has already unraveled. Now that inflation seems to be mellowing out on paper even though you don't feel it in real life and the rate cuts hovering near the horizon, how would BITCOIN react? Will this cause lead to an effect and will that effect align with probable path that's emerged? Only time will tell!
Institution or retail, markets don't heed to anyone and everyone will bleed if you don't have patience or cannot manage your positions effectively!

FLOKI: Keep an eye on this level! Floki had a nice cool-off, and it could be ready to bounce back harder! If you're looking to trade FLOKI at the moment, here's a quick setup that you might find helpful!
The idea is: Buy when the price breaks above 0.000268$ and take profits at the levels shown in the chart.
Targets:
1. 0.000279$
2. 0.0002315$
3. 0.00034$
4. 0.0004$
-------------------------------------------
About our trades:
Our success rate is notably high, with 10 out of 11 posted trade setups achieving at least their first target upon a breakout price breach (The most on TW!). Our TradingView page serves as a testament to this claim, and we invite you to verify it!

BTCUSD SELL Bitcoin sell side analysis successfully completed 👍
160 pips profit running 🏃♂️ 👏
Near to hit TP power of good analysts

Eth Pump soon $3900Waiting for Eth confirmation to long.
Inverse head and shoulder
4hr 50 ema bounce
Attempting 1hr - 4hr bullish trend shift
Daily and weekly bullish
Waiting for retest entry.

BITCOIN ETF: $49 MILLION USD NET FLOW CAUSES WEEKEND FRENZYWelcome to our financial bulletin! Once again, the cryptocurrency market has become the center of attention with the emergence of a staggering net inflow in the Bitcoin ETF sector.
The inception of a Bitcoin ETF has provided a positive shock to investors. Over the past weekend, a net flow of $49 million USD was recorded, prompting the entire market to pause and ponder the implications of this event.
Net flows have consistently poured into Bitcoin ETF funds for 13 consecutive trading days, indicating a positive upward trend.
However, I predict that the Federal Reserve's interest rate cuts may lead to cautious evaluations and keep the cryptocurrency market sideways. And Bitcoin is currently at a crucial support level, if this support level is breached, the market will witness a significant decline in Bitcoin prices.
Thank you all for tuning in to our news. Stay tuned for the latest and most accurate updates.
