BTC DISTRO distribution in MAI 2021 , for future reference this is how whales create tops. remember this chart setup and
you will find it everywhere !
BTCUSDT trade ideas

Btc4hBitcoin can climb from the current point to targets 1 and 2, and from there it must decide whether to break the ceiling or go down to 61,000.
Bitcoin latest news interpretation and market analysis!Hello, Traders! Today, We have to Speak about King “₿”.
The Bitcoin Halving usually represents a significant milestone in the cryptocurrency's ongoing evolution. Satoshi Nakamoto programmed an event into the Bitcoin network every 210,000 blocks or approximately every 4 years. This will continue until the mining of 21 million coins (estimated to occur in ≈2140) marks the end of the cryptocurrency's issuance. To gain an understanding of its impact, it is necessary to analyze historical data:
1st Halving (Nov 2012): Price was ≈$12.0 (Pre-Halving), escalating to an unprecedented peak of ≈$1.240 in November 2013.
2nd Halving (July 2016): The price stood at ≈$600 (Pre-Halving), surging to a remarkable high of ≈$19.756 in December 2017.
3rd Halving (May 2020): The price was ≈$8.500 (Pre-Halving), catapulting to a new pinnacle of ≈$64.800 in April 2021 and ≈$69.000 in November 2021.
4th Halving (April 2024): At the time of this writing, the price has risen from ≈$64,000 to nearly $66,000.
In Bitcoin's early days, miners received 50 BTC for every new block they added to the blockchain. However, after the 1st Halving (November 2012), that dropped to 25 BTC. Then, after the 2nd Halving (July 2016), it became 12.5 BTC. After the 3rd Halving, it's down to 6.25 BTC. The 4th Halving (April 2024) reduced the reward from 6.25 to 3.125 BTC.
A review of historical data indicates that, in the period following each halving of Bitcoin, prices have consistently risen within a span of six to twelve months. However, the current situation is distinct. Why? This time, the price of Bitcoin reached a new high before the halving event occurred. The graph reveals that the previous ATH was achieved in November 2021 but was subsequently surpassed on 24 March 2024. It is noteworthy that the halving event occurred on May 1, 2024.
However, it's crucial to note that the relationship between halving events and price fluctuations is complex and multifaceted. It is not just expectations and moods. Numerous factors, including market fundamental events and technological developments, contribute to Bitcoin's price dynamics. This time around, the landscape surrounding the Halving Event is undeniably different, characterized by numerous vital factors that distinguish it from previous cycles.
Foremost among these differentiators is the advent of spot Bitcoin Exchange-Traded Funds (ETFs) in the United States, marking a significant milestone in Bitcoin's integration into mainstream finance. Introduced by prominent financial institutions, these ETFs have swiftly garnered attention and investment inflows, reshaping the market structure.
The launch of spot Bitcoin ETFs has been met with enthusiasm, evidenced by impressive net inflows totaling over $12 billion within a short span. While recent data indicates a slowdown in net inflows and a temporary outflow streak leading up to the halving, the long-term implications of these ETFs on Bitcoin's demand dynamics are profound. Consistent daily inflows into these products could provide significant support for Bitcoin's price, particularly as the rate of newly mined Bitcoin decreases post-halving.
With the Halving Event now behind us, what's in store for its future? Time will reveal the answer, but with these fundamental factors in play, one can't help but hope for the best. What do you think?

Bull trap + bear trap???BTC touches the base of the bullish channel on 1h charts.
For now, BTC remains bullish.
These are the support and resistance levels that we have to take into account.

🅱️ Bitcoin Headed To $100,000!!! FOMO! Warning! Must Read!There is no need to panic, cancel any trades nor act fast; there is always time... Did we miss the bullish wave?
It is true that Bitcoin is now showing multiple very strong bullish signals and this is no cause for alarm; Bitcoin being bullish is always good for us and the Cryptocurrency market as a whole. We love Bitcoin/Crypto!
First, the chart:
➖ Bitcoin closed weekly full green and back above EMA10. This means that the bulls are in full control when it comes to the short-term potential. Where the action is headed next.
➖ Next, Bitcoin is trading above $60,000 which is ultra-bullish and this after months of a strong distribution/consolidation phase...
What will happen next?
What happens now?
👉 Yes Bitcoin is bullish and set to move to $100,000 and much, much higher in the long-term but, regardless of the short-term noise, we will see a crash in the coming days.
Bitcoin is likely to produce a lower high, not move higher and retrace to hit new lows before the major bullish wave. This fact doesn't change even though, Bitcoin is bullish!
Thanks a lot for your continued support.
Namaste.

BITCOIN to 130k by April 21 of 2025BITCOIN to 130k by April 21 of 2025
retest of the bigger triangle

Bitcoin is going to shoot up to $112k+ in June / JulyAll details are drawn on the chart.
Basically BTC is in a huge bull market with a clear imbalance of demand and supply. There was 3-month long reaccumulation period at all time high of $69500 with all outstanding supply bought up. Price is gonna shoot up to $112k at minimum very swiftly.

78980 next tp BTC now prepared for new ATH which will be around 78980 plus minus , this may be the last rally of 1st bullish rally , still time to decide , if this is last rally which confirmed triggered recession pullback of all world financial intrument to ground , floor inclu nasdaq gold

Trust the planIt's been the same every time on the channel. While this time may be different, we are still on the symmetrical pattern. I also see a lot of charts pointing to ever decreasing targets, which often means they are getting greedy. Follow the MM plan.

Lingrid | BITCOIN quick PULLBACK from the RESISTANCEThe price perfectly fulfilled my last idea. It hit the target zone. BINANCE:BTCUSDT has finally hit the strong resistance level on the daily timeframe, a barrier that has been holding price movements since March. Despite the overall bullish trend, I anticipate a potential quick retest of the support level as the price action appears to be losing momentum. The absence of significant buying pressure, marked by the lack of large bullish candles, suggests that the market may be poised for a correction. With the price approaching the previous month's high, we may witness a bearish move from this area. I expect a short-term pullback to a key level, where the market may reassess its trajectory. My target is the support level at 70,000
Traders, if you liked this idea or if you have your own opinion about it, write in the comments. I will be glad 👩💻

#BTC reaches the buying zone📊#BTC reaches the buying zone✔️
👀 We pulled back sharply after being rejected at the resistance zone as expected and have now stopped falling near the buy zone.
🧠From a structural point of view, the bullish cup-and-handle structure has not been destroyed, so the expectation of rising prices still exists, and it is impossible to chase the decline in the buying zone.
➡️From the perspective of wave theory, before wave 4 is broken, the upward trend is intact, and wave 5 is still worth looking forward to.
⚠️Note, if we continue to fall after rebounding, we need to be wary of entering the complex consolidation stage at the weekly level again.
☕️In addition, after experiencing a sharp decline, it is also a weekend, so the trading volume should not be too large, and the situation reflected in the chart should not change much. So have a good rest over the weekend. ☕️
⚠️Don’t forget risk management💯
✔️Trade safe✔️
🤜If you like my analysis, please like 💖and share it
👋follow me. Learn about further structural evolution💕
BINANCE:BTCUSDT.P

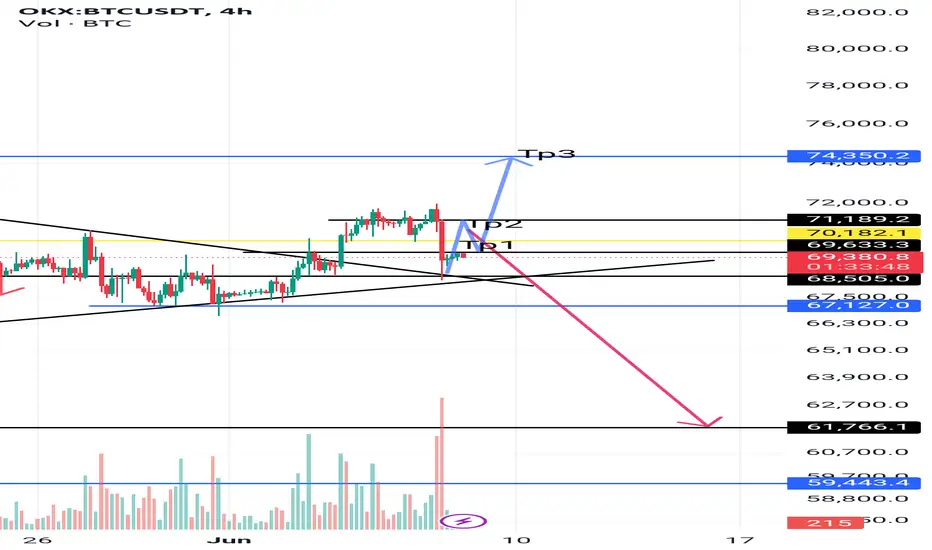
BTC - A quick trade on bounce back!BINANCE:BTCUSDT (4H CHART) Technical Analysis Update
BTC is currently trading at $69595 and price recently had a sudden crash. currently the price is around the support zone and we are expecting a sudden bounce back from this support line. There is a strong resistance line around 71K-72K range and we will exit the trade at this range. We will have a new long trade once price breaks this range.
Entry level: $ 69575
Stop Loss Level: $ 68245
TakeProfit 1: $ 70790.25
TakeProfit 2: $ 71677.07
Max Leverage: 5x
Position Size: 1% of capital
Don't forget to keep stop loss.
Follow Our TradingView Account for More Technical Analysis Updates, | Like, Share and Comment Your thoughts.
Cheers
GreenCrypto

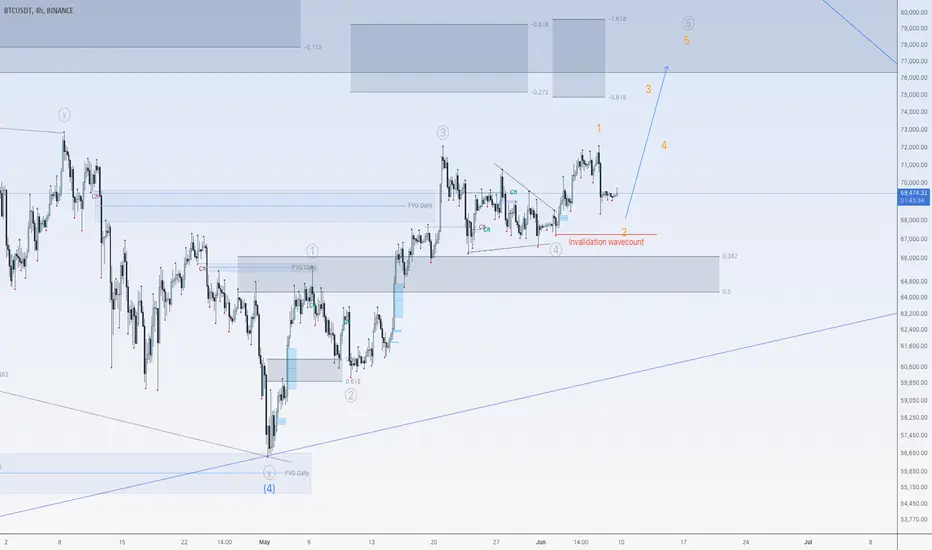
Decision point for BitcoinHi traders,
Last week Bitcoin finished the triangle (wave 4). After that it went up just like I've said in the outlook.
But after NFP it dropped.
So now we could see another downmove to finish the correction and after that a rise for wave 3 (orange).
But if the downmove goes under the red trendline, the wavecount is invalidated and wave 4 (grey) could be bigger or that would be the start of a very big correction down to 64K.
So let's see what the market does and react.
Trade idea: Trade longs after a change in orderflow to bullish if price stays above the red trendline.
If you want to learn more about my analysis, please make sure to follow me, give a like and respectful comment.
This shared post is only my point of view on what could be the next move in this pair based on my analysis. I do not provide signals.
Don't be emotional, just trade!
Eduwave
BTC - Daily TR phaseIn the daily timeframe, Bitcoin is navigating within a defined trading range, characterized by a descending channel with a gentle slope. This pattern suggests a period of consolidation following the substantial bullish momentum observed earlier in the year. The channel's boundaries are formed by resistance around the $73,000 level and support near $60,000. The gradual decline of the channel reflects a controlled correction rather than a sharp drop, which can often indicate a healthier retracement phase within a larger bullish trend.
Observing recent price action, Bitcoin has encountered resistance twice within this descending channel, failing to break through the $72,000 zone. Each attempt has resulted in a pullback, highlighting the strength of the resistance level. The current price action suggests a possible decline towards the support zone at the lower boundary of the channel. Despite these pullbacks, there is a possibility that Bitcoin may find support above the lower end of the channel, potentially around $60,000 to $62,000. This would reflect buyers stepping in at higher levels, indicating underlying bullish sentiment even within the corrective phase.
The behavior within this channel is critical for anticipating the next move. If Bitcoin finds support higher than the channel's bottom, it could set up for a bullish breakout in the future, targeting a move back towards and potentially above the resistance zone. Conversely, a failure to hold these higher support levels might lead to a test of the channel's lower boundary, necessitating a closer watch on the $60,000 support area for potential buying opportunities. Overall, the descending channel should be monitored for signs of consolidation, accumulation, and possible reversal, which could provide clues to the next major move for Bitcoin.

BTC ICT Consept 📈💰 Welcome to your very own channel!
Here, we embark on a collaborative journey to analyze and scrutinize financial markets, aiming to achieve substantial profits together.
Today, let's dive into the exciting world of cryptocurrency and focus on two critical factors: BTCUSDT and BTC.D .
🚀📊 Join us as we explore the dynamics of these key indicators and unlock the potential of the crypto market!
📉🔍 What Happened After NFP News and Why We Dumped :
Before the NFP news, we captured Buy Side liquidity at 71,758 and moved lower towards some Sell Side liquidity, an order block, and OTE levels. Now, we are looking for a retracement back to the 1H FVG that was created.
📊📉 Bitcoin Dominance and Market Dynamics
As observed in the Bitcoin dominance (BTC.D) chart, the current scenario is leaning towards a bearish direction. We managed to capture the buy side liquidity, leading to a strong reaction at the 4-hour Fair Value Gap and ultimately reaching back to the OTE levels.
🌟📈This scenario provides insight into the potential presence of bearish movement in Bitcoin dominance, alongside a bullish trend in Bitcoin itself.
In this situation, we can explore altcoins that exhibit bullish behavior in the Bitcoin pair and consider opening long positions.
🚀📈 Thank You and Stay Tuned
Thank you for joining us on this insightful journey into the world of cryptocurrency! Understanding the dynamics of BTCUSDT and BTC.D can significantly enhance your trading strategy. Stay tuned for more market analysis and updates. Until next time, happy trading!
📊⚠️ Disclaimer:
The information provided here is for educational purposes only and should not be taken as financial advice. Always conduct your own research and consult a licensed financial advisor before making any investment decisions. Trading cryptocurrencies involves significant risk and may not be suitable for all investors.

BITCOIN may reach $100,000 before the US election. In the financial world, Bitcoin is garnering attention with the hypothesis that it could hit the $100,000 mark before the US Presidential election.
Recent trends in Bitcoin have seen significant growth, as predicted yesterday, BTCUSDT continues to rise, currently forming a cup and handle pattern with support around the $67,000 area.
With the increasing involvement of large investors and the continued recognition from major financial institutions, Bitcoin has the potential to continue its upward trajectory in the near future.
If this upward momentum persists, the possibility of it reaching $100,000 before the election may no longer be a distant dream.
Do you have any other insights into the future trend of BTCUSDT? Please share with me!

Bitcoin can start fall to support level, breaking support lineHello traders, I want share with you my opinion about Bitcoin. Looking at the chart, we can see how the price fell to the support line, some time traded near, and later made a strong impulse up to the 66500 level, which coincided with the support area and soon broke this level. After this, the price made little movement down, after which repeated impulse up to the resistance level coinciding with the seller zone. But at once BTC turned around and made a correction to the support area, and also the price started to trades in the range. In range, the price rebounded from the support area and tried to move up, but failed and fell back. After this movement, BTC started to grow, and in a short time rose to a 71500 resistance level, some time traded near and then bounced down. But a not long time ago it turned around and started to grow again. So, at the moment, I think that price can make little movement up to 70k points, after which turns around and starts to decline to the support level. breaking support line inside a range. For this case, I set my target at the 66500 level. Please share this idea with your friends and click Boost 🚀

BTCUSDT to 81K ?!Hi everyone ...
as you see the channel , mid of channel is a resistance and its 81K , if BTC closed top of that by monthly candle , then ... ( BOOM )
please trade on your own risk

Opened BTC UP position at 69100 price with 10x leverageHi everyone,
Opened BTC UP position at 69100 price with 10x leverage on Fybit trading platform.
Target at 72000, Stop loss at 65900.
Position was opened on 4-hour timeframe.
After rising to 72k Bitcoin price declined below 67k and after some consolidation started to rise again.
On 4-hour timeframe on the chart higher lows formed which is signaling about continuation of uptrend.
I put stop loss just under 66k where price shouldn't go if it wants to continue its rise.
Please, do not forget to boost this idea & share it with your friends; thanks.

BTC - ARE YOU READY TO GO BACK TO TITANIC IN 2023?BTC- Are you ready to go back to Titanic in 2023?
Ehsan.F

Bitcoin long from 68500$Nice retest , i think june is going to be bullish for btc.
Waiting for 75k region soon.

Bitcoin's LAST Hurdle: Short-Squeezing To New Highs!Bitcoin has shown that it's ready for a new all-time high by printing relatively big green candles over the last 3 days. However, the 73k-74k area remains an area of big resistance. Previous buyers are looking for an exit, whilst patient bears wait for the perfect short.
My best guess is that Bitcoin is going to trade around the purple area for a couple of days, flushing out over-leveraged bulls and bears. However, the break out that will follow will likely be violent.
With all the short-stops lying above the current all-time high, it's more than likely that the new all-time high break out will take us multiple percentages above the current ATH. I'm personally aiming at 80k within the first 1-2 days, potentially even 90k in the first week after the break out.
Be patient and dont trade small fake-outs.

