Smart for Life Inc: Is This the Next Big Pharma Stock?Smart for Life Inc. (SMFL) has recently exhibited significant volatility, garnering attention in the trading community. This analysis delves into the recent price action, technical indicators, and patterns to provide a speculative outlook on SMFL's potential price movements.
1. Price Action and Volume:
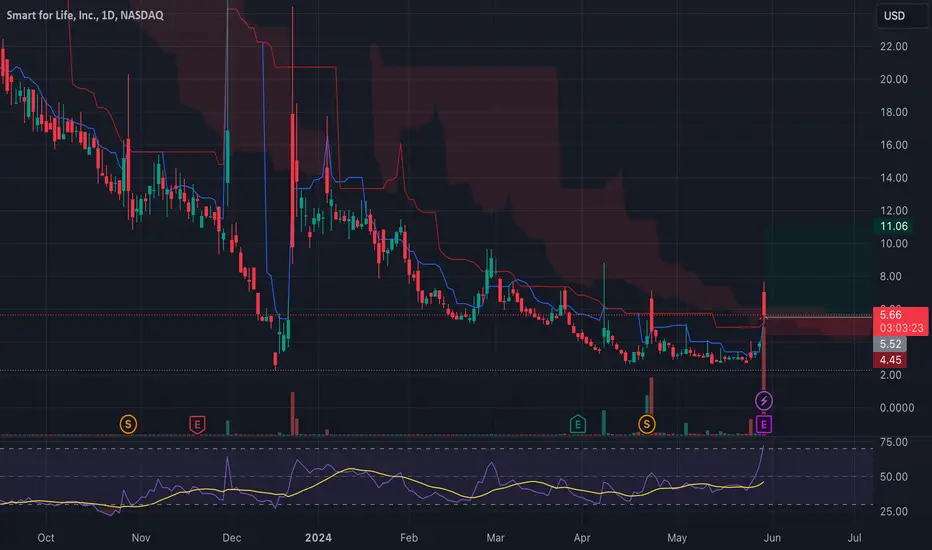
Over the past week, SMFL has experienced a remarkable surge, almost doubling its price in a single trading session. The current price of $5.57 represents a 42.46% increase, indicating strong bullish momentum. The volume for today stands at 28.90M, significantly higher than the average volume of 2.55M over the last 30 days. This surge in volume suggests increased investor interest and potential for continued volatility.
The latest candlestick shows a substantial bullish engulfing pattern, which often signals a continuation of the uptrend. This pattern, coupled with the high volume, indicates strong buying pressure. The previous days' candles also support this upward momentum, with multiple green candles forming higher highs and higher lows.
Short-term MAs: The Exponential Moving Average (EMA) for 10 and 20 days stands at 3.66 and 3.49, respectively, both indicating a 'Buy' signal. The Simple Moving Average (SMA) for 10 and 20 days at 3.38 and 3.26 also supports the bullish sentiment.
Long-term MAs: The EMA and SMA for 200 days at 83.14 and 10.87 are signaling a 'Sell', indicating that while the short-term momentum is bullish, the stock is still in a long-term downtrend.
Relative Strength Index (RSI): The RSI is at 71.73, approaching the overbought territory. This suggests caution as the stock might face selling pressure soon.
Stochastic Oscillator: At 63.56, it is in the neutral zone, but trending upwards, indicating potential for more gains.
MACD: The MACD level of 0.05 is in 'Buy' territory, reinforcing the bullish outlook.
5. Ichimoku Cloud:
The price has broken above the Ichimoku Cloud, signaling a strong bullish trend. The Leading Span A is above Leading Span B, further confirming the uptrend.
Support Levels: The Fibonacci S1 is at 2.52, and the classic S1 at 0.93, providing strong support zones if the price pulls back.
Resistance Levels: The Fibonacci R1 is at 7.23, and the classic R1 at 7.09. These levels can act as potential targets in the short term.
Price Prediction and Strategy
Entry: Enter a long position at the current price of $5.57, capitalizing on the bullish momentum.
Target: The short-term price target is $7.23, based on Fibonacci R1. If the bullish trend continues, a more ambitious target of $11.03 (Fibonacci R2) can be considered.
Stop Loss: Set a stop loss at $4.50, slightly below the recent support level to minimize potential losses.
Entry: Consider a short position if the price falls below $5.00, indicating a reversal.
Target: The short-term target for the short position would be $3.50, near the EMA20 level.
Stop Loss: Place a stop loss at $6.00 to limit potential upside risk.
Smart for Life Inc. presents an intriguing opportunity with its recent price action and technical indicators suggesting further upside potential. However, traders should remain cautious due to the high RSI and potential for pullbacks. A balanced approach with defined entry and exit points, along with stop-loss strategies, will be crucial in navigating the volatility of SMFL.