USD/CAD: Strong Buy with Key Support Above Pivot PointsHello Everyone,
USD/CAD is currently a strong buy, but it's essential for the price to remain above the 1-month/1-week pivot point to see further upside potential.
TradeWithTheTrend3344
USDCAD trade ideas

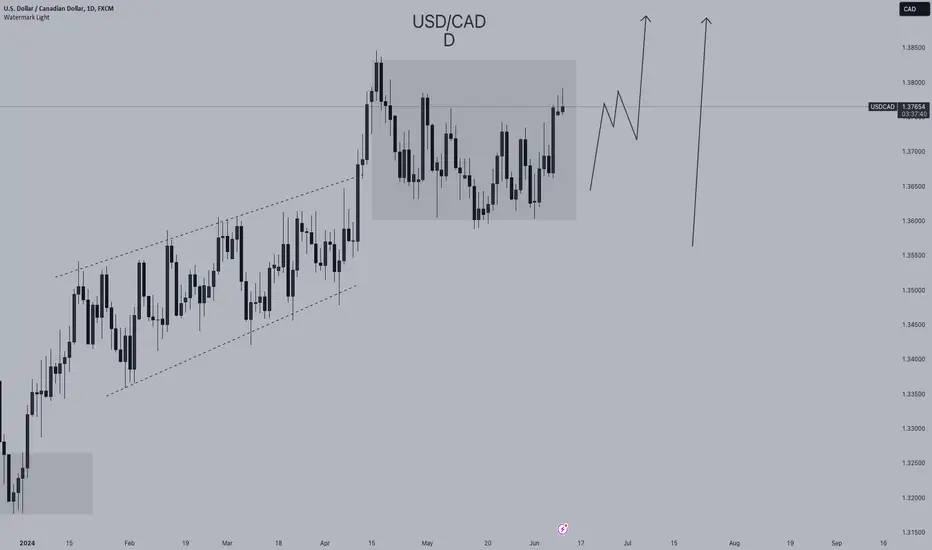
USD/CAD - Congestion over congestion.. After still consolidation, we have a breakout and..
again another congestion!!
Remember when you have a good liquidity, the opportunity is near.
Keep it Simple!
it you like it, don´t forget to follow me! :)
USDCADTraders are observing a symmetrical triangle price pattern, with a risk of a breakout to the upside. The recent Non-Farm Payrolls (NFP) data has been positive, which could contribute to a bullish wave
Key support and resistance levels have been identified, which can play a crucial role in determining the pair's movement. Current pivot points are set at 1.3752 (P), with resistance levels at 1.37552 (R1), 1.376 (R2), and 1.3768 (R3), and support levels at 1.3736 (S3), 1.3744 (S2), and 1.37472 (S1)


USD/CAD Correction before next upward rally(6/8/2024)USD/CAD FX:USDCAD has been trapped into a curve, we can see few back and forth movements since last month. Since the NFP data was quite good, we believe the price will move another wave upward after some corrections.
If you like it then Support us by Like, Following, and Sharing.
Thanks For Reading
Team Fortuna
-RC
(Disclaimer: Published ideas and other Contents on this page are for educational purposes and do not include a financial recommendation. Trading is Risky, so before any action do your research.)


#USDCAD: 550+ Pips Buying Opportunity! Do not miss out! FX:USDCAD
Price has started rebound from the area that we had previously had anticipated. However, we will now wait for price to breakthrough the inducement. The news on Thursday and NFP on Friday will be crucial for future of the pair.
**If you like our ideas, then please like, comment and follow us which will encourage to bring more educational ideas like this**
Team Setupsfx_

USDCAD Uptrend Line Breakout At 1.37654. 11.06.2024USDCAD uptrend line breakout to the downside at 1.37654.
If breakout holds:
Target 1: 1.37558.
Target 2: 1.37350 if 1.37558 is broken.
If breakout fails:
Target 1: 1.37823.
Target 2: 1.38160 if 1.37823 is broken.
Apply Risk Management
Risk Warning: Trading in CFDs is highly speculative and carries a high level of risk. It is possible to lose all of your invested capital. These products may not be suitable for everyone, and you should ensure that you fully understand the risks taking into consideration your investment objectives, level of experience, personal circumstances as well as personal resources. Speculate only with funds that you can afford to lose. Seek independent advice if necessary. Please refer to our Risk Disclosure.
BDSwiss is a trading name of BDS Markets and BDS Ltd.
BDS Markets is a company incorporated under the laws of the Republic of Mauritius and is authorized and regulated by the Financial Services Commission of Mauritius ( FSC ) under license number C116016172, address: 6th Floor, Tower 1, Nexteracom Building 72201 Ebene.
BDS Ltd is authorized and regulated by the Financial Services Authority Seychelles (FSA) under license number SD047, address: Suite 3, Global Village, Jivan’s Complex, Mont Fleuri, Mahe, Seychelles. Payment transactions are managed by BDS Markets (Registration number: 143350)
Disclaimer

USDCAD ( LONG )USDCAD
Tendency the price is under bullish pressure 1.37293
Turning level : The turning level at 1.37293, so as long as the price stable below this level, there will be a bearish trend
resistance level : trade the turning level 1.37293, the price will rise to 1.37965 as long as the price stabilize this level , there will be reach 1.38387
support level : The trading stabilizing below 1.37293 , the price will reach the support level of 1.36692, and under this level it will be reach 1.36256
corrective level : price will attempt 1.37293 , correct itself before long

Elliott Wave Analysis: Anticipating an Upward move in USDCADHello Traders,
Trust you are great.
Below is my Elliott wave analysis of USDCAD currency pair
Analysis:
The structure of the USDCAD currency pair suggests the formation of an irregular Flat corrective pattern. The initial Wave A has taken the form of a leading diagonal, moving downward.
Current State:
Wave B appears to have completed its formation. The next expected movement is the formation of Wave C.
Expectation:
An impulsive Wave C is anticipated to move upward towards the 1.37445 - 1.38147 region before a subsequent decline.
Invalidation level for the upside projection: 1.3605.
Cheers!

USDCAD Expected move Head and shoulders on USDCAD... we are expecting price to drop today and we are looking for selling opportunities

USDCAD H4 LONG TERM Selling TRADE IDEAHello Traders
In This Chart Usdcad HOURLY Forex Forecast By FOREX PLANET
today USDCAD analysis 👆
🟢This Chart includes_ (USDCAD market update)
🟢What is The Next Opportunity on USDCAD Market
🟢how to Enter to the Valid Entry With Assurance Profit
This CHART is For Trader's that Want to Improve Their Technical Analysis Skills and Their Trading By Understanding How To Analyze The Market Using Multiple Timeframes and Understanding The Bigger Picture on the Channel

USDCAD - SELL
US Unemployment Smashed up
Return to Previous LEvel
CAD Strong
Oil has been Strong
Why price even went up apart from to collect Stops i do not know
Has Hit Resistence
Is Over Extended
Indices will Roll Over on 5 min CCPV Indicator
Tartget Order Block Below
All USD Pairs same scenario
imho

USDCAD - SELL
CAD Interest Rate Decision
Dropped by 0.25 %
Pushed up then had the BOC Conference Blah Blah talk
Then pushed back down Sharp
Target Order Block 20 pips

USD-CAD Strong Resistance Ahead! Sell!
Hello,Traders!
USD-CAD is going up
But will soon hit a
Horizontal resistance
Of 1.3782 from where
We will be expecting
A local bearish pullback
Sell!
Like, comment and subscribe to help us grow!
Check out other forecasts below too!

USDCAD 1HI see a tendency to rise in this chart, but it should reach lower prices and then I will buy

USDCAD LONG Buying IdeaHello Traders
In This Chart Usdcad HOURLY Forex Forecast By FOREX PLANET
today USDCAD analysis 👆
🟢This Chart includes_ (USDCAD market update)
🟢What is The Next Opportunity on USDCAD Market
🟢how to Enter to the Valid Entry With Assurance Profit
This CHART is For Trader's that Want to Improve Their Technical Analysis Skills and Their Trading By Understanding How To Analyze The Market Using Multiple Timeframes and Understanding The Bigger Picture on the Channel

USDCAD is Heading Upwards After Testing major Support LevelHello Traders
In This Chart Usdcad HOURLY Forex Forecast By FOREX PLANET
today USDCAD analysis 👆
🟢This Chart includes_ (USDCAD market update)
🟢What is The Next Opportunity on USDCAD Market
🟢how to Enter to the Valid Entry With Assurance Profit
This CHART is For Trader's that Want to Improve Their Technical Analysis Skills and Their Trading By Understanding How To Analyze The Market Using Multiple Timeframes and Understanding The Bigger Picture on the Channel

USD/CAD: Capitalizing on Soft CPI and Dovish Fed ExpectationsHello Traders,
In today's trading session, we are closely monitoring USD/CAD for a potential selling opportunity around the 1.37200 zone. Recently, USD/CAD was trading in an uptrend but successfully broke out of this trend. Currently, it is in a correction phase and is approaching the key retrace area at the 1.37200 support and resistance zone. This level is crucial as it has historically served as a significant pivot point for price action.
From a fundamental perspective, today's CPI data came in softer than expected, with a year-over-year increase of 3.3%, compared to the anticipated 3.4%. This lower-than-expected inflation reading suggests that inflationary pressures are not as strong as the market had anticipated.
The softer CPI data has important implications for the Federal Reserve's policy stance. A lower inflation rate reduces the urgency for the Fed to tighten monetary policy aggressively. As a result, the likelihood of the Fed adopting a more dovish stance increases, which could involve maintaining or even easing current monetary policies. This dovish outlook would likely weaken the US dollar, creating a favorable environment for USD/CAD shorts.
Additionally, this evening we have the FOMC meeting, where further insights into the Fed's monetary policy direction will be provided. The combination of today's soft CPI data and the FOMC's potential dovish tone strengthens the case for a bearish outlook on the US dollar.
Given these fundamental factors, the 1.37200 zone becomes an attractive area to look for short positions in USD/CAD. A weaker dollar, driven by dovish Fed expectations, should support further downside for USD/CAD, making this level a strategic entry point for selling opportunities.
Trade safely,
Joe

USDCADThis pair looks to be lining up nicely for a bullish move off of that zone. All timeframes in bullish sync and also right at that institutional level of 1.37500. Once price comes down I'm expecting price to hold support and then a few other confluences and then I will be going long. If price doesn't do these things I won't take a trade.

USDCAD - Awaiting Breakout Amid Key Economic Data ReleasesThe USDCAD pair is currently forming a wedge-type pattern, indicating a period of consolidation that typically precedes a significant price movement. The forthcoming Non-Farm Payrolls (NFP) and Consumer Price Index (CPI) data releases will be critical in determining the direction of the breakout.
---------------------Key Levels:--------------------------------
Strong Support: 1.36000
Medium Resistance: 1.37500
Strong Resistance: 1.38500
Current Market Sentiment:
At this juncture, we maintain a neutral bias on USDCAD, given the potential for either bullish or bearish developments contingent on upcoming economic data.
________________Technical Indicators:__________________
Support and Resistance Analysis: The pair is testing critical support at 1.36000. A break below this level could signal a bearish trend, targeting lower levels as the market reassesses USD strength.
Wedge Pattern Formation: The wedge pattern suggests an imminent breakout, though the direction remains uncertain pending economic data.
Volume Analysis: Observing volume spikes during the breakout will be essential to confirm the direction of the trend.
_____________________Potential Scenarios__________________
Bullish Scenario:
Trigger: A breakout above the medium resistance at 1.37500.
Implication: If USDCAD breaks and sustains above 1.37500, it could pave the way for a continuation towards the strong resistance at 1.38500.
Target: 1.38500 and potentially higher if bullish momentum persists.
Action: Monitor for buy signals upon confirmation of the breakout with increased volume.
Bearish Scenario:
Trigger: A breakdown below the strong support at 1.36000.
Implication: A decisive move below 1.36000 would likely initiate a bearish trend, with the potential for accelerated selling pressure.
Target: Lower levels, possibly revisiting the next significant support zones around 1.35000 and 1.34000.
Action: Consider sell signals if the price breaks below 1.36000, ensuring confirmation through sustained lower price action and volume.
Conclusion:
USDCAD is poised at a critical juncture within a wedge-type pattern. The upcoming NFP and CPI data releases are expected to provide the necessary catalyst for a breakout. Traders should remain vigilant and ready to react to a confirmed breakout above 1.37500 for a bullish trend or below 1.36000 for a bearish trend.
Recommendation: Maintain a neutral stance until the price action dictates a clear direction. Utilize stop-loss orders to manage risk effectively and be prepared to adjust positions based on the market response to the upcoming economic data.
Disclaimer: This report is based on current market conditions and is intended for informational purposes only. It does not constitute financial advice. Always conduct your own research or consult with a professional before making trading decisions.

Big buy incoming for USDCADLooking at the weekly TF down to the daily TF..USDCAD looks bullish and the bulls are looking to clear some liquidity at the upside ...
So I expected a sell down to the 1.3600 region , before the bulls begin the journey to clear the liquidity parked up above all the way to 1.3900 and probably touch 1.400

USDCAD Trading IdeaBased on Simple Technical Analysis ( Trendline + Support & Resistance )
Risk Disclaimer:
Please be advised that I am not telling anyone how to spend or invest their money. Take all of my analysis as my own opinion, as entertainment, and at your own risk. I assume no responsibility or liability for any errors or omissions in the content of this page, and they are for educational purposes only. Any action you take on the information in these analysis is strictly at your own risk. There is a very high degree of risk involved in trading. Past results are not indicative of future returns. Good luck :-)
