Solution to a WEEKLY PUZZLE :)I appreciate your interest, please comment and support the puzzle section so I continue to post them in the future.
USDJPY trade ideas

Bullish bounce?USD/JPY is falling towards the pivot and which acts as a pullback support and could bounce to the 1st resistance.
Pivot: 154.78
1st Support: 153.671
1st Resistance: 156.58
Risk Warning:
Trading Forex and CFDs carries a high level of risk to your capital and you should only trade with money you can afford to lose. Trading Forex and CFDs may not be suitable for all investors, so please ensure that you fully understand the risks involved and seek independent advice if necessary.
Disclaimer:
The above opinions given constitute general market commentary, and do not constitute the opinion or advice of IC Markets or any form of personal or investment advice.
Any opinions, news, research, analyses, prices, other information, or links to third-party sites contained on this website are provided on an "as-is" basis, are intended only to be informative, is not an advice nor a recommendation, nor research, or a record of our trading prices, or an offer of, or solicitation for a transaction in any financial instrument and thus should not be treated as such. The information provided does not involve any specific investment objectives, financial situation and needs of any specific person who may receive it. Please be aware, that past performance is not a reliable indicator of future performance and/or results. Past Performance or Forward-looking scenarios based upon the reasonable beliefs of the third-party provider are not a guarantee of future performance. Actual results may differ materially from those anticipated in forward-looking or past performance statements. IC Markets makes no representation or warranty and assumes no liability as to the accuracy or completeness of the information provided, nor any loss arising from any investment based on a recommendation, forecast or any information supplied by any third-party.

USD/JPY Giving Amazing Bearish P.A , Short Setup Valid Soon !This Is An Educational + Analytic Content That Will Teach Why And How To Enter A Trade
Make Sure You Watch The Price Action Closely In Each Analysis As This Is A Very Important Part Of Our Method
Disclaimer : This Analysis Can Change At Anytime Without Notice And It Is Only For The Purpose Of Assisting Traders To Make Independent Investments Decisions.

USDJPY Short (Sell Limit)Enty : 156.616
TP : 154.130 (1870 pts)
SL : 157.330 (750 pts)
TF : 4H
RR : 1 : 3.48
Expire : June, 12nd 2024 (20:00 GMT+7)
Warning : This analysis is not trading advice. Always do your own research and manage your financial risk

USDJPY OUTLOOK MARKET HAS BULLISHUSDJPY Update⚠️ Alert
🔍It seems like USDJPY is the move dancing with in channel recently busting out of a download trend! 🚀📈 As it nears the resistance zone the anticipation is palpable for a correction ⭐ but there the interesting part once this correction happens there a chance it might hit the midline of the channel
🎯⭐ That's like the rebound zone to the channel
Trendline.📈 And whi knows? This Rebound could just sky - rocket up to touch the ceiling of the the channel So fellow treads what do think?
Dont forget give it it a thumbs up drop a comment and spread the world

USD/JPY Bearish OutlookHi Traders!
1. HTF Ascending Channel
2. Bearish Impulse
3. STF Ascending Channel
4. STF Bearish Impulse/ HeadnShoulder Pattern
5. Break out from ascending chanel and bearish continuation.
USD Pairs looks all quite bearish. What do you think?

USDJPY SHORTThis pair may rise to the order block on the chart. The price has a higher chance that will sweep liquidity above then reverse the movement on the order block. This is just my analysis.
Join me on my new channel for updates!
TYOR!

NEW IDEA FOR USDJPY The absence of currency intervention will change the divergence of monetary policy towards the US dollar
By examining the trend in the four-hour time frame, USD/YEN, while maintaining the important support interval in the range of 154.79-154.09, can increase to the resistance range of the ceiling of the ascending channel in the range of 161.30-160.21.

USDJPY: Swing Sell Happening! AB=CD PatternFX:USDJPY
Price is currently in process of making AB=CD pattern; after USDJPY created a record Higher High, most of the traders were expecting price to drop heavy and it just did that. After dropping heavily, price made some correction and formed a AB=CD pattern which is where we can expect price to drop exactly in same amount as A to B made. Our final target is 145-147 which will be somewhere 800-1000 pips. Use proper risk management.

Potential bearish reversal?USD/JPY is rising towards the pivot and could reverse to 1st support which acts as a pullback support.
Pivot: 155.96
1st Support: 153.60
1st Resistance: 157.69
Risk Warning:
Trading Forex and CFDs carries a high level of risk to your capital and you should only trade with money you can afford to lose. Trading Forex and CFDs may not be suitable for all investors, so please ensure that you fully understand the risks involved and seek independent advice if necessary.
Disclaimer:
The above opinions given constitute general market commentary, and do not constitute the opinion or advice of IC Markets or any form of personal or investment advice.
Any opinions, news, research, analyses, prices, other information, or links to third-party sites contained on this website are provided on an "as-is" basis, are intended only to be informative, is not an advice nor a recommendation, nor research, or a record of our trading prices, or an offer of, or solicitation for a transaction in any financial instrument and thus should not be treated as such. The information provided does not involve any specific investment objectives, financial situation and needs of any specific person who may receive it. Please be aware, that past performance is not a reliable indicator of future performance and/or results. Past Performance or Forward-looking scenarios based upon the reasonable beliefs of the third-party provider are not a guarantee of future performance. Actual results may differ materially from those anticipated in forward-looking or past performance statements. IC Markets makes no representation or warranty and assumes no liability as to the accuracy or completeness of the information provided, nor any loss arising from any investment based on a recommendation, forecast or any information supplied by any third-party.

USD/JPY Loses Ground Despite Strong Economic Data but..The Japanese Yen continued to weaken on Thursday, even as economic data showed a positive trend. The Tokyo Consumer Price Index (CPI) increased to 2.2% year-over-year in May, up from April's 1.8%, which marked a 26-month low. In addition, Japan’s Retail Sales (YoY) grew 2.4% in April, accelerating from a downwardly revised 1.1% rise in March and surpassing market forecasts of 1.9% growth. This marks the 26th consecutive month of expansion, indicating a sustained period of healthy consumption in Japan.
Monetary Policy Implications
The Bank of Japan (BoJ) has maintained its deeply entrenched monetary policy stance. Should nationwide inflation in Japan decline, it would prevent the central bank from raising interest rates. The significant rate differential between Japan and other countries continues to exert pressure on the Japanese Yen, underpinning the USD/JPY pair.
US Dollar Rebound
The US Dollar (USD) rebounded ahead of the Federal Reserve's preferred inflation gauge, the Core Personal Consumption Expenditures (PCE) Price Index, which is due to be released today. However, the decline in US Treasury yields could limit the advance of the US Dollar.
Technical Analysis
From a technical perspective, we are anticipating a rebound for the Yen, particularly if the US Core PCE Price Index shows a negative impact. The footprint analysis reveals several areas of demand on the daily timeframe chart, where the value could find support for a possible reversal.
Investors should monitor the upcoming Core PCE data closely, as it will likely influence the near-term direction of both the USD and JPY.

USDJPY (Elliott Wave)Hello friends
In the USDJPY currency pair, we see a completed 5 wave.
We call it wave A or 1.
An ascending channel that has modified these 5 waves has been formed and we call it wave 2 or b.
Now, in both cases, whether we consider 5 wave impulse or corrective zigzag, in both theories we need another wave in the dominant wave 3 or C to complete the pattern.
Now, with this information, a SELL trade can be planned.
Because the trend line at the bottom of the channel has been broken and a pullback has been added to it, and the wave counter confirms it, you can enter the sell trade with a stop loss around 158 and a take profit around 152.


Could USD/JPY bounce from here?Price is falling towards a support level which is a pullback support that lines up with the 61.8% Fibonacci projection and could bounce from this level to our take profit.
Entry: 154.76
Why we like it:
There is a pullback support which lines up with the 61.8% Fibonacci projection.
Stop loss: 153.66
Why we like it:
There is a pullback support level which aligns with the 100% Fibonacci projection.
Take profit: 156.38
Why we like it:
There is an overlap resistance level.
Please be advised that the information presented on TradingView is provided to Vantage (‘Vantage Global Limited’, ‘we’) by a third-party provider (‘Everest Fortune Group’). Please be reminded that you are solely responsible for the trading decisions on your account. There is a very high degree of risk involved in trading. Any information and/or content is intended entirely for research, educational and informational purposes only and does not constitute investment or consultation advice or investment strategy. The information is not tailored to the investment needs of any specific person and therefore does not involve a consideration of any of the investment objectives, financial situation or needs of any viewer that may receive it. Kindly also note that past performance is not a reliable indicator of future results. Actual results may differ materially from those anticipated in forward-looking or past performance statements. We assume no liability as to the accuracy or completeness of any of the information and/or content provided herein and the Company cannot be held responsible for any omission, mistake nor for any loss or damage including without limitation to any loss of profit which may arise from reliance on any information supplied by Everest Fortune Group.

USDJPYBUY on the theory markets ranges 70% of the time, and BUY on the theory markets retraces HALF of the previous leg 90% of the time.

USDJPY (Bearish trend )USDJPY technical analyse
The price has a bearish pressure because can be stabilized under the strong barrier which is 155.445, so the bearish station is 154.700 and 154.260, and the next bearish station will be activated by breaking the support zone means under 154.260 to get 152.850
Pivot line: 155.400
Resistance line: 155.950, 156.590, 157.970
Support line: 154.260, 152.850, 150.770
The expected trading range is between support 152.850 and Resistance 155.500

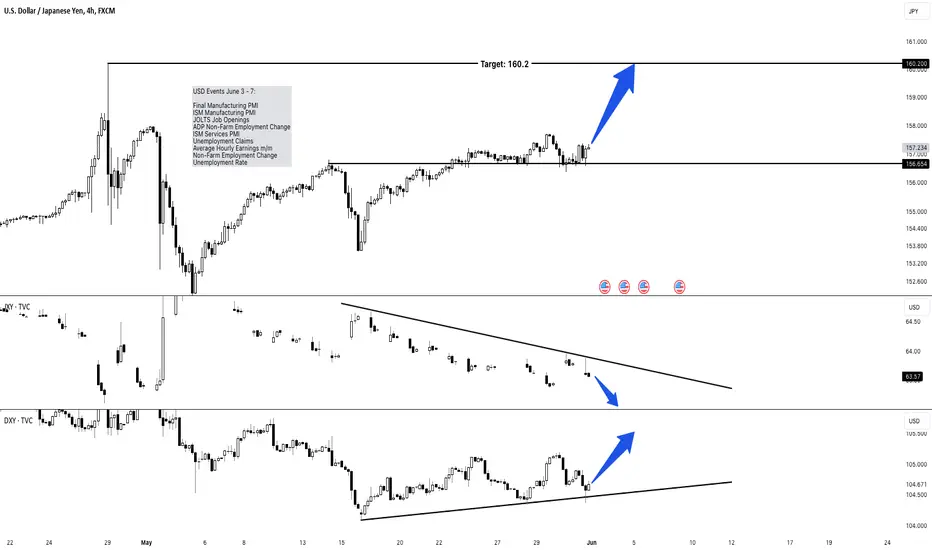
USD continues to dominate - USDJPY LongsJPY Fundamentals (IMPORTANT):
The Bank of Japan has spent a record 9.79 trillion yen ($62.23 billion) over the past month to support the country's declining currency. Despite this significant intervention, the yen is likely to continue hovering near its critical lows.
“Authorities will likely continue to spend big on intervention.”
The data, released by Japan’s Ministry of Finance on Friday, confirmed the suspicions of traders and analysts that Tokyo entered the market in two rounds of massive dollar-selling intervention shortly after the yen hit a 34-year low of 160.245 per dollar on April 29, and again in the early hours of May 2 in Tokyo.
Japanese authorities have refrained from commenting on whether they forayed into the market. But top officials have consistently warned t hey are watching currency markets closely and stand ready to take all necessary measures to counter excessive volatility .
Source: Asia Financial.
Summary : If USDJPY starts aggressively moving higher, expect a sharp drop in price from the Bank of Japans intervention. This is nothing to worry about as it presents a buying opportunity. Ensure you use effective risk management with this pair!
Upcoming US Economic data:
Final Manufacturing PMI
ISM Manufacturing PMI
JOLTS Job Openings
ADP Non-Farm Employment Change
ISM Services PMI
Unemployment Claims
Average Hourly Earnings m/m
Non-Farm Employment Change
Unemployment Rate
If DXY has a positive reaction to the Dollar, we can expect prices to move higher as the JXY continues to make fresh lows.
Daily USD/JPY Updates Hello Traders! We got another down closed candle. This is a smash Candle by definition from Larry Williams. This can be a turning point and new buying opportunity.


USDJPY OUTLOOK Current technical outlook on USDJPY.
In alignment with the bearish dollar (earlier post) and expected rate cut towards the end of the year.
I expect some sell to the down side on the USDJPY pair.
"May fortune attend thee, and thy trade prosper." .......L2Earned

USDJPYBUY on the theory markets ranges 70% of the time, and BUY on the theory markets retraces HALF of the previous leg 90% of the time. Entry on 5m TF

Heading into 50% Fibonacci resistance?USD/JPY is rising towards a resistance level which is an overlap resistance that aligns with the 50% Fibonacci retracement and could reverse from this level to our take profit.
Entry: 156.60
Why we like it:
There is an overlap resistance level which lines up with the 50% Fibonacci retracement.
Stop loss: 157.44
Why we like it:
There is a pullback resistance level.
Take profit: 155.54
Why we like it:
There is a pullback support level which lines up with the 50% Fibonacci retracement.
Please be advised that the information presented on TradingView is provided to Vantage (‘Vantage Global Limited’, ‘we’) by a third-party provider (‘Everest Fortune Group’). Please be reminded that you are solely responsible for the trading decisions on your account. There is a very high degree of risk involved in trading. Any information and/or content is intended entirely for research, educational and informational purposes only and does not constitute investment or consultation advice or investment strategy. The information is not tailored to the investment needs of any specific person and therefore does not involve a consideration of any of the investment objectives, financial situation or needs of any viewer that may receive it. Kindly also note that past performance is not a reliable indicator of future results. Actual results may differ materially from those anticipated in forward-looking or past performance statements. We assume no liability as to the accuracy or completeness of any of the information and/or content provided herein and the Company cannot be held responsible for any omission, mistake nor for any loss or damage including without limitation to any loss of profit which may arise from reliance on any information supplied by Everest Fortune Group.

USDJPY ( TURNING PLACE )USDJPY
Tendency the price is under bearish pressure between 156.189 and 156.773
Turning level : The turning level between 156.189and 156.773, so as long as the price below this level, there will be a bearish trend
resistance level : Breaking the turning level 156.773, the price will rise to157.360 as long as the price stabilize this level , there will be reach 157.931
support level : The trading stabilizing below1 56.189and 156.773, the price will reach the support level of 154.700 and153.883 , and under this level it will be reach 152.927
corrective level : price will attempt between 156.189and 156.773, correct itself before falling
* Know the price attempt to touch the turning level , correct it is self before falling
