Time To Long Position!In NY session, Price action hint the Sell side and go through the Pool of liquidity.
Then Must back to up!
Crypto market

PYTH BOOMThe information and publications are not meant to be, and do not constitute, financial, investment, trading, or other types of advice or recommendations supplied or endorsed by TradingView. Read more in the Terms of Use.

BTC / Usdt 1H scalpingHello guys. Everything you need shown on the chart. So i think 67000$ will be hold
So becaution

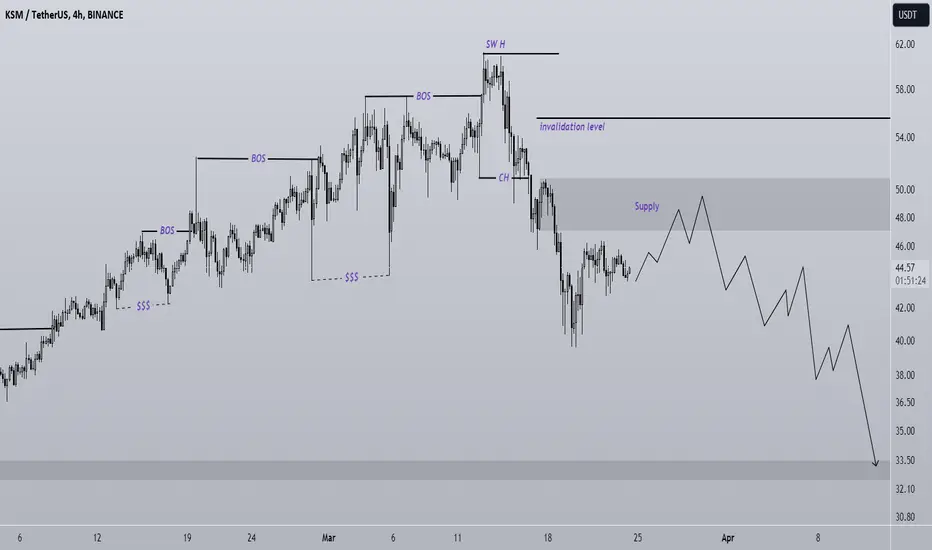
KSM short setupConsidering the bearish CH and the liquidity pools at the bottom of the chart, it seems that KSM intends to move towards the specified demand.
supply is a good place for sell/short positions
By maintaining the supply range, it can drop the demand side.
Closing a daily candle above the invalidation level will violate this analysis
Note that the financial market is risky, so:
Do not enter any position without confirmation and trigger.
Do not enter a position without setting a stop.
Do not enter a position without capital management.
When we reach the first TP, save some profit and try to move the stop continuously in the direction of your profit.
If you have any comments please post them, comments will help us improve our performance
Thanks
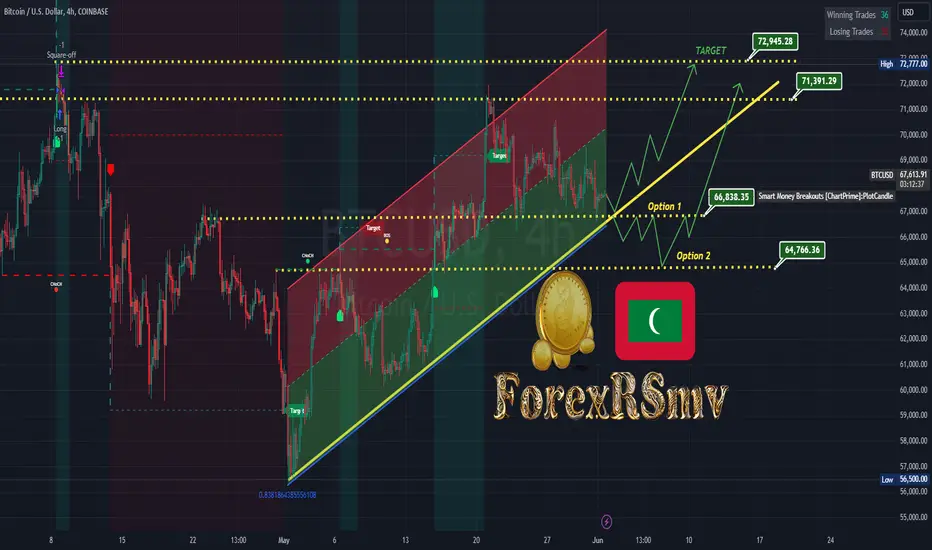
BTCUSD IDEAThe price is still in consolidation.
Now we need to watch for the reaction to the mentioned area :-
(66838-66000-64766 Support ).
If the bulls hold, then the price will head towards the resistance. But, most likely, the market has not yet accumulated the proper potential and the price may go deeper and test the support at 64500 before going up.
But, there is no talk about a crash or a global fall now.
AIDOGE, will be very sensitive to a PARABOLIC move...AIDOGE just broke its daily descending trendline with significant volume -- conveying anticipation of a sudden price growth.
Histogram has created a breakout line -- a 2nd attempt to a breakout scenario, and a warning sign of an incoming UPSIDE price shift if materialized.
Spotted at $0.0000000002000000
TAYOR
Safeguard capital always.

MEW continues to get weaker. Descending triangle on the daily.
Notice how the supply zone (red box) maintained an aggressive resistance.
Previous demand zone later turned into supply zone (purple box) that the price couldn't sustain.
If this breaks the triangle, it may see some bids in the demand zone (green box) of the previous ATL.
Overall, bearish.
Educational purposes only. Not financial advice.


BTC Monthly Close Target at $73k-$75kBased on the current price action, it seems wave 4 is over, bounced on the previous resistance level ($66k-67k) and now beginning to slowly approach the wave 5 target, which is in area of 123.6 – 161.8% wave 4 fib.
If the target area hit, the monthly close would be beautiful.
Disclaimer : this is my first time using Elliott Wave, so NFA.

Near Protocol: Bullish Breakout or Bearish Signal? Near Protocol: Bullish Breakout or Bearish Signal? A Potential 37% Downturn
Near Protocol (NEAR) has been a beacon of relative stability in the volatile cryptocurrency market of 2024. While other altcoins have plunged, NEAR has managed to hold its ground. However, a recent price movement has some analysts sounding the alarm, suggesting a potential 37% crash on the horizon.
Wedge Pattern and the Analyst's Call
In early May, NEAR formed a technical chart pattern known as a "wedge." This pattern is characterized by price fluctuations confined within a narrowing range, with trendlines converging towards a point. While breakouts from wedges can signal either bullish or bearish continuations, the specific characteristics of NEAR's breakout have a crypto analyst predicting a significant downturn.
The analyst argues that the way NEAR broke out of the wedge is a bearish indicator. They believe the price may experience a period of consolidation around its current level ($7.30 as of May 31, 2024) before an "impulsive" downward movement. This movement could initially see the price drop by 8% to $6.78, followed by further declines to $6.00 and a potential bottom around $4.60. If this scenario plays out, NEAR would experience a total decline of 37%.
Metrics Supporting the Downturn Theory
The analyst's prediction finds some support in recent developments surrounding NEAR's market metrics. After a strong start to 2024, NEAR has seen a decline in price over the past month. This price drop coincides with a notable decrease in daily trading volume, suggesting a potential weakening of investor interest.
While NEAR has outperformed many other altcoins, the overall bearish sentiment in the cryptocurrency market could also play a role in its future price movement. A broader market downturn could drag NEAR down even if its project fundamentals remain strong.
Understanding Wedge Patterns and Analyst Predictions
It's important to remember that technical analysis, including wedge patterns, is not an exact science. Past performance is not always indicative of future results. While the analyst's prediction offers a bearish perspective, it's just one voice in a crowded space.
Here are some additional factors to consider:
• Positive News and Developments: News about partnerships, project developments, or upcoming upgrades could trigger renewed investor interest and push the price upwards.
• Market Sentiment Shift: A broader shift in market sentiment towards optimism could buoy NEAR's price regardless of the technical indicators.
• Unforeseen Events: Unexpected events, both positive and negative, can significantly impact the cryptocurrency market.
Investor Takeaway: Research and Diversification
The potential for a 37% decline in NEAR price should be a wake-up call for investors. It underscores the inherent volatility of the cryptocurrency market. Investors should thoroughly research NEAR's project fundamentals, roadmap, and broader market outlook before making any investment decisions.
Diversification is also crucial. Spreading investments across various cryptocurrencies and asset classes can help mitigate risk.
Conclusion
Near Protocol's recent breakout from a wedge pattern has sparked debate among analysts. While some see a potential 37% crash on the horizon, others remain cautiously optimistic. Ultimately, the future price movement of NEAR will depend on a combination of technical factors, project developments, and broader market sentiment. Investors should carefully consider all available information before entering or exiting any NEAR positions.

Supertrend Indicator - Scam or RealThis not a pro long or short idea just a general test of the 15M super trend indicator that I believe more people should look at as a helpful tool to validate or invalidate any ideas

BITCOIN SELLBTCUSD looking continues to sell side trend line breaked another candle fall sell side momentum last one week its struggling in this area it shows no more buyers there ... so need liquidity down side 1:2 RR

Breaking out of Falling Wedge on $WLDWLD/USDT
MIL:WLD is currently breaking out of a Falling Wedge chart pattern. ⚡🔎
If the breakout is successful, it could trigger a Bullish move. 🚀 📈
The potential target for the Bullish move is around the $10. 🪙 💰

WIFUSDT long move with strong supportGood Evening people,
i would like to share this trade idea and am humbly requesting your feedback on it.
i have drown clear support and resistance levels for WIF which is a very popular Solana based Meme coin which so far has left quite a few o the established coin far behind in terms of speed and intensity of price action.
i believe we can expect a minimum 4:1 risk to reward ratio even if it doesn't quickly establish a new ATH.
please dissect my chart and share your views.
This is my own trade plan and not trading or investment advise.

Notcoin(NOT) is Ready for another PUMP===>>+30%+40%Notcoin(NOT) has increased by more than +120% in the last five days. One of the main reasons for this increase is that the Notcoin(NOT) team announced its new AirDrop and new ways for game users to earn money, which led to investors' interest in the token once again. In terms of technical analysis , with the help of the Rounding Bottom Pattern .
According to Elliott's wave theory , Notcoin(NOT) seems to have completed wave 3 and is currently completing wave 4 . If the one-hour candle closes above $0.009136 , we can confirm the end of wave 4 .
I expect Notcoin(NOT) to rise to the Potential Reversal Zone(PRZ) after wave 4 is completed.
Note: An important point you should always remember is capital management and lack of greed.
Notcoin(NOT) Analyze (NOTUSDT), 1-hour time frame ⏰.
Do not forget to put Stop loss for your positions (For every position you want to open).
Please follow your strategy; this is just my Idea, and I will gladly see your ideas in this post.
Please do not forget the ✅' like '✅ button 🙏😊 & Share it with your friends; thanks, and Trade safe.

Cardano (ADA) Elliott WaveHello friends
In digital currency Cardano(ADA) we are witnessing the formation of a 5-wave Elliott pattern.
Waves 1, 2 and 3 have been formed and completed.
Wave 4 is forming.
According to the formed pattern, we are probably facing a triangle, which is very common in wave 4.
Therefore, to complete this pattern, we expect to have a growth up to the range of 05000 in the dominant wave... and then wave 5 will start.
At the moment, you can enter a buy trade and reach 0.4140 with a stop loss, and consider the profit limit at 0.4980.
Then, when the price reaches the range of 0.5000, we can enter the sell trade with a loss limit of 0.5250 and a profit limit of 0.3500.
To support me, I recommend that you install Trading View software on your phone and see my analysis and support me with your comments and Boost.
Be successful and profitable.

Algousdt Buy opportunityAlgousdt is currently exhibiting a potential cup and handle reversal pattern following a significant drop.
This pattern suggests a forthcoming bullish trend for the coin. The designated buyback zone presents an attractive opportunity for purchasing, with expected targets highlighted on the chart.
It is advisable to set the stop loss below the handle area to mitigate risks.
We invite you to share your thoughts and comments on this analysis.
Your input is valued.

Aliceusdt Buy opportunityAliceUSDT is exhibiting a potential inverse head and shoulders pattern, with the price currently forming the right shoulder. This presents a promising buying opportunity. The immediate target is the neckline of the setup, and stop loss should be strategically placed as indicated on the chart. Final target levels are also outlined on the chart. Let's observe how this evolves over time; patience will be essential for this coin.

$NOTUSDT TRENDLINE BREAKOUT Dear Traders,
We are convening a discussion focused on #NOTUSDT
The Trendline Breakout Has Already Done ✅
So,I am Expecting a Bullish Move of 30% 🚀😉
#crypto #cryptocurrency #bitcoin #ethereum #blockchain #btc #cryptotrading #cryptonews #eth #cryptocurrencies #nft #bitcoinnews #bitcoins #trading #bitcoinmining #forex #binance #cryptoart #nfts#trading #forex #trader #investing #stocks #forextrader #stockmarket #daytrader #forextrading #invest #bitcoin #daytrading #cryptocurrency #crypto #investor #investment #forexsignals #nse #chartpattern #cedarforex #candlepatterns #learntrading #bseinstitute #shorttermtrade #bankniftytrading #stockmarketph #calloptions #mqlsignal #futuretrader #tradingmemes #chartpatterns #tradingview #tradinglife #tradinglifestyle #tradingstrategy #tradingtips #tradingplan #tradingsignals #tradingaccounts #tradingsignal #tradingforex #tradingsync #tradingroom #litecoin #ethereum #bitcoincash #cryptocurrencies #ripple #btc #bitcoinnews #bitcoinmining #blockchain #eth #bitcoin #bitcoins #coinbase #cryptocurrency #crypto #bitcointrading #dogecoin CRYPTOCAP:BTC CRYPTOCAP:ETH CRYPTOCAP:USDT CRYPTOCAP:PEPE CRYPTOCAP:DOGE NASDAQ:ALT

Chart Idea - FTMUSDT Swing LongBeautifully retraced to 618 fib level and now it's way to it's TPs. Please see the originally posted chart few weeks back

Could XRP/USD bounce from here?Price is falling towards a support level which is an overlap support that lines up with the 61.8% Fibonacci projection and could bounce from this level to our take profit.
Entry: 0.5058
Why we like it:
There is an overlap support which aligns with the 61.8% Fibonacci projection.
Stop loss: 0.4833
Why we like it:
There is a pullback support level which aligns with the 100% Fibonacci projection.
Take profit: 0.5414
Why we like it:
There is a pullback resistance level
Please be advised that the information presented on TradingView is provided to Vantage (‘Vantage Global Limited’, ‘we’) by a third-party provider (‘Everest Fortune Group’). Please be reminded that you are solely responsible for the trading decisions on your account. There is a very high degree of risk involved in trading. Any information and/or content is intended entirely for research, educational and informational purposes only and does not constitute investment or consultation advice or investment strategy. The information is not tailored to the investment needs of any specific person and therefore does not involve a consideration of any of the investment objectives, financial situation or needs of any viewer that may receive it. Kindly also note that past performance is not a reliable indicator of future results. Actual results may differ materially from those anticipated in forward-looking or past performance statements. We assume no liability as to the accuracy or completeness of any of the information and/or content provided herein and the Company cannot be held responsible for any omission, mistake nor for any loss or damage including without limitation to any loss of profit which may arise from reliance on any information supplied by Everest Fortune Group.

PEPE Vs other memecoins previous ATHDear reader,
Im posting this observation to leave you speculating how much would we will reach with pepe this season. given that, i have put a line where would pepe's price would stand at DOGE and SHIB previous all time highs.
I believe we are still very early and i hope we can see a market cap similar to doge, we are still early.

RR=2.7 Buy ideaprice bounced on support level + bullish butterfly pattern + RSI Divergence ; expecting the price to rise in order to retest the 0.75$ level
PS never risk more than 2% of your capital per trade
