Reasons Behind BTC DumpsJust looking at all the news over the course of the bull market and plotting it, seems like although there's tons of news, nothing is really behind this dump.
BLX trade ideas

Bitcoin compared to Fear and Greed IndexHighlighting the fact that although BTC has dipped, the fear and greed has not retraced.
This suggests market sentiment is still elevated and we can expect further downside.
In all cases leading up to this dump, we saw a correction in the fear and greed index of 20+, currently we sit at a correction of only 16 pts in market sentiment.
My thesis: DOWNSIDE RISK HIGH UNTIL MARKET SENTIMENT RESETS

Trade #15 ShortShort from $68.7 with tight stop above $70k
Interest rates are not getting cut as everybody expected. Now first cut telegraphed earliest in June. Fed is keeping it's powder dry to be able to cut after a crash.

Bitcoin 4 Year Cycle - 2024 UpdateI refit the trend line. projecting out the bitcoin 4 year cycle estimates roughly 10 million dollar bitcoin in year 2042

Re-test of Rising Wedge Breakdown May Signal TopIf Bitcoin is unable to get above the bottom of this long-term rising wedge, the top may be in when it fails to reclaim it upon re-test.
It could still go as high as 85-106k, or even higher the longer it takes to reach wedge bottom.
Given this turns out to be true, when this top is finally in we may see the deepest and longest correction in Bitcoin's history, targeting 1.5k, or even lower.
This could also be considered the makings of a double-top with a higher 2nd high, very similar to the structure of the previous ATH's double-top, but repeated on a larger scale. We may also see two attempts to re-test, just as we saw two highs last time.
A possible secondary signal that this is the likely scenario that will occur may be if the US Dollar Index continues up above its fall of 2022 highs:
Best of luck with your analyses and trading, and I hope you've found some valuable insight in the ideas we share together here.

BTC - 10 Year Time Behavior - BULLISH RALLY TO CONTINUEBased on past 10 year price behavior, BINANCE:BTCUSDT is set to continue its bullish rally until August 2025. Keep in mind there might be pull backs along the way.
Bullish and bearish rallies have been following a very similar time behavior the last 10 years, as pointed out in the chart.
Bearish rallies are averaging 12.6 months over the last 10 years.
Bullish rallies are averaging 32.5 months over the last 10 years.
WE can expect to reach the high for this bullish rally in August 2025. After August 2025, we can expect to see a pull back for 12-14 months, based on previous 10 year price action.
For now, look for Long entries on higher timeframes (Daily, 4 HR)!

If the ratio between ATH is decreasing by a half, then ....If the ratio between ATH is decreasing by a half, then i can predict the next ATH ... just math!
For this theorie, i just looked at the decreasing of percent for each all time high to the next one.
This is like x 64 ... x 32 ... x 16 (but not so accurate)
We saw a major bullrun from 0.39 USD to round about 30 USD ( ~ 77x )
We saw the next ATH at 1 143 USD ( ~ 38 x )
We saw the last ATH at 19 417 USD ( ~ 17 x )
The multiplication is cut in half each time. Because of this i predict the next 2 ATH just by using simple math:
19 417 x 8 = 155 336 USD
155 336 x 4 = 621 344 USD
In the chart, the values are not perfect because of scale, but i think you get the point ;-)
No financial advice!
I just want to leave it here and visit in 2021 and 2025 :-)


BTC/USD Halving 518 When will be the cycle price low and high.Main trend. Time frame 1 month.
This idea is almost a clone (in meaning, not visualization) of my previous idea published 1.3 years ago:
BTC/USD Secondary trend cycles and halvings.
For great visualization and clarity I added leap years (pre-pump, pre-distribution), this applies to all markets, not just the “young” cryptocurrency market... That is, after it, just the price is in the zone of distribution (sales), which is identical with the price highs of the secondary trend.
Bitcoin cycle 4 years:
Year 1 - birth of a new bullish trend (leap year).
By the way the next year 2024 is exactly like that. But, read carefully to understand the point.
For some time the price moves sideways or with a small rise.
Positive/negative alternates. Negative dominates.
There is no interest in the crypto market. The traffic of stupid money is minimal.
The volatility of the price of instruments is usually minimal.
This phase of the market is also called "participation" (more relevant to the second part).
In the final phase—active movement to the distribution zone (the zone of sales by large market participants—small).
In a given year (or near this time zone in the previous year), there is typically a second dump (second price low) with more aggressive dynamics by a large %.
Dump -60.66% 03 2020.
On the chart as an example of past dump at -60.66% (magnet) at the start of Corona 03 2020 (taking advantage of the world situation) before pumping the market in the future. Always keep this kind of thing in mind and be prepared for it, even if you are sure it is unlikely. Observe mani management.
Training idea/work 02 2020:
Trading by trends and important areas using the example of BTC
Something like a big triangle like 2020 is forming now.
BTC/USD Main trend (3 years) Channels Triangle 09 2023
Altcoins in this time zone cycle .
Altcoins tend to be in their accumulation channels. Alternately, from time to time, some are “firing” (usually of lower liquidity). Some produce “takeouts” under the dial zones.
The essence of this time zone for alts is to gain as much as possible % of positions from the market. The price is not important (the average price of a set is taken into account), alts typically follow the general market trend, which is logical and tactful from the position of long-term prospects of earning in cycles.
Year 2 - Bull Market. Trend price maximum and distribution zone .
Resetting positions by large market participants. That is, the smart money sells to the dumb at the market high.
The 17 weeks post-halving ( 518 days, gematria ) zone of perfect selling in crypto asset allocation. Roughly speaking it's a zone near price highs, at least that's always been the case in past cycles of bitcoin and the crypto market as a projection of it.
Altcoins in this time zone of the cycle.
Inadequate altcoin pumping. Typically, "old" cryptocurrencies are showing 5-10x (+500-1000%) of previous dialing zones. The average profit accumulation/distribution of almost any cryptocurrency is 5-8X, with the range of lows and highs (for hamsters) usually twice as large.
A huge amount of all sorts of crypto speculative garbage "promising cryptocurrencies" and "bitcoin killers" is created ... Pumped at the most inadequate interest with holding the reset zone for a long period of time due to the huge traffic of "stupid money".
It should be separately emphasized that in this time zone of the cycle huge traffic of “stupid money”, who want to get rich without understanding anything about it.
The crowd is not afraid to buy. This is key. The media is all about the positive.
A huge number of newly-formed crypto experts are young kids, whose expertise will disappear when the market turns around in the next sub-cycle....
Anyone can make money ("sitting on the trend"), even buying and holding anything for a while, of course, except for "promising high-tech crypto garbage" on inadequate pumps and with the same news positive accompaniment.
Absolutely all alts including high capitalization never repeat their price highs to bitcoin.
Year 3 Bear Market. Market dumps from area of distribution (selling) price highs to area of set (buying).
Price typically drops about -70%-80% on bitcoin
Typically, when a distribution support zone is broken, many scare tales or real negative news stories are created to scare and trigger a “crypto depression”. Subsequently, a mostly negative news backdrop dominates, usually of a made up fairy tale nature in “three lines” for the true fools.
Holders of “promising crypto” are bleeding, hope for the price to return to the previous value and "faith in projects" are gradually fading away. The final phase is dominated by the view that it's all a “crypto scam”. Bitcoin will "die." Toward the end of the phase, there is always a “bloody month” (price minimum)—before the formation of the dialing zone.
Altcoins in this time zone of the cycle.
Altcoins are declining from pumping highs before stopping the decline and moving sideways (set zones):
Highly liquid 80-90%
Medium liquid 90-96%
Low liquid (extinction candidates) from -95% and below % conditional on such "crypto trash on the verge of life and death".
Year 4 is the sideways zone, i.e. the accumulation zone. .
In this time zone after a significant dump (more than a year) there is a corrective price recovery movement. This is the so-called "intermediate bitcoin pumping cycle". We are just in it at the moment.
Altcoins in this time zone of the cycle.
Altcoins of high and medium liquidity depreciate, as a rule, by -90-93%. Once this % depreciation is reached, horizontal accumulation channels (1 major zone) of position set for the next cycle are usually formed.
"Cryptocurrency holders" who bought at or near price highs in the last cycle tend to all sell at a large loss in "tired of waiting" accumulation zones for their "promised bags of money".
Low-liquid altcoins depreciate in price by -95% or lower.
It is worth recalling that -95% from the previous -90% is -50%. That is another reduction of the deposit of the “grief trader” in two times.
A part of altcoins, which with a small "community of believers in the wrapper" - “dies”.
Often, the creators crypto run out of money for all sorts of marketing tricks. Then they pour the rest of their crypto phantom on the market, inventing some tale of hacking or something similar.... After that - "to the islands", until the next bull cycle. The sect of "deceived MMM depositors" scatters. The wrapper dies definitively....
Altcoins, including HYIP ones, which were created in the last cycle, are all depreciating. Out of the top 100 of the previous capitalization ranking, they depreciate beyond the top 1000. Never recover in capitalization and price not only to bitcoin, but also to the dollar in the future in the next cycle.
This is what bitcoin trend cyclicality looks like on a linear price chart

2017-2024 Fractal BitcoinTracking this Fractal 2024
Exp near future correction from 80 to 60...Load...

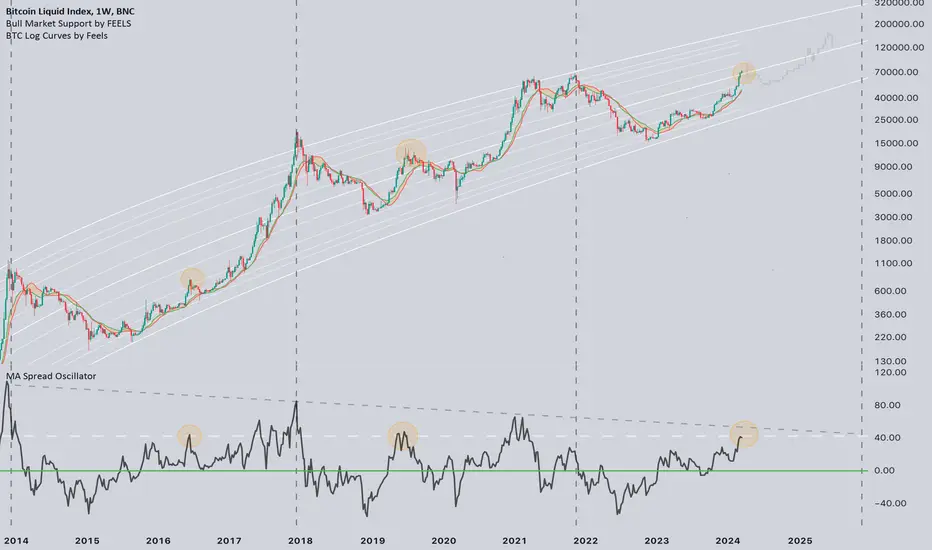
BTC reached the local peak? 👀#Bitcoin distance from BMS
Below is the oscillator, which shows how far the price has moved away from the bull market support. Mostly when we are in the 2-3 year of the cycle, the mark on the oscillator 40 acts as resistance, which indicates a mid-cycle peak.
Can it be different this time?🤔
Let's imagine that the CRYPTOCAP:BTC ETF inflow will be greater and distort the situation, in this case, we have a second trend line that indicates a global peak, which, by the way, becomes lower every cycle, now this mark is around ~50 on the oscillator or 80k on the price chart. You can consider this mark a best-case scenario for a local peak.
💡Remember, a good investor does not rely on one scenario but is ready for any.
came from future to leave this here. absolutely zero explanation will be given
absolutely zero explanation will be given

The Toppiest Top is in the CHARTS. BTC TO 200K OCTOBER 2025The chart shows the BTC cycles - green box is the bull run which usually lasts about 1064 days from absolute bottom to new ATH. Followed by the bear market marked by a red box lasting about 364 days. The new ATH each cycle is also historically 75-78 days after halving event. A fibonacci extension drawn from absolute bottom to ATH in the 2nd cycle and from ATH to bottom, shows that the 3.382 level predicted the next ATH for the 3rd cycle. Doing the same fib extensions in the 3rd cycle give us the red circle area. These 2 fib levels combined with 78~ days post halving and 1064~ days post absolute bottom show us that around October 13 2025 we could see a new ATH at anywhere between 176k to maximum of 225k.


Bitcoin - ZOOM 🟡🚀 ZOOM 🟡🚀 ZOOM 🟡🚀 #Bitcoin
ZOOM 🟡🚀
ZOOM 🟡🚀
ZOOM 🟡🚀
Stay tuned for updates dear Crypto Nation😎
Comments💭, Likes♥️ & Follow🔗appreciated🤗
Disclaimer:
Not financial advice
Do your own research before investing
The content shared is for educational purposes only and is my personal opinion

60-70k still in the cards for winter Bitcoin Sideways with no bounce until spring, then 150k; or heavy whipsaw volatility to kickstart bullrun to 150k? Either way i see BTC at a 6 figure price point later this year. The setup though, is unknown, given my 2 speculations above.
Although there was a scare this past wk, btc creen bollinger bands on the weekly have remained in the heavy upward pressure position, this will drag price up yet another week. Cant call bear until next sundays close. So we remain bullish. If upward pressure ceases; will update. Unlikely.

A key break into BULL Zone Congrats bitcoin holders. Time is the hardest thing to predict, though election time is when i see peak BTC price unfolding.
As we break into the bull triangle, we are in a bull parabolic move. Buckle up. See my past charts on btc for a broader view.

The monthly on btcusd.We haven't seen a monthly candle with a positive closing of more than 40% since 2020. There is little to say here, except that it will be difficult to understand when a correction will arrive, something that many are waiting for, it is not known whether buyers will give the possibility of seeing lower levels, the highlighted area is the one at 58k usd , where there is a price structure drawn in the previous bull run in early 2021.

BTC - observation on the monthly chartPast performance is not indicative of future results. Still, a little observation on the monthly chart:
Every time the RSI moved towards 70 coming from an RSI low, a correction of at least 2 months and at least 30% in price followed and that's pretty much where we currently are.


Will Bitcoin Hit ATH Before Halving?I posted a Log Regression when #Bitcoin was 15k.
I publish now when it is 62k. So CRYPTOCAP:BTC has already done x4.
What now? Shall we break the ATH? Let's consider the pros and cons.
This is why yes:
➕Increasing global liquidity.
➕So far, positive flow from ETFs.
Here's why not:
➖Strong overbought
➖Previously, there was no ATH breakout before the halving. And immediately after, the "sell in May" season.
➖Strong sales began (in medium wallets), because many people consider ATH a good zone to sell the part.
💡Conclusion. If we do not break the ATH in the next 2 months, it will likely happen in the autumn. In the base case scenario, I only expect a test ATH unless ETF flows and liquidity increase significantly.

MicroStrategy - Bitcoin Holdings Chart & Purchase HistoryPrices and volumes of Bitcoin purchases at MicroStrategy
Over 9k BTC at an average price of 58000. 19452 Btc at $52765.
Even these whales are buying at the tops and sitting in the minuses for years
The largest holder of Bitcoin on the planet is not Microstrategy , but the Chinese government, cryptoanalysts found (twitter.com/cryptoquant_com).
In 2019, Chinese authorities confiscated 194 thousand #BTC , 833 thousand #ETH and other coins as a result of an investigation into PlusToken fraud. To this day, the confiscated crypto lies in the wallets of China's national treasury.
In comparison, MicroStrategy has about 130,000 bitcoins .
27 march
MicroStrategy repaid its $205M Silvergate loan at a 22% discount . As of 3/23/23, $MSTR acquired an additional ~6,455 bitcoins for ~$150M at an average of ~$23,238 per #bitcoin & held ~138,955 BTC acquired for ~$4.14B at an average of ~$29,817 per bitcoin .
Best regards EXCAVO
