CELOUSDT trade ideas

CELO is currently oscillating below the key resistanceIn the four-hour chart, CELO is currently oscillating below the key resistance level at $0.9262. If this resistance level is broken, there is potential for an upward move towards the target of $1.0250, indicating a significant growth potential. However, if the price breaks below the ascending black trend line, it may enter a corrective phase.

Long signal for CELO/USDTThis technical analysis is based on the daily chart of BINANCE:CELOUSDT on the Binance exchange. This analysis draws two price channels and evaluates support and resistance levels.
Price Channel Analysis:
The previous bearish channel is broken out, and a bullish channel is formed.
The suggested entry point is around 0.7400 USDT.
Entry and Exit Points:
Entry: 0.7400 USDT
Take Profit: 1.0620 USDT (43.51%)
Stop Loss: 0.6932 USDT (6.33%)
R/R Ratio: 6.87
Conclusion:
This analysis suggests that by adhering to the specified take profit and stop loss levels, a successful trade can be achieved. The Reward/Risk Ratio for this trade is approximately 6.87, indicating a highly favorable risk-to-reward scenario. To manage risk effectively, it is recommended to strictly follow the stop loss level.

CELO, price is going in our POI areaWelcome, Trader. Welcome to our cryptocurrency community! 🚀We are delighted to welcome you, whether you are an experienced trader or a newcomer to cryptocurrency.
We are going to discussing #CELOUSDT 💹.
#CELOUSDT 🔥🚀
Update:
Timeframe: 8 hours.
➡️ CELO was moving downward, followed by the bullish falling wedge pattern.
we will wait for a retest or your can enter in trade when price comes in demand zone.
Breakout confirmation is also pending
We expect about 51% in the near future. 👉✅.

#CELO Growth Spurt: Buy Your Ticket to Profit!**Technical Analysis Chart Description:**
Welcome to my Technical Analysis charts on TradingView! Before we dive into the analysis, it's essential to understand some important warnings:
1. **Subjectivity Alert:** Technical analysis involves interpreting market data and chart patterns, which can be subjective. Different analysts may interpret the same data differently, leading to varied conclusions.
2. **Historical Performance Doesn't Guarantee Future Results:** Past price movements do not guarantee future price movements. While historical data can provide insights, it's crucial to consider other factors that could influence price action.
3. **Risk of False Signals:** Technical indicators and chart patterns can produce false signals, leading to potential losses if relied upon blindly. Always cross-verify signals with other indicators or fundamental analysis.
4. **Market Volatility:** Crypto markets are highly volatile and can experience rapid price fluctuations. Be prepared for sudden and unexpected price movements, which may invalidate previously identified patterns.
5. **Risk Management:** Proper risk management is essential. Never invest more than you can afford to lose, and consider using stop-loss orders to mitigate potential losses.
6. **Emotional Bias:** Avoid emotional decision-making based on short-term price movements. Stick to your trading plan and strategy, and don't let fear or greed influence your decisions.
**Disclaimer for Crypto Trading:**
Trading cryptocurrencies carries inherent risks, and it's important to understand the following:
Cryptocurrency markets are highly speculative and can be subject to extreme volatility. Prices can fluctuate significantly within short periods, leading to substantial gains or losses.
Investing in cryptocurrencies involves the risk of total loss of capital. Unlike traditional assets, cryptocurrencies are not backed by any tangible assets or central authority, making them inherently risky.
Regulatory uncertainty and market manipulation are additional risks associated with cryptocurrency trading. Regulatory changes or negative news can have a significant impact on prices.
This analysis is for informational purposes only and should not be construed as financial advice. It's crucial to conduct thorough research and consult with a qualified financial advisor before making any investment decisions in the cryptocurrency markets.
By using this analysis, you acknowledge and accept the risks associated with cryptocurrency trading and agree to trade at your own discretion. The author of this analysis shall not be held responsible for any losses incurred as a result of using the information provided.

CELOUSDT UPDATE #CELOUSDT (Update)
Hey all friends and traders. Hope you are enjoying our analysis. we are here to analyze CELOUSDT today.
Falling wedge Breakout done in 1D time frame.
We can see gain here up to 70%+ profit so far🚀

Imminent trend continuation for CELOCELO/USDT
Sector: Ethereum Layer 2
Market Cap: $450M
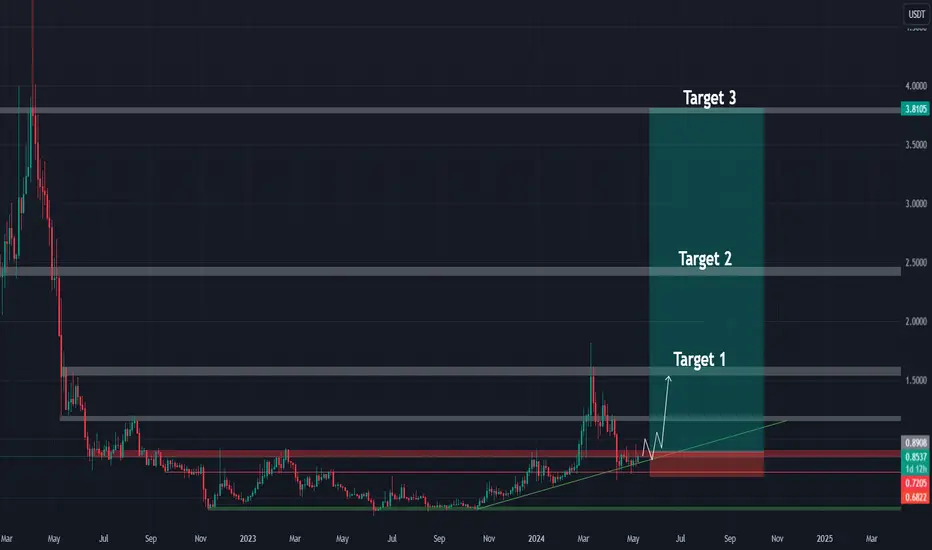
CELO has formed a wonderful accumulation over the last 2 years. Investors interest is clear and we've even had our first try of extraction from the range.
If you've missed the opportunity to DCA or buy a bag of CELO, you can take advantage of the fact that we re-entered the range to do so!
Although we've retraced the recent uptrend, this crypto remains solid and won't give way as we tested several times the trendline that has supported the price since the lower range boundary and we've started the uptrend.
If you don't plan to hold this crypto for the long term in the event of a market crash, you can place a Stop Loss below the uptrend line that is acting as a strong support right now.
CELOUSDT Elliott Waves AnalysisHello friends.
Please support my work by clicking the LIKE button👍(If you liked). Also i will appreciate for ur activity.
Everything on the chart.
Entry: Market and lower
Targets: 1.2 - 1.5 - 2 - 2.5
Stop: under 0.45 (depending of ur risk).
RR: 1 to 5
ALWAYS follow ur RM.
risk is justified
It's not financial advice.
DYOR!

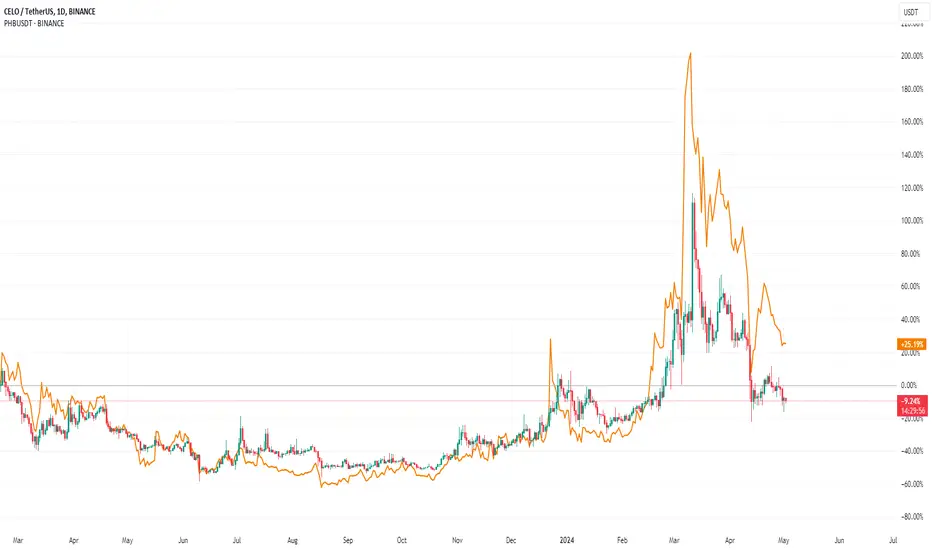
CELO vs PHBBoth the coins have same pattern, can give 10x - 100x in the next bull run expected to begin in the end of 2024 or the starting of 2025.
CELOUSDT.1DThe daily chart for Celo (CELO/USDT) displays a price structure that is forming a descending triangle pattern, which is often interpreted as bearish. The price is consolidating, with resistance (R1) at $1.1449 and a flat support level (S1) that seems to have been tested multiple times.
The price at the moment of the chart was $0.8488, and if the price breaks below the support level, it could signal further downward momentum. The resistance line, currently at $1.1449, is the level to watch for a potential bullish reversal if the price were to break through.
The RSI is leaning towards the lower half at 43.25, suggesting that there might be more room for downward movement. The ADL line is relatively flat, suggesting that there is not a clear trend in terms of accumulation or distribution.
Traders might look for a break below S1 as a confirmation of the continuation of the bearish trend, possibly with a target set near the previous lows or lower. If the price breaks above the resistance line, it could invalidate the bearish pattern and suggest a potential change in trend, where R2 would be the next target. As with any pattern, confirmation with increased volume on the breakout would provide additional

CELOUSDT IDEAHey traders hope you are enjoying our analysis. Now we are here again with a new trading opportunity. We will discuss today about CELO
CELO THE Bearish Rising Wedge Breakout has already Confirmed in 4H Timeframe ✅
Retesting in process✍️
Expecting +20%Bullish wave in Coming day's 🚀

#CELO/USDT#CELO
The price is moving in a bearish channel pattern on a 12-hour frame, which it adheres to perfectly.
We have stability above the moving average of 100.
We have an uptrend on the RSI indicator that supports the rise and is about to break higher
Entry price is 1.07
The first goal is 1.23
The second goal is 1.39
the third goal is 1.56

CELO/USDT Gearing up for a Bounce Back From the Bullish OB 👀🚀💎Paradisers, let's focus on the recent market dynamics surrounding #CELOUSDT.
💎Right now, #Celo is bouncing from the Bullish OB area, which suggests positive momentum in the market. There's a good chance for the asset to challenge the resistance trendline overhead, hinting at a potentially strong upward move.
💎If #CELO manages to break through this resistance, it could signal a continuation of its upward trajectory, with the potential to reach our target resistance zone.
💎However, if SEED_DONKEYDAN_MARKET_CAP:CELO doesn't manage to break out and gets rejected by the resistance, it could trigger a downward turn, possibly retesting the Demand area to rebuild momentum.
💎It's crucial for #CELO to rebound from the Demand Area. A breakdown below this point could lead to further declines, dragging Celo towards lower support zones or deeper into bearish territory. Keeping a close watch on how CELO behaves at these key levels is essential.

CELO SetupCELO Setup. After a confirmed breakout from the marked zone in green, we could take an entry at 0.9065 Remember stop loss is your friend. Everything is on the chart.
Entry 0.9065
S.L 0.8188
T.P 1 0.9556
T.P 2 1.0291
T.P 3 1.1129

#CELO/USDT#CELO
The price is moving in a downward channel trend on a 4-hour frame and is sticking to it well
After bouncing from a major support area in green at the level of 0.670
We have a tendency to stabilize above the Moving Average 100
We have a downtrend on the RSI that is about to break higher
Entry price is 0.0200
The first goal is 0.830
The second goal is 1.00
Third goal 0.744

CELO ANALYSIS (1D)After completing the diametric, CELO has entered a bullish wave that looks like an ABC or complex pattern.
Wave A of this bullish wave is over and we are now in wave B. There should be another bullish C wave.
The green range is a suitable range for sell/short positions.
The main targets are clear on the chart.
Closing a daily candle below the invalidation level will violate the analysis.
For risk management, please don't forget stop loss and capital management
When we reach the first target, save some profit and then change the stop to entry
Comment if you have any questions
Thank Yo

#CELO/USDT#CELO
The price is moving in a downward channel on a 4-hour frame, about to break upward
The area in green is a very strong support area from which the price rebounded at $1
We have an RSI trend coming up. The fraction is up
We have a higher stability than Moving Average 100
Entry price 1.27
The first goal is 1.39
The second goal is 1.58
Third goal 1.89

#CELO MEGA PUMP IS COMING#CELO Pump wil be Epic.!!
Bottomed ouy & Breaking the Major Trendline with Strong Bullish Volume.
Top Gainer soon

CELO USDTCELO Setup. After a confirmed breakout from the marked zone in green, we could take an entry at 1.1393 Remember stop loss is your friend. Everything is on the chart.
Entry 1.1393
S.L 1.0108
T.P 1 1.1866
T.P 2 1.2891
T.P 3 1.4026

CELO/USDTEverything is going according to plan, we are in the fourth Elliott wave. I believe the market will provide entry points as the overall picture in the cryptocurrency market is overheated.

CELO (CGLD) - {USD} 2024 Long Term 3xKeep a close eye on CELO short term, manage risk and decide when to buy or to short. But long term. CELO will easy 3x!
Support Broken= $1.08
New Support= $1.08
Resistance= $1.80
Target= $2.30
Smart choice if you decide to invest, would be to buy 50%, then buy another 50% if it drops lower to DCA :)

ScalpAccording to the waves analysis we can expect that price rise again to the green zone.
This is my personal opinion and is not an offer to buy or sell, please act according to your trading plan
follow me for more ideas

CELO USDTCELO Setup. After a confirmed breakout from the marked zone in green, we could take an entry at 1.1313. Remember stop loss is your friend. Everything is on the chart.
Entry 1.1313
S.L 1.0250
T.P 1 1.2194
T.P 2 1.3900
T.P 3 1.5843
T.P 4 1.7701
