WTIWTI analysis
1 hour time frame
The price can fluctuate between the ceiling and the floor of the specified areas
Futures market

Gold Price Analysis and Technical Forecast Let's delve into the current gold price situation and employ technical analysis to anticipate its future trajectory.
Support: Currently, a strong support level for gold prices lies around $2350 USD/ounce. This zone has repeatedly witnessed gold prices rebounding during recent trading sessions.
Resistance: A crucial resistance level is currently positioned at $2380 USD/ounce. Gold prices have struggled to surpass this barrier in recent times.
RSI Indicator: The RSI indicator currently stands at 55, suggesting that the market is in a neutral state, neither overbought nor oversold.
Trading Volume: Trading volume today has been relatively high, reflecting strong investor interest. This could signal accumulation ahead of a potential new uptrend.
Based on technical indicators and current market conditions, gold prices may continue their upward trend for the rest of the day. However, minor corrections are not ruled out as prices approach the $2350 USD/ounce resistance level. Traders should closely monitor key price levels and adjust their trading strategies accordingly.
What are your thoughts on the gold price trend today? Do you believe it will continue its strong ascent or encounter adjustments as it approaches new resistance levels? Share your insights and let's discuss!

XAU/USD 31 May 2024 Intraday AnalysisH4 Analysis:
Analysis/Bias remains unchanged from yesterday's analysis dated 30 May 2024
-> Swing: Bullish.
-> Internal: Bullish.
Price has printed a bullish BOS.
After bullish BOS, expectation is for price to pullback.
As previously mentioned, price was showing very early signs of pullback, however, we did not have indication or confirmation.
I also previously mentioned that first indication, but not confirmation, would be for price to print a bearish CHoCH. The CHoCH line is denoted with a blue dotted line.
Price has printed a bearish CHoCH which indicates, but not confirms pullback initiation.
As previously mentioned, if price cannot sustain its bullish momentum, it may seek to mitigate the H4 demand zone below.
Price was failing to break above discount of 50% EQ which could indicate the bulls are losing control momentarily or seeking further liquidity.
As previously mentioned, I have started to map internal structure to gain a better understanding of price action.
I mentioned that the blue dotted line will indicate an internal bearish CHoCH as price may pull back deeper to the extreme of the H4 swing low structure which is marked with a blue solid vertical line. Price has now printed a bearish CHoCH with price currently being contained within an internal range.
Black EQ marked 0.5 is swing range. Blue EQ marked 0.5 is internal range.
Intraday expectation: Scenario one: Price to continue bullish to target weak internal high which is denoted with a blue dashed line.
Scenario two: Price to continue bearish and react at H4 POI below to then target weak internal high which is denoted with a blue dashed line.
H4 Chart:
M15 Analysis:
-> Swing: Bullish.
-> Internal: Bullish.
Price has printed another bullish iBOS followed by a bearish CHoCH which indicates, but not confirms bearish pullback is underway.
Price is now contained within an internal range.
After reacting at discount of 50% EQ price has been unable to target weak internal high.
This could indicate that price is seeking further liquidity.
Intraday expectation: Price to react at M15 POI to target weak internal high which is denoted with a blue dashed line. The internal low, which is also denoted with a blue dashed line to the bottom of the chart is expected to hold.
M15 Chart:

Gold prices suddenly increased sharply againWorld gold expenses dropped sharply to 2,323 USD/ounce because of the effect of feedback on May 28 through Minneapolis Fed President Neel Kashkari approximately americaA Federal Reserve (Fed) now no longer reducing hobby quotes soon. on this year.
However, gold expenses all at once expanded sharply once more because of witnessing massive purchases from buyers after americaA initial assertion of first area GDP changed into decrease than to begin with expected. According to americaA Bureau of Economic Analysis, US first area GDP expanded through 1.three%, decrease than the 1.6% formerly estimated.
Market analyst Han Tan of Exinity Group stated that the gold marketplace is anticipating greater non-public intake intake data (PCE) for May to be introduced from americaA. If this index rises better than expected, it's going to boom the chance that the Fed will preserve hobby quotes unchanged for an extended length of time.
According to professionals from the Swiss Bank (UBS), there are three elements assisting the uptrend of gold, the maximum critical being the Fed`s financial policy. Analysts say that only a small hobby fee reduce through the Fed, even 25 percent points, might be sufficient to carry gold expenses to a brand new common high.

Bounce by ES 5180 LONG from there.This is the additional Pivot level we added to the Indicator CD_Camarilla All_Levels, so it is the extreme of the extreme buy level. Buying at this level S6 is very safe, just like selling an ALL time High R6, which has never cost me.
If you dob't know about The Pivots study my Ideas. We had. run for 3 months with over 99 trades before we had a loss ( We sold R5, and the FOMC made a surprise RATE change which aused the market to go up for 2 months.
Lesson to be learned there is #1 always safe a stop outside the pivots range, a catastropic stop, not a "tight stop" whch the MM use to tforce overtrading. #2 Don't trade, as a rule, before an FOMC announcement. These are swing trades based on 60" to 6 hour charrts, The Pivots don't show up in daily and above charts.
If you understand what The Pivots are and how they work you know why. a days pivot range is created based on the previous intraday Pivots range.
My trades are also based on many other factors, elliot waves, TTM Squeeze Pro, Candlesticks, etc.
In a 6 hour chart we have a shooting star to continue down. No doubt we will explore S5 and possibly S6.
I have been posting Ideas for 8 years here. Look at my past posts.. 2019 i predicted we would go up for 5 more Ellitot waves before the first ATH Jan 22.
My next major post/Idee was March 2022, I shared that we had a "Tripple Thrust parrern from 2010 we went up on 3 sets of 5 waves up, corrected down from a lwer high, down for 6000 points on the NQ.
Then I posted we would continue up as part of Elliots, Grand Supercycle Bull Market to new ATH which we have all seen.
If you like my Ideas please follow me.
I called this a LONG, but don't buy before S5 or S6 next week.


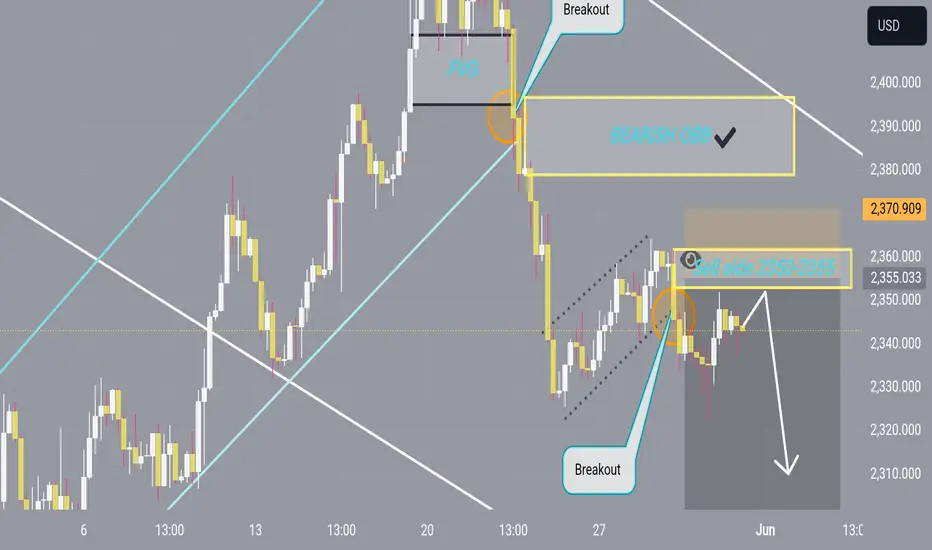
GOLD, back on the decline?! So I'm short the XAUUSD.
We are currently in an interesting setup. Let's see how the price reacts. Gold is pretty hard to trade at the moment.
The setup in question:
Back in OTE zone
Order Block in M30
BOS target
There's a lot of liquidity below $2303, and I think we could go looking for it in June.
Feel free to subscribe and put a boost on this post if you enjoyed my analysis, and tell me what you think!
Happy trading and a great weekend :)

XAUUSD (GOLD), downward trend after bull accumulate.Hi friend. Lets look at gold chart window. We have more then 2k of bulls accumulate. So my opinion price will fall to 2328 secondly. Thanks for your support.

XAUUSD - Bullish Reversal PatternAs the chart is indicating the double bottom reversal pattern and there is also a divergence.

XAUUSD h4 | Bearish momentum Based on the H4 chart analysis, we can see that the price is rising toward our sell entry at 2359.34, which is a pullback resistance close to 23.6% Fibo retracement
Our take profit will be at 2326.54, an overlap support level.
The stop loss will be placed at 2396.95, a pullback resistance level.
High Risk Investment Warning
Trading Forex/CFDs on margin carries a high level of risk and may not be suitable for all investors. Leverage can work against you.
Stratos Markets Limited (www.fxcm.com):
CFDs are complex instruments and come with a high risk of losing money rapidly due to leverage. 68% of retail investor accounts lose money when trading CFDs with this provider. You should consider whether you understand how CFDs work and whether you can afford to take the high risk of losing your money.
Stratos Europe Ltd, previously FXCM EU Ltd (www.fxcm.com):
CFDs are complex instruments and come with a high risk of losing money rapidly due to leverage. 70% of retail investor accounts lose money when trading CFDs with this provider. You should consider whether you understand how CFDs work and whether you can afford to take the high risk of losing your money.
Stratos Trading Pty. Limited (www.fxcm.com):
Trading FX/CFDs carries significant risks. FXCM AU (AFSL 309763), please read the Financial Services Guide, Product Disclosure Statement, Target Market Determination and Terms of Business at www.fxcm.com
Stratos Global LLC (www.fxcm.com):
Losses can exceed deposits.
Please be advised that the information presented on TradingView is provided to FXCM (‘Company’, ‘we’) by a third-party provider (‘TFA Global Pte Ltd’). Please be reminded that you are solely responsible for the trading decisions on your account. There is a very high degree of risk involved in trading. Any information and/or content is intended entirely for research, educational and informational purposes only and does not constitute investment or consultation advice or investment strategy. The information is not tailored to the investment needs of any specific person and therefore does not involve a consideration of any of the investment objectives, financial situation or needs of any viewer that may receive it. Kindly also note that past performance is not a reliable indicator of future results. Actual results may differ materially from those anticipated in forward-looking or past performance statements. We assume no liability as to the accuracy or completeness of any of the information and/or content provided herein and the Company cannot be held responsible for any omission, mistake nor for any loss or damage including without limitation to any loss of profit which may arise from reliance on any information supplied by TFA Global Pte Ltd.
The speaker(s) is neither an employee, agent nor representative of FXCM and is therefore acting independently. The opinions given are their own, constitute general market commentary, and do not constitute the opinion or advice of FXCM or any form of personal or investment advice. FXCM neither endorses nor guarantees offerings of third party speakers, nor is FXCM responsible for the content, veracity or opinions of third-party speakers, presenters or participants.


Gold trading strategy today!Gold prices saw a modest increase on Friday due to a weaker US dollar and lower US bond yields. Traders are increasingly betting that the Federal Reserve will cut interest rates this year following the recent weaker US GDP data. Additionally, geopolitical risks and conflicts in the Middle East could further support the precious metal.
However, in the short term, we may see gold move sideways with a crucial support level at $2,330. If this level is breached, gold could weaken significantly. Therefore, investors with a bullish outlook need to focus on protecting this support level to maintain the upward trend.

TODAY GOLD SELL AREAHey there on 4hTF the Gold has looking forward to be retest 2350 and 2355
So we can observe that Gold has returned back from 2350 and next target is 2300
xau short looking goodretest strat, on resistance.
news not the best for market, likely retest back down abit.

XAUUSD GOLD - Selling pressure / Sell opportunity? ### XAUUSD GOLD
==============
Check out the background information (), and also review the related ideas.
A strong pullback at the current level is needed to confirm the break of the Timer TL and to justify short positions moving forward. Without this pullback, short positions become risky, as a bounce from the bottom of the trading range marked in purple is likely.
A seemingly lucrative sell opportunity might be present right now. As traders, our job is to find opportunities, assess the risks involved, plan accordingly, and execute trades. Considering all possible outcomes, the results will reflect our performance.
In view of potential further weakness in the markets and price movements favoring our shorts, it is crucial to remain mindful that this forecast is in its early stages. Continuous monitoring of momentum is vital, especially watching for signs of persistent strength entering the markets.
- Always size positions properly according to your risk level.
- Always be prepared for losses just as you expect profits.
- Always plan your trades according to the principles above.
Observe your drawdown (DD)!

$XAUUSD - Today’s Setup - 31/05Good morning Traders 😎
This is my setup for today 🙌🏻
Trade smarter, not harder! 💼📈
Don't miss out on potential gains - Hit that BOOST button if you like the idea 👍 Share these 👉 and make sure to Follow me for your daily dose of gold trading analysis! 💯
Remember, always conduct your own analysis before jumping in. No financial advice here.

BUY OPPORTUNITY IN GOLD Price currently trade at $2,344. A buy opportunity is envisaged from the Current market price. Target is $2364

VX Paths for PCEI'm bullish on VX for now, but I'm open to a failure. These are.the paths I'd expect.

Gold ( XAUUSD ) Outlook !!!www.tradingview.com
Gold (XAUUSD) is navigating a descending triangle pattern and has rebounded from its upper edge. The 50-period moving average adds an additional layer of resistance for the asset.
If it breaks above the 2345 resistance level, it could clear the path to the 2365/2390 resistance
Conversely, a rebound from the upper edge may trigger a decline to the 2310/2285 support level.
The overall trend is positive, yet a dominant buyer has not emerged. The market is in anticipation of news. On a local scale, the trend is downward. To validate a shift to a local upward trend, the price must surpass and stabilize above the range of 2354 - 2364; this would set the stage for a potential rise to 2400. However, should the price fall below 2328, it could trigger widespread market concern.

Triangle on GoldWaiting for inflation reports today then Gold should break out the triangle Up or Down

XAUUSD SHORTIM LOOKING SHORT ON XAUUSD , If you have any suggestion please comment below.., Happy trading

WTI in daily chart Hello
I don't think it is necessary to repeat same expressions because it is really boring. What is happening in OIL market is to decrease the price and increase the sell power to balance it.
WTI was able to penetrate into our resistance level and it is making a first wave. We traders should change our decisions whenever it is necessary and never insist in our ideas. For now I am following the bearish market for Oil. I am not sure how long it can correct (may till Trump becomes US president) and we have to decide fir short-term because Oil (as I mentioned in my last ideas) is in a consolidation (range) are with many R/S level.
Thanks

XAUUSD (GOLD)Today possible trades
Take your own risk but also remember today monthly candle close so market will be volatile and big volume come
