Emerging markets reversal to be favored again?EEM has 27% weight in China and 18% in Taiwan. Seems like peace may be on the horizon? Or, India is picking up the slack (17% weight).
EEM trade ideas
EEM before the collapse downNow the growth can end at any moment and then there will be a fall down to the level of 2009.
It could be head and shoulders

$EEM short as a hedge against a rising $DXYAMEX:EEM is a bearish opportunity it breaks $37.47, (both current support and the prior weeks low). Other support:
- AVWAP
- Low volatility node (LVN) in the volume profile on the left.
Initial targets might include: POC, VAL
AMEX:EEM is a good candidate for hedging TVC:DXY , on bottom.

EEM to be supported by weaker USD and lower rates in 2024I started to believe that as yield trends are changing globally, and yields will likely be lower in 2024, while I expect USD to trade rather a little weaker, this all should help Emerging Market Stocks to reverse and start to show a better relative performance against SPX and DAX.
Key technical levels to watch are 40.20 and 42.
A close above 40.20 would strengthen bullish bias, while a close above 42 on a weekly basis would also confirm a long term bullish trend.
I see better risk/reward in Emerging stocks from these post covid era levels, than for US or European markets.

$EEM: A Revisit Above 40?We're looking at emerging markets here for a possible intermediate term pop above the 40 handle possibly into 41. China will need to stop going down and KWEB will need to hold 25 but we'll see. Good look traders!

#EEM Emerging markets poised for a breakup ?While not a perfect construction this does look like an inverse Head and Shoulders. A break above the neckline resistance at 39.85 should see this poised to move to 42.00 and then the target of 43.30 which is almost 9% higher. Note price has been consolidating above the 200dma now for 13 days which is quite significant and i think the probability favour an upside breakout.

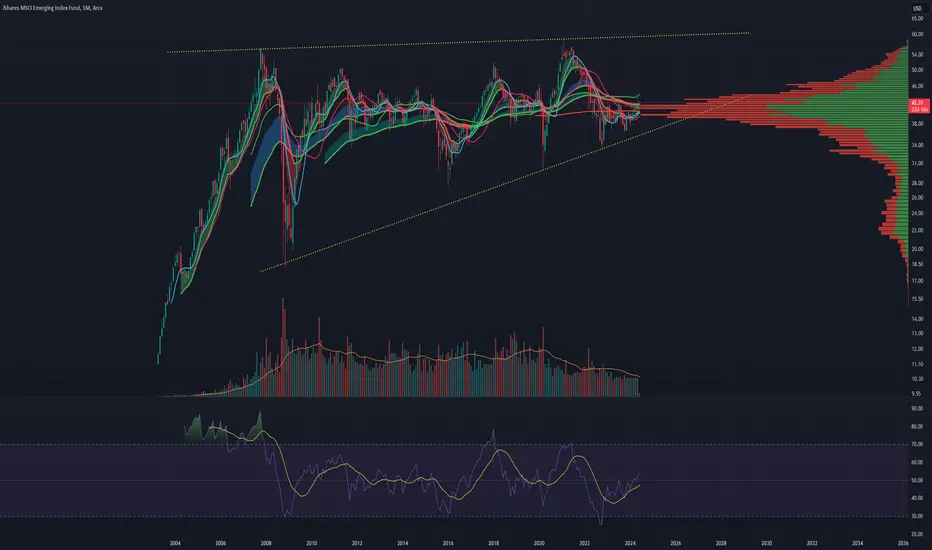
"OG EM ETF" EEM, MONTHLY CHART, 20-Year PatternsFascinating long-term pattern in emerging markets:
- 20-year Symmetrical Triangle
- breakouts from the triangle in 2017 and 2020, with runs to long-term resistance established in 2007-2008
- since 3Q-2021 a bearish downtrend, through the triangle has been created
- a pattern continuation suggests a breakdown out of the triangle, and down to $30, or possibly $27.50

Back to the top of the FlagContinuing in an almost 20 year Flag pattern. I expect an eventual breakdown out of the flag (I guess), but for now, we continue within the pattern.

EEM and deflationary cycles wave c of b bottom soon the chart posted is that of another etf that seem to want to fade to black . But for now we should see a low into this time frame and then see a half rally . into jan /mar 2024 before the Depression is clear in the euro zone

Emerging Market Fund (EEM) Turns the corner against NasdaqIntroduction
Since the 2008 Financial Crisis NDX has been “the” trade for anyone looking for easy gains in equities. It has stomped out precious metals, emerging markets and the like. Even crypto powerhouses like Bitcoin and Ethereum are sideways against NDX since the 2018 crypto bear market and smaller alts have been clobbered against NDX in the most recent bear market.
Against all this we now have the Emerging Market ETF, EEM, turning technical corners against NDX on the monthly time frame. This idea is more of an investing idea rather than a day or swing trade idea. And it point to finding entries into EEM.
Main Chart
The main chart has a very simple draw. It takes a bearish fib draw from the all time high to the bull trap low. The gavel shows where price returned to the 1 line and previous support was turned into resistance. From there the pair bear market began in earnest.
Price consolidated for about 3 years on the 2.618 level before continuing downward. That leve is also confirmed by the VPVR. We see similar levels of consolidation at the 3.618 an 4.0 level. Price is currently just bounced of the 4.618. Conceivably price could go and hit a 5.0 extension with the divergence indicators showing bullishness n the monthly chart I don’t see that being a likely scenario.
Divergence Primer
Normal Divergence (Trend Reversal)
Bearish: Higher highs on price action but lower highs on the indicator
Bullish: Lower lows on price action but higher lows on the indicator
Hidden (Trend Continuation)
Bearish: Lower high on the price action and higher highs on the indicator
Bullish: Higher low on the price action and a lower low on the indicator
Divergence Indicators
The RSI, Stochastic and Stochastic RSI are some of the first indicators traders learn about when they begin to trade. There is a lot of value one can get out of their use by mastering the fundamentals rather than running off for more esoteric indicators. The Logrithmic MACD is a advanced look at the MACD that can be useful whenever you look at a underlying asset that is best viewed logarithmically for its charting and targeting.
Relative Strength Index
A very simple indicator for looking for divergences. The chart clearly shows that there have been 2020 we have had two lower lows on price action but two higher highs on the RSI. This is clearly normal bullish divergence and suggest a trend reversal is coming. Even more importantly the RSI has climbed its way above the key level of 25 on this most recent bounce. One of the main things I am looking for is a swing low with hidden bullish divergence. A buy of a low with hidden bullish divergence is one of my most preferred buys for trades and investments.
Stoch RSI
The Stoch RSI is derived from from the RSI and helps confirm any divergences on the RSI. Seeing bullish divergence on the Stoch RSI helps confirm the fact that price action is turning the corner and ready to reverse. This indicator will be useful when combined with the EEM chart to help buy pull backs. It will also be useful to see any further bullish divergences.
Log MACD
The log MACD is undulating below zero Despite any bullish divergence we see we can know we are a long way away from seeing an impulse move upward on EEM/NDX while the LMACD is below zero. If we see the LMCAD with bullish divergences above zero then we can know that the move will be a lot more impulsive. As it stands, this is still time to accumulate EEM against NDX.
EEM
EEM has hidden bearish divergence on the 2020 C19 low to the low of October 2022. I am going to be looking for another low shortly to see what divergences can be seen. I hope to buy in against or below the monthly BB.
Another look with fewer indicators and some ambitious trend lines.
Conclusion
There is a lot of noise about financial resets and that can mean a lot of different things. For me, nothing totally resets but there are transition periods of major rotations. With emerging markets so low against the NASDAQ it seems likely they will benefit from rotation as people sell something that is overvalued (NDX Stocks, other US equities) and try to move into things that are comparatively undervalued.
A look at EEM is looking for a investment that can be held perhaps for decades or until some young’un wants to retire. There is probably a lot of consolidation and accumulation that needs to occur before any big move happens. But when it starts to move it should be quite impulsive for a index. But for now, lots of basing out and dip buying.

Emerging Markets Show A Corrective Decline For StocksEmerging markets show a corrective decline for stocks from technical point of view and from Elliott wave perspective.
Emerging markets chart with ticker EEM made sharp an impulsive rally at the end of 2022, which indicates for more upside after a corrective a-b-c setback that is actually still in progress since the beginning of 2023. So, for stock market support keep an eye on EEM chart, as they are in positive correlation.
With current slow down in the stock market, we can see it finishing wave »c«, but wave »c« has still room down to 61,8% Fibo. and 36-35 support area before market stabilizes.

$EEM bearish move?AMEX:EEM looks to be breaking down here. On OBV, there's been a double top. Price looks to be breaking the upwards trend that's been forming since Oct 2022.
I think price is likely to hit the second support level at $33 before bouncing. However, if there's a strong move down, can see it hitting $30 as well.


$EEM: Emerging Could EmergeFollowing the developments in AMEX:IZRL , AMEX:FM and AMEX:EEM we see a similar theme developing. Though this may appear to be a head and shoulders, emerging market stocks could be a smart bet while the Fed figures out what it will do next. We will look for support to be between where it is now and 37.5.

MSCI index viewAfter meaningful correction in global markets, especially ripple effect from US economy markets. MSCI index - Emerging markets are now at attractive valuations.
Technically, look at the monthly chart and the support trendline on it. Also, with the series of significant rate hikes by the US Federal Reserve and all global bankers - It seems the last leg of correction might come shortly.
Try to accumulate quality stocks in near future with 3 years long view, especially from NSE 200 basket

$EEM: Long term bottomThe time seems to have come to consider allocating to Emerging Markets here, I am thinking of entering a position today. India and Mexico are set to benefit from decentralization of supply chains, China is about to get stimulus to consumption from govt, and AI is generally a source of growth and higher efficiency for the world going forward (solves the issue with demographics deteriorating). Oil has fallen enough to create a long term tailwind to earnings going forward and demand destruction from it being too high is out of the way (its effects were felt in a recession that took place, combined with CB actions causing further damage.)
Now the Fed has to reverse course, as a bonus, and China credit growth is accelerating again (after being negative for a good while)
I would secure some gains in healthcare to get an Emerging Markets allocation, I had a big position in the top profitable healthcare names as a defensive bet, but AI changes many long term levers here. I do like the idea of trading healthcare actively though, but Emerging Markets seems like a better proposition now and healthcare names are over extended (like NYSE:LLY , NYSE:TMO , NYSE:WST , etc.)
Many valuations are very attractive in Asia currently, and technical setups are getting traction. It's go time.
Best of luck!
Cheers,
Ivan Labrie.

EEM ShortI am bearish on EEM as there identified 3 start pattern which indicates potential reversal for this underlying. Also, it can not break its 50SMA which also indicates potential bearish price action.
In my opinion EEM is going to test 38s soon

EMERGING MARKETS 7 year bottom is in. Huge upside potential.The MSCI Emerging Index Fund (EEM) is posting a bottom rebound pattern similar to early 2016 and 2009. All all cases the 1W RSI previously broke below the 30.00 oversold level and rebounded strongly. As you see these bottoms take place approximately every 7 years. This indicates that the Emerging Markets are only at the start of a two year mega rally.
-------------------------------------------------------------------------------
** Please LIKE 👍, FOLLOW ✅, SHARE 🙌 and COMMENT ✍ if you enjoy this idea! Also share your ideas and charts in the comments section below! **
-------------------------------------------------------------------------------
💸💸💸💸💸💸
👇 👇 👇 👇 👇 👇

Head and Shoulders on $EEMThe $EEM daily chart is showing a massive Head and Shoulders formation, with the Neckline set at $38. This could be a sign that the price will soon break to the downside, as Head and Shoulders are usually considered bearish reversal patterns. The market will now be watching for a break below $38 in order to confirm the bearish reversal. If the price does break below $38, traders may want to consider shorting the $EEM as the price could continue to decline.

EMERGING MARKET INDEX Chart Fibonacci Analysis 030723 1) Find a FIBO Slingshot
2) Check FIBO 61.80% level
3) Entry Point > 39/61.80%

Emerging Markets ETF is about to take offEEM is ready for a 6.5% gain with a stop at 38$ which means 1.25% risk on a trade.

MSCI EM and DXYDollar and EM markets.
A non Brainer with 1:1 correlation.
The DXY (black line) is inverted to show the coorelation with EM.
Strenthening Dollar means weaker EM and vice versa.
Soince with rate ris eback inti the limelight, the DXY should rally an dEM would be under pressure. The weakness of Chines Equity markets which makes up 31% of MSCI EM would also be a factor.
