As predictedPrice has delivered exactly as predicted weeks ago. Look for buys at the fvg or ideally the OTE.
Futures market

Beautiful movement lowerWe see a text book movement to take the previous swing low liquidity. We dig deeper into the monthly order block. HTF is always king. I would like to see a little deeper dig lower over the next couple of days and then a bullish reaction to take prices higher. Purely based on algorithmic price delivery.

Corn,Price actions didnt hold up last week..Hello fellow traders , my regular and new friends!
Welcome and thanks for dropping by my post.
Turning bearish on this one..wheat could be as well..it seems like trying to push lower with the toppish pattern that you are seeing on h4...
Do check out my recorded video (in trading ideas) for the week to have more explanation in place.
Do Like and Boost if you have learnt something and enjoyed the content, thank you!
-- Get the right tools and an experienced Guide, you WILL navigate your way out of this "Dangerous Jungle"! --
*********************************************************************
Disclaimers:
The analysis shared through this channel are purely for educational and entertainment purposes only. They are by no means professional advice for individual/s to enter trades for investment or trading purposes.
*********************************************************************

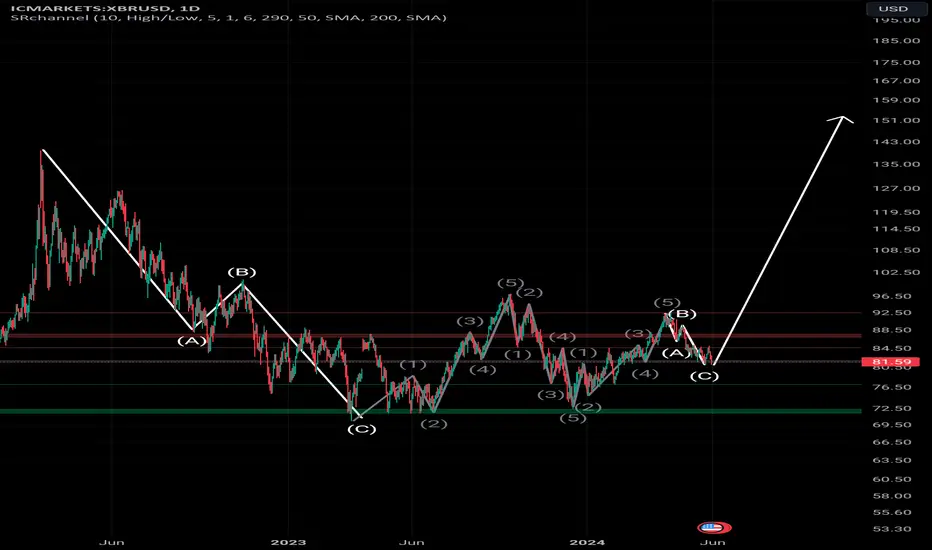
XBR USD SWING LONG ENTRYCrude oil has completed a 3 wave correction on the daily and also corrected on the h4. And will be seeing a higher highs from here breaking the resistance. It's important to note that this trade is high rr with small risk. I will be taking this trade few hours market open.
Let me know if you have any questions agree disagree I will be listening :)
Trade safe!
XAUUSD AnalysisPrice is now at the daily order block. Price will either continue holding support or break structure to start long term sell. Watch for liquidity in the zone.

ES1! big picture updateMy bullish count for ES1!. I have us in wave 3 of (5) of ((3)) of V.
It looks like wave 2 has completed. I expect ES1! to grind up the rest of the spring and summer, with target of ~6000 and the median line of the pitchfork drawn from COVID-19 low, January 2022 high and October 2022 low.


Nasdaq $NQ EoM ReviewSimilar to ES, NQ has printed highs @ $19,023 before a minor retracement occurred.
Buystops in question: $19,023.25
Sellstops in question: $18,241.25

S&P 500 $ES EoM ReviewAll-time highs booked @ $5,368.25 before a minor retracement below the 13th May 24 lows.
Area of interest:
Buystops: $5,368.25
Sellstops: $5,205.50, $5,166.50

US Bonds EoM Review Teetering around both PD arrays on a a macro timeframe with 114.11 sellside and 118.23 buyside in scopes

$XAUUSD - Monday Jun 03 - Range Filling Idea - 2300 TappingGold got to tap 2300.
Gold just tapped 2449 on the monthly and was mirroring the move from April.
Monthly Closed Bullish as Weekly and Daily closed Bearish.
The Daily Range We are at is 2327-2361, as we just tapped 2361 before Friday drawdown.
We got big news on Monday which should make a high volume price action.
That`s why i think we must see range breakout bullish nor bearish.
If we will break bearish we will definitely will tap at least 2300 before heading somewhere else.
If we will break bullish, we must have a liquidity grab before (tapping at lease 2300) before moving somewhere else.
That`s my i think both directions are pointing at 2300 tapping bullish or bearish.
This is Monday Sells for me - GL!

my bias for the upcoming weekFor me the market is bullish but it gonna retrace first then make the real move


Gold SilverNew Week - New 2 Week - New Month Range...
If the 180-90-45 doesn't give you a good answer one of the other 3 will

NQ1 & SP1 W BLACKSWANNNNNN!!!!!!! GG USA & DOLARCME_MINI:ES1! TVC:DXY CME_MINI:NQ1!
This is my own opinion, for better or worse. God knows. From what I see, Nasdaq and S&P 500 are facing a very serious collapse. Keep this in mind if you want to open a big short position. You can see an example of a black swan pattern and my concept intersecting on the chart. If you ask me, the problem is significant, and the end of the dollar has come maybe ww3.

Gold prices rose for four consecutive months, and important data
This week, the spot gold market showed a range of fluctuations, with the amplitude significantly narrowed compared with the previous period. After the PCE data was released on Friday, it rose only briefly and then quickly turned to a decline, recording a decline for the second consecutive week. It is worth noting that although gold rose for the fourth consecutive month in May, the monthly amplitude was significant, exceeding $170, indicating that market volatility is still high.
The Fed's interest rate cut expectations once again ushered in "good" news. The recently released economic and inflation data were both revised down, and the core PCE was lower than expected, but gold did not take this opportunity to break upward.
The US economic and inflation data in the first quarter performed poorly, and the unemployment rate rose year-on-year in some areas, indicating that the economy may be weakening. In addition, the rise in 30-year mortgage rates also put some pressure on home purchases and refinancing demand. The inflation indicator favored by the Fed continued to cool, and the core PCE monthly rate in April recorded a new low. After the release of this data, investors' expectations for the possibility of the Fed's first interest rate cut in September have increased. However, the market remains cautious about the Fed's decision because the Fed needs to make a difficult choice between balancing inflation and economic growth.
Although the consumer confidence index unexpectedly rose in May, with average expectations reaching the highest level this year, the market remains cautious about the impact of the Fed's high interest rate policy. Fed officials have recently stopped saying they expect further tightening this year, but officials who have been intensively dispatched after the short holiday still refused to predict the specific time of the first rate cut.
In the statements of officials, we can see different voices. "Big Hawk" representative Kashkari believes that the monetary policy stance is still restrictive, but has not completely ruled out the possibility of further rate hikes. He personally predicts that the number of rate cuts this year will not exceed two. Director Bowman supports slowing down the balance sheet reduction or slowing down at a smaller scale, believing that caution is needed when the use of reverse repurchases is still large. Dallas Fed President Logan holds a different view. He believes that high interest rates may not be as restrictive to the economy as policymakers expect, so all policy options need to be retained to maintain flexibility.
However, some officials are more optimistic about the prospects for rate cuts. New York Fed President Williams said that there is sufficient evidence that monetary policy is restrictive, interest rate hikes are unlikely, and inflation is expected to continue to fall in the second half of this year. Although Atlanta Fed President Bostic does not think there will be a rate cut in July, he also hinted that if September is suitable for a rate cut, the Fed will take action, but not for political considerations.
The market generally expects that at the upcoming policy meeting, Fed officials may lower their forecasts for the number of rate cuts this year from the previous three to one or two that are closer to the current expectations of the financial market. Judging from the pricing in the interest rate swap market, option traders generally believe that the Fed will maintain high interest rates for a longer period of time.
In addition, the suggestions made by Cleveland Fed President Mester are also worth paying attention to. She suggested that the Fed statement should be longer and an anonymous matrix should be published to show the series of forecasts of the corresponding figures in the SEP. This suggestion may increase the transparency and predictability of monetary policy. The Cleveland Fed has appointed former Goldman Sachs partner Hammark as the next chairman, who will bring new perspectives and experience to the Fed in finance, capital markets and risk management.
In addition, the latest Beige Book released by the Federal Reserve also revealed some new dynamics in the US economy. Since early April, most Fed districts have seen moderate economic growth and inflation, consumers' price sensitivity has increased, and retail spending has remained flat or grown slightly. This shows that although the US economy is still expanding, the growth rate has slowed down and it is facing the pressure of continued inflation and high interest rates. The Beige Book also mentioned that companies have become more pessimistic about the future prospects, which may further affect economic growth.
In the next June, the market will usher in a series of important economic data and events. The first is the release of non-farm data in May, which will directly reflect the situation of the US labor market. If the unemployment rate continues to rise, especially if it reaches 4%, then the alarm of the labor market may have sounded, which will force the Fed to consider starting insurance rate cuts in advance.
Next is the May US CPI data and the convening of the FOMC meeting. These two major events will jointly determine the market trend. The release of CPI data will reveal whether inflation will continue to decline, and the statement of the FOMC meeting will directly affect the market's expectations for future monetary policy. In particular, the release of the dot plot will reveal the forecasts of Fed officials for the number of interest rate cuts this year. If a voting committee lowers the expectation of interest rate cuts within the year, then the number of interest rate cuts expected by the entire Fed will decrease, which will have an important impact on the market.
We also need to be alert to a more extreme situation: if most Fed officials lower their expectations for rate cuts this year, the Fed's expected rate cuts this year will drop directly from three to one. Although the probability of this happening is small, once it happens, it will boost the dollar and bonds, while suppressing gold. Therefore, we need to pay close attention to the statements of Fed officials and changes in market expectations.
Of course, as a loyal trustor of spot gold bulls, we prefer to see a situation that is favorable to rate cuts, and a situation that is favorable to rate cuts is bound to be a positive boost to spot gold.
In the coming June, spot gold is about to have a storm, so let us move forward cautiously!

XAGUSD. Weekly trading levels 3 - 7.06.2024During the week you can trade from these price levels. Finding the entry point into a transaction and its support is up to you, depending on your trading style and the development of the situation. Zones show preferred price ranges WHERE to look for an entry point into a trade.
If you expect any medium-term price movements, then most likely they will start from one of the zones.
Levels are valid for a week, the date is in the title. Next week I will adjust the levels based on new data and publish a new post.
! Please note that brokers have a difference in quotes, take this into account when trading.
The history of level development can be seen in my previous posts. They cannot be edited or deleted. Everything is fair. :)
----------------------------------------------
I don’t play guess the direction (that’s why there are no directional arrows), but zones (levels) are used for trading. We wait for the zone to approach, watch the reaction, and enter the trade.
Levels are drawn based on volumes and data from the CME. They are used as areas of interest for trading. Traded as classic support/resistance levels. We see the reaction to the rebound, we trade the rebound. We see a breakout and continue to trade on a rollback to the level. The worst option is if we revolve around the zone in a flat.
Do not reverse the market at every level; if there is a trend movement, consider it as an opportunity to continue the movement. Until the price has drawn a reversal pattern.
Don't forget to like Rocket and Subscribe!!! Feedback is very important to me!

XAUUSD (GOLD) CHART UPDATEXAUUSD CHART UPDATE (GOLD): I expected gold to form an "M" PATTERN which it has continue to form. i currently expect price to drop to the completion of the leg or the final leg of the "M" pattern, after which i will also be expecting price to move up to the neckline @ 2,288 before the bullish continuation to 2,443.97 which is our all time high.🔥

XAUUSD. Weekly trading levels 3 - 7.06.2024During the week you can trade from these price levels. Finding the entry point into a transaction and its support is up to you, depending on your trading style and the development of the situation. Zones show preferred price ranges WHERE to look for an entry point into a trade.
If you expect any medium-term price movements, then most likely they will start from one of the zones.
Levels are valid for a week, the date is in the title. Next week I will adjust the levels based on new data and publish a new post.
! Please note that brokers have a difference in quotes, take this into account when trading.
The history of level development can be seen in my previous posts. They cannot be edited or deleted. Everything is fair. :)
----------------------------------------------
I don’t play guess the direction (that’s why there are no directional arrows), but zones (levels) are used for trading. We wait for the zone to approach, watch the reaction, and enter the trade.
Levels are drawn based on volumes and data from the CME. They are used as areas of interest for trading. Traded as classic support/resistance levels. We see the reaction to the rebound, we trade the rebound. We see a breakout and continue to trade on a rollback to the level. The worst option is if we revolve around the zone in a flat.
Do not reverse the market at every level; if there is a trend movement, consider it as an opportunity to continue the movement. Until the price has drawn a reversal pattern.
Don't forget to like Rocket and Subscribe!!! Feedback is very important to me!


USOIL - Are we going up? Going to see how the day closes before taking any trade but here my thoughts
Technicals
→ Price respected .618 FIB retracement
→ We broke out of channel and retested it
→ Monthly candle will close semi-high probability we're going up to create at least a top monthly wick.
Fundamentals
→ Important next week is OPEC+ meeting 2nd June.
Trade
→ For intraday/swingers long opportunity to go up for about 1:3R
→ For scalpers good buy opportunities 20 pips at a time when price goes up.

Silver Bump and Reversal?The "parabolic" Trend was broken yesterday. The longer term trend could coincide with 50% Fib retracement from the latest up move.
