Easy short? Shorting until around $44. If we hold there it may be a good spot for a buy. This is congruent with BTC chart, which is calling for a further dip into the 50s and possibly 40s.
ETF market

👀WATCHLIST: WED 03APR24Here is my watchlist of stocks I am adding today:
NASDAQ:APPF
NASDAQ:GIFI
NASDAQ:IBIT
MARKET GAUGE: 🟠CAUTION
I have been talking about softness in the market. However, if stocks are breaking out of good positions will entertain.

Silver completing massive weekly chart H&S bottomThe current thrust in Silver, with AMEX:SIVR as the proxy, has completed a massive inverted H&S on the weekly chart. It is important for Silver to consolidate these gains without providing the false breakouts this market is famous for.


XLU Potential Breakout $XLUXLU Potential Breakout Analysis
AMEX:XLU is indicating a potential breakout based on technical analysis, suggesting an opportune moment to consider exploring the utilities sector.
Why Utilities Sector?
The utilities sector is recognized for its defensive characteristics and stable performance, making it an appealing choice for investors seeking a haven during market volatility. Companies in this sector typically provide essential services such as electricity, water, and gas, which are in constant demand regardless of economic conditions.
Noteworthy Companies in the Utilities Sector:
NextEra Energy ( NYSE:NEE ): A leading clean energy company focusing on renewable power generation, transmission, and distribution. NextEra Energy's commitment to sustainability and innovation positions it as a key player in the utilities industry.
Duke Energy ( NYSE:DUK ): An electric power holding company serving millions of customers across several states. Duke Energy's established presence in the utility sector and ongoing investments in infrastructure make it a reliable choice for investors.
American Electric Power ( NASDAQ:AEP ): One of the largest electric utility companies in the United States, providing electricity to millions of customers in various states. With a strong emphasis on modernizing its grid and embracing renewable energy sources, American Electric Power is set for long-term growth.
Exploring investments in these companies within the utilities sector could offer a combination of stability and potential upside. Stay tuned to AMEX:XLU for further signals of a breakout to seize the opportunity effectively.

XLP Potential Breakout on Consumer Staples Sector $XLPXLP Potential Breakout Analysis
AMEX:XLP is showing signs of a potential breakout based on technical analysis. This could present a favorable opportunity to consider investing in the Consumer Staples sector.
Why Consumer Staples Sector?
The Consumer Staples sector is known for its stability and resilience during market fluctuations, making it an attractive option for investors looking for a defensive position. These companies produce essential goods that people need regardless of economic conditions, providing steady demand and consistent performance.
Interesting Companies in the Consumer Staples Sector:
Procter & Gamble ( NYSE:PG ): A multinational consumer goods company with a diverse portfolio of products ranging from household essentials to personal care items. Its strong brand presence and global reach make it a reliable choice for long-term investors.
Coca-Cola ( NYSE:KO ): A leading beverage company known for its iconic brands like Coca-Cola, Sprite, and Fanta. With a focus on innovation and expanding into new markets, Coca-Cola remains a solid pick in the consumer staples industry.
Colgate-Palmolive ( NYSE:CL ): A well-established company specializing in oral care, personal care, and household products. Colgate-Palmolive has a history of consistent growth and brand loyalty, making it a dependable investment option.
Investing in these companies within the Consumer Staples sector could provide a balance of stability and potential growth opportunities. Keep an eye on AMEX:XLP for further developments to capitalize on the potential breakout.

Long CommoditiesHello,
interesting setup with the commodities (ex agriculture) as EUR/USD seem to be breaking the support and potentially keep digging the hole lower.
EUR/USD and commodities seem to have a pretty decent inverse relationship - EUR/USD down, commodities UP, and vice versa.
EUR/USD retest and fail at ~1.08 could potentially be bullish for commodities. Either ways, I'm looking to add up some commodities to my portfolio this week.
Happy gold hunting!
-A.O.T

Near term peak forming?Currently while the daily short term PPMs are in trend, they look to be losing steam, which could mean that they are topping in the short term.
Take some solace from the fact that we recently had a slightly higher lows and slightly higher highs so the chance of a downward trajectory over the mid to longer term is not likely.
The weekly chart seems to agree. While we are not seeing any trend, at least there is no downside trend forming any time soon.

#GLD Newgold etf on the cusp of a massive breakoutNewGold ETF which tracks the rand price of Gold has been knocking hard on the R360.00 level. A breakout of this level should see an explosive move upwards which possibly supports the longs i am seeing in DRD and AngloGold. The break of the flat top triangle targets R386 which is an approximate move of 7% in the rand price of gold.. Good, especially for our local miners such as DRD, Harmony and Pan African #DRD #HMY #PAN

S&P Sector RotationAll major sectors are strong, confirming SPX strength. There are minor signs of weakness on some charts but nothing serious yet.

$SPYSPDR S&P 500 ETF Trust seeks to provide investment results that, before expenses, correspond generally to the price and yield performance of the S&P 500 Index. The Trust seeks to achieve its investment objective by holding a portfolio of the common stocks that are included in the index (the "Portfolio"), with the weight of each stock in the Portfolio substantially corresponding to the weight of such stock in the index.

The prospect of ZROZ doubling in a year or two is normalThe prospect of ZROZ doubling in a year or two is a historically normal process that has happened over and over again. Why would this time be any different?

TLT to $200 by EOY 2025?This is a possibility for TLT brought to you by Goodtexture who is hoping you can appreciate this artwork for its noble character and enthusiastic reprise

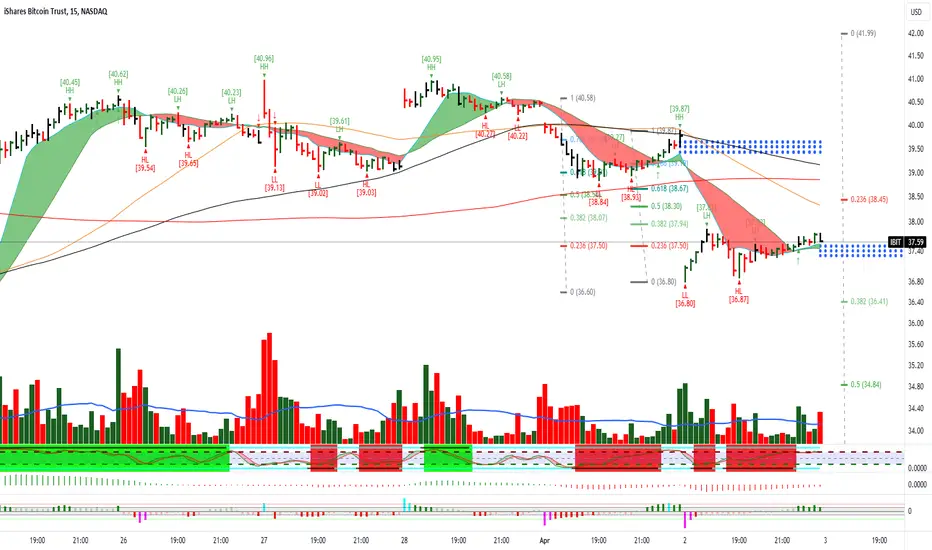
$IBIT April 3, 2024.NASDAQ:IBIT April 3, 2024.
For the rise from 28.91 to 41.99 NASDAQ:IBIT has taken support around 36.8 levels.
This is about 38.2% retracement for the rise and also 200 average support in 60 minute time frame.
Being a moving average follower I find 50,100 and 200 are all mixed up above 9 and 21 average.
Hence I expect a resistance around 38.5 levels today and support around 37 levels to be intact.
Because of gap strength comes only above 39.95 levels.
$SPY April 3, 2024AMEX:SPY April 3, 2024
Gap down. No trade for me.
15 Minutes.
Downtrend. Need to cross 523 to resume the trend at the moment.
60 Minutes.
As expected AMEX:SPY is trying to get the moving averages in position.
It took 21 EMA support yesterday.
And in 60 minutes it was 100 average support.
The last time AMEX:SPY took support at 200 averages in 60 minutes was on January 17, 2024, at 470 levels.
For the day 520 should be a good level to short.
200 average in 60 minutes is sloping upwards around 514-515 levels.
So that should offer good support this week.
Long only above 525 levels.

Sector Watch4/2/24 Sector Watch:
XLK Technology
XLE Energy
XLV Health Care
XLF Financials
XLB Materials
XLY Consumer Discretionary
XLU Utilities
XLRE Real Estate
Communication Services XLC, Consumer Staples XLP, Industrials XLI.

SPY - time to flyThe rSquared has gotten above .95 basis late october and basis early January and just today dipped slightly. This history shows is a warning for those who are long and for those who would ply the short side. This is not a time for complacency.

SPY Price Projection: Mid-2025 TargetRevealing Market Trends: Logarithmic Regression Analysis Indicates Bullish Path for SPY
In the ever-evolving realm of financial analysis, the search for reliable predictions remains ongoing. Logarithmic scale regression analysis, coupled with potent indicators, has emerged as a promising tool for discerning trends, particularly regarding assets like the SPY.
This analysis delves into the utilization of logarithmic scale regression alongside two robust indicators, offering insights into the potential trajectory of the SPY's price movement. It's essential to note that the interpretations and predictions presented are based on my analysis alone and should not be construed as financial advice. As with any market analysis, uncertainties persist, and actual outcomes may diverge from projections.
Logarithmic scale regression accounts for the exponential nature of price movements, providing a nuanced perspective on long-term trends. When combined with indicators such as moving averages or momentum oscillators, the analysis gains depth, revealing not only the direction but also the strength of the trend.
After meticulous examination of historical data and the application of analytical tools, our analysis suggests a bullish trajectory for the SPY, with a projected price nearing 620 EUR by mid-2025. This projection implies a significant uptrend from the current date, with a potential increase of approximately 20% over the specified timeframe.
However, it's crucial to approach such forecasts with caution, recognizing the inherent risks associated with financial markets. While our analysis indicates a positive outlook, market conditions can change rapidly, leading to deviations from expected trends.
In summary, logarithmic scale regression analysis, supported by robust indicators, offers valuable insights into market trends and potential price movements. While our analysis suggests a bullish sentiment for the SPY, investors should conduct thorough research and seek professional advice before making investment decisions.
Disclaimer: The analysis provided is based on personal interpretation and should not be considered financial advice. Investing in financial markets carries risks, and actual outcomes may differ. Readers are encouraged to conduct their own research and consult with financial professionals before making investment decisions.

I had a dream that it was going to be exactly like thisUm... I can't really expand on this because it came to me in a dream. It'll be wacky for sure.


SPY entered a volatile period 513-523SPY is currently exhibiting increased volatility, which could offer opportunities for traders to consider buying dips and selling peaks. The area around 513 may attract trader interest, with a corresponding risk level near 508. Upside potential is identified around 522 and 523. This period of volatility is expected to continue until the end of April 2024.

BITCOIN ETF (BITO) LONGWe should hold this support here and continue our trend for long, reaching around $36+ as targets.

QQQ top wave count wave C down has ended in wave B LOW QQQ chart posted so far we have dropped in a 3 wave decline and to .667 pullback NOT what I like to see but still it is 3 waves down This should market wave B down within the 5th wave diagonal . This should lead to a rather weak rally to just edge out the high at 449.48 and could see 451/452 still But I will not be long calls in QQQ for now . But I have moved into 40% net long spy calls this morning at 10 am up from the 10 % . Best of trades WAVETIMER watch for april 8th TURN
