Market indices

DXY - Are You Ready?📈Hello TradingView Family / Fellow Traders. This is Richard, also known as theSignalyst.
📉 DXY has been overall bullish trading within the rising channel marked in red.
Currently, it is undergoing a correction phase, and approaching the lower bound of the channel.
Moreover, it is retesting a strong demand zone highlighted in orange.
🏹 Thus, the highlighted blue circle is a strong area to look for buy setups as it is the intersection of the orange demand and lower red trendline.
📚 As per my trading style:
As #DXY is hovering around the blue circle zone, I will be looking for bullish reversal setups (like a double bottom pattern, trendline break , and so on...)
📚 Always follow your trading plan regarding entry, risk management, and trade management.
Good luck!
All Strategies Are Good; If Managed Properly!
~Rich

US30 on Support Level... Bullish!!!!!!1. US30 on support level.
2. Chances are high for long from this level.
3. once its broken below short we can expect a short un till its long.

SPX500 Is Going Down! Sell!
Take a look at our analysis for SPX500.
Time Frame: 5h
Current Trend: Bearish
Sentiment: Overbought (based on 7-period RSI)
Forecast: Bearish
The price is testing a key resistance 5,310.4.
Taking into consideration the current market trend & overbought RSI, chances will be high to see a bearish movement to the downside at least to 5,261.1 level.
P.S
The term oversold refers to a condition where an asset has traded lower in price and has the potential for a price bounce.
Overbought refers to market scenarios where the instrument is traded considerably higher than its fair value. Overvaluation is caused by market sentiments when there is positive news.
Like and subscribe and comment my ideas if you enjoy them!

EGX30 : between relative weight and geopolitical tensionsThe EGX30 index, a benchmark for the Egyptian stock market, faces a critical challenge: the concentration of its weight among a few large companies. As of May 28, 2024, the top three constituents – Commercial International Bank (CIB), Talaat Moustafa Group, and Sweden Electronics – account for a staggering 50% of the index's weight. This excessive concentration raises serious concerns about the index's overall stability and its ability to accurately reflect the broader market performance.
Addressing Weight Imbalance: A Call for Action
To address this pressing weight concentration issue, the Egyptian government must take proactive measures to encourage diversification among index constituents. This could involve supporting mergers and acquisitions among smaller companies, actively promoting the listing of new companies, and potentially adjusting the index methodology to reduce the outsized influence of individual stocks.
Political Tensions: A Lingering Shadow
Political tensions in Egypt continue to cast a long shadow over the stock market, creating an environment of uncertainty and risk. The lack of a clear resolution to these tensions weighs heavily on investor sentiment, hindering long-term investment decisions and dampening market growth prospects.
Technical Analysis: Gauging Market Direction
From a technical analysis perspective, the EGX30 index is currently facing resistance at the 27,650 level and support at the 24,235 level. This suggests that the index is likely to experience horizontal movement in the near term, with potential for breakouts in either direction depending on the resolution of the underlying factors affecting the market.

NAS100: Inside DayHi everyone and welcome to my channel, please don’t forget to support all my work subscribing and liking my post, and for any question leave me a comment, I will be more than happy to help you!
“Trade setups, not movements”
1. DAY OF THE WEEK (Failed Breakout, False Break, Range Expansion)
Monday DAY 1 Opening Range ✅ Day 3 cycle
Tuesday DAY 2 Initial Balance
Wednesday DAY 3 (reset DAY 1) Mid Point Week
Thursday DAY 2
Friday DAY 3 Closing Range
2. SIGNAL DAY
First Red Day
First Green Day ✅ (possible variation of FGD considering Thursday as a dump day)
3 Days Long Breakout
3 Days Short Breakout
Inside Day ✅
3. WEEKLY TEMPLATE
Pump&Dump ✅
Dump&Pump
Frontside ✅
Backside
4. THESIS:
Long: primary, taking in consideration the Thursday dump, there are high chances to too this market going to stop the trader short from HOW.
Short: secondly the previous LOW hasn't been completely stopped yet, the market can trap volume to retest that level, however, I'm pretty neutral with the bias, giving a little bit of more priority to the FGD (because is the most recent price action)
Please note that the purpose of my analysis is to help me and you hunting the best trade setup for the day, none of my technical aspects are a way to forecast any directional market movement.
Gianni

The trend Line showsThe Resistance is evident and so is the divergent trend line. Check the support time coinciding with the election results. Short-sell Nifty Futures on the horizon.

Dow Is Dropping - Is a Reversal imminent?Although the Dow Jones initially squandered its chance of a recovery today, prices are likely to rise soon. The performance of the index does not harmonize with the overall market sentiment. The RSI and MACD are extremely oversold. Market internals such as the VOLD also point to cautious selling interest. For these reasons, we once again see a long opportunity that offers an extraordinarily good RRR of around 6:1.

SPX Bear Diamond InboundWe have a bear diamond and many are ignoring the longer term trend line that hits the peak of the January 2000 top on the 1-3 month timeframes, Our October 1st 2021 Top and our current top around 5350-5400, this resistance has created an intraday bearish diamond pattern that's about to play out by tomorrow to sub 5,200

BANK-NIFTY TRADING LEVELS FOR 29-05-2024Explanation:
This is a very useful trading system. This means that you should not take a trade blindly, but rather that there is another confirmation to take the trade you can use this for perfect entry and perfect exit
This trading opportunity is based on volume, previous price, and price range , are included
Entry/Exit point's:
- It has very easy entry and exit points
- In this pair of lines with two colors are given (RED AND BLUE)
- In this the blue line is used to take long entry and the red line is used to take short entry (But it is all based on a more conformation from your trading plan)
Stop Loss/Take Profit:
Stop Loss
- According to this, if you take a long trade, its stop loss will be the red line just below ( A trade can exit either when the price crosses the red line or the 5 minute candlestick crosses the red line. (This can be done according to your preference) )
- A short entry should use the opposite rules to a long entry
Take Profit
-When you take a long entry according to the profit to be booked is on the next red line above. ( Or if there are other reasons, it can be a safe exit )
- Opposite rules for booking profit on long entry are to book profit on short trade. ( The blue line above is the stop loss of short entry )
Timeframe:
According to this, the time frame you should use while taking trades is 5 minutes time frames . (5 minute time frame works well in this)
Risk Disclaimer:
Trading carries significant risk and is not suitable for all traders. You may lose some or all of your capital in a matter of minutes or hours. Market conditions can change rapidly, and prices can move against you quickly. You may not always be able to exit at a favorable price, and you may be required to hold a position overnight, exposing yourself to additional risk. Day trading involves high risk, high leverage, and high stakes, and you should only trade with funds you can afford to lose. Please carefully consider your financial situation, risk tolerance, and trading objectives before engaging in day trading.
Engagement:
Share your insights, ask questions, and learn from others in the community. Whether you're a seasoned pro or just starting out, we're all in this together.
What's your take on the current market conditions? Which trading strategies are working for you? Let's discuss and help each other grow as traders!
Comment below and let's get the conversation started!
Original Content:
This trading setup is the result of my own innovation and expertise, and is not based on any publicly available information or third-party systems. It is a reflection of my dedication to developing a competitive edge in the markets.

NIFTY TRADING LEVELS FOR 29-05-2024Explanation:
This is a very useful trading system. This means that you should not take a trade blindly, but rather that there is another confirmation to take the trade you can use this for perfect entry and perfect exit
This trading opportunity is based on volume, previous price, and price range , are included
Entry/Exit point's:
- It has very easy entry and exit points
- In this pair of lines with two colors are given (RED AND BLUE)
- In this the blue line is used to take long entry and the red line is used to take short entry (But it is all based on a more conformation from your trading plan)
Stop Loss/Take Profit:
Stop Loss
- According to this, if you take a long trade, its stop loss will be the red line just below ( A trade can exit either when the price crosses the red line or the 5 minute candlestick crosses the red line. (This can be done according to your preference) )
- A short entry should use the opposite rules to a long entry
Take Profit
-When you take a long entry according to the profit to be booked is on the next red line above. ( Or if there are other reasons, it can be a safe exit )
- Opposite rules for booking profit on long entry are to book profit on short trade. ( The blue line above is the stop loss of short entry )
Timeframe:
According to this, the time frame you should use while taking trades is 5 minutes time frames . (5 minute time frame works well in this)
Risk Disclaimer:
Trading carries significant risk and is not suitable for all traders. You may lose some or all of your capital in a matter of minutes or hours. Market conditions can change rapidly, and prices can move against you quickly. You may not always be able to exit at a favorable price, and you may be required to hold a position overnight, exposing yourself to additional risk. Day trading involves high risk, high leverage, and high stakes, and you should only trade with funds you can afford to lose. Please carefully consider your financial situation, risk tolerance, and trading objectives before engaging in day trading.
Engagement:
Share your insights, ask questions, and learn from others in the community. Whether you're a seasoned pro or just starting out, we're all in this together.
What's your take on the current market conditions? Which trading strategies are working for you? Let's discuss and help each other grow as traders!
Comment below and let's get the conversation started!
Original Content:
This trading setup is the result of my own innovation and expertise, and is not based on any publicly available information or third-party systems. It is a reflection of my dedication to developing a competitive edge in the markets.
BANK-NIFTY TRADING LEVELS FOR 28-05-2024Explanation:
This is a very useful trading system. This means that you should not take a trade blindly, but rather that there is another confirmation to take the trade you can use this for perfect entry and perfect exit
This trading opportunity is based on volume, previous price, and price range , are included
Entry/Exit point's:
- It has very easy entry and exit points
- In this pair of lines with two colors are given (RED AND BLUE)
- In this the blue line is used to take long entry and the red line is used to take short entry (But it is all based on a more conformation from your trading plan)
Stop Loss/Take Profit:
Stop Loss
- According to this, if you take a long trade, its stop loss will be the red line just below ( A trade can exit either when the price crosses the red line or the 5 minute candlestick crosses the red line. (This can be done according to your preference) )
- A short entry should use the opposite rules to a long entry
Take Profit
-When you take a long entry according to the profit to be booked is on the next red line above. ( Or if there are other reasons, it can be a safe exit )
- Opposite rules for booking profit on long entry are to book profit on short trade. ( The blue line above is the stop loss of short entry )
Timeframe:
According to this, the time frame you should use while taking trades is 5 minutes time frames . (5 minute time frame works well in this)
Risk Disclaimer:
Trading carries significant risk and is not suitable for all traders. You may lose some or all of your capital in a matter of minutes or hours. Market conditions can change rapidly, and prices can move against you quickly. You may not always be able to exit at a favorable price, and you may be required to hold a position overnight, exposing yourself to additional risk. Day trading involves high risk, high leverage, and high stakes, and you should only trade with funds you can afford to lose. Please carefully consider your financial situation, risk tolerance, and trading objectives before engaging in day trading.
Engagement:
Share your insights, ask questions, and learn from others in the community. Whether you're a seasoned pro or just starting out, we're all in this together.
What's your take on the current market conditions? Which trading strategies are working for you? Let's discuss and help each other grow as traders!
Comment below and let's get the conversation started!
Original Content:
This trading setup is the result of my own innovation and expertise, and is not based on any publicly available information or third-party systems. It is a reflection of my dedication to developing a competitive edge in the markets.

Swing UpwardsThis market is getting back on it's continuous upward trend since the year 2020. Now is the best time to swing trade, invest, look for the lowest entry and continue to buy.

NASDAQ Pair : US100 - Nasdaq
Description :
Completed " 12345 " Impulsive Waves
Break of Structure
RSI - Divergence
Exp FIAT as an Corrective Pattern in Short Time Frame
Fibonacci Level - 261.8%

US 30 short - swing trade (update) As previously discussed we expect further pa to the downside and the market to hunt for the HTF sellside liquidity.
Market just traded through the sellside liquidity. Hope some of you guys managed to get onboard or at least LEARNED something form the idea.
Stay safe and never risk more than 1-5% of your capital per trade. The following analysis is merely a price action based analysis and does not constitute financial advice in any form.

Hellena | SPX500 (4H): Short to 38.2% Fibo lvl 5205.Dear colleagues, I think that the price has either already completed or is about to complete the impulsive movement in wave “1”, so I expect the beginning of correction at least to the area of 38.2% Fibonacci level 5205. It is quite possible that the price will update the high and reach the area of 5375 before starting the correction.
Manage your capital correctly and competently! Only enter trades based on reliable patterns!

BANK NIFTY INTRADAY LEVELS FOR 29 MAY 2024BUY ABOVE - 49290
SL - 49050
TARGETS - 49480,49670,49850
SELL BELOW - 49050
SL - 49290
TARGETS - 48800,48620,48460
NO TRADE ZONE - 49050 to 49290
Previous Day High - 49480
Previous Day Low - 49050
Based on price action major support & resistance's are here, the red lines acts as resistances, the green lines acts as supports. If the price breaks the support/resistance, it will move to the next support/resistance line. White lines indicates previous day high & low, high acts as a resistance & low acts as a support for next day.
Trendlines are also significant to price action. If the price is above/below the trendlines, can expect an UP/DOWN with aggressive move.
Please NOTE: this levels are for intraday trading only.
Disclaimer - All information on this page is for educational purposes only,
we are not SEBI Registered, Please consult a SEBI registered financial advisor for your financial matters before investing And taking any decision. We are not responsible for any profit/loss you made.
Request your support and engagement by liking and commenting & follow to provide encouragement
HAPPY TRADING 👍

US30 shortsWeekly;
Price has closed with a very bearish candlestick
The next liquidity zone is 38750
I expect price to head there, but there has to be some orders collected before price goes to the designated region
Daily;
Price has closed below a daily region and retested it on Friday
Price is heading towards 38750 but orders have to be collected first in the new weekly cycle
4 hour;
I believe that price will collect orders at the previous region and then sell off.
Waiting for sell confirmation

BANKNIFTY Trading Plan and Levels for 28-May-2024
After meeting the target of 48333, BANKNIFTY traded up to 49667, sustaining that level for a considerable time. However, profit booking towards the end of the session led to a close below the day's target of 49333, establishing a fresh resistance at 49634. Here's the trading plan for Tuesday:
Gap Up Opening
Scenario: If BANKNIFTY opens above 49450 and sustains.
Expectations: Prices may face rejection near 49552 and drop back for a swing correction.
Downside Targets: 49000 – 48958 and 48824.
Upside Potential: If prices sustain above 49552 and break 49634, expect a sharp move towards 49994 – 50000 – 50150.
Flat Opening
Scenario: If BANKNIFTY opens flat.
Expectations: Initial movement towards 49372 – 49426, facing potential rejection.
Downside Targets: A drop back to 49000 – 48824, from where a recovery can be expected.
Gap Down Opening
Scenario: If BANKNIFTY opens below 49000.
Expectations: Initial recovery to 49336 and 49426.
Risk: If prices fail to find support and trade below 48900, expect further downside to 48826, followed by muted direction.
Conclusion: The anticipated trading pattern involves a possible initial drop for a correction followed by a recovery. Traders should watch for key levels to confirm the trading direction and manage their positions accordingly.
Disclaimer: This analysis is based on technical indicators and past market performance. Market conditions are subject to change, and traders should use this information as part of a broader risk management strategy.

USNAS100 (More bullish ...)USNAS100 new forecast
Technical Analysis:
The price broke the resistance line was 18820,
so now it will try to reach the next resistance trend which is 18980 and above it will get 19100,
otherwise, it should break 18820 to be a bearish trend till 18730 and 18570
Pivot Line: 18,820
Resistance Levels: 18,980, 19,100, 19,210
Support Levels: 18,735, 18,550, 18,440
Today's range is expected to be between the support at 18,550 and the resistance at 19,100.

Dollar Index (DXY): Bearish Pressure Remains 💵
Looks like Dollar Index completed the correctional movement
and ready to go down again.
I see a bearish flag pattern with a confirmed violation of its support on 4H.
The market may reach 104.2 soon.
❤️Please, support my work with like, thank you!❤️

Could US30 bounce from here?Price is falling towards a support level which is an overlap support that aligns with the 61.8% Fibonacci retracement and could bounce from this level to our take profit.
Entry: 38,606.09
Why we like it:
There is an overlap support level which lines up with the 61.8% Fibonacci retracement.
Stop loss: 38,120.14
Why we like it:
There is a pullback support level which is slightly below the 78.6% Fibonacci retracement.
Take profit: 39,072.18
Why we like it:
There is an overlap resistance level which aligns with the 23.6% Fibonacci retracement.
Please be advised that the information presented on TradingView is provided to Vantage (‘Vantage Global Limited’, ‘we’) by a third-party provider (‘Everest Fortune Group’). Please be reminded that you are solely responsible for the trading decisions on your account. There is a very high degree of risk involved in trading. Any information and/or content is intended entirely for research, educational and informational purposes only and does not constitute investment or consultation advice or investment strategy. The information is not tailored to the investment needs of any specific person and therefore does not involve a consideration of any of the investment objectives, financial situation or needs of any viewer that may receive it. Kindly also note that past performance is not a reliable indicator of future results. Actual results may differ materially from those anticipated in forward-looking or past performance statements. We assume no liability as to the accuracy or completeness of any of the information and/or content provided herein and the Company cannot be held responsible for any omission, mistake nor for any loss or damage including without limitation to any loss of profit which may arise from reliance on any information supplied by Everest Fortune Group.

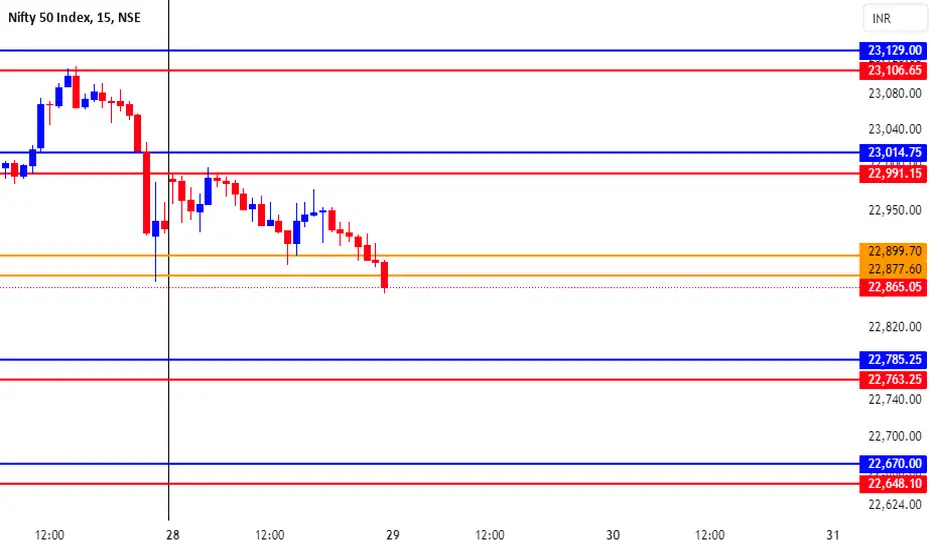
NIFTY INTRADAY LEVELS FOR 29 MAY 2024BUY ABOVE - 22950
SL - 22900
TARGETS - 23000,23100,23180
SELL BELOW - 22850
SL - 22900
TARGETS - 22780,22710,22640
NO TRADE ZONE - 22850 to 22950
Previous Day High - 23000
Previous Day Low - 22850
Based on price action major support & resistance's are here, the red lines acts as resistances, the green lines acts as supports. If the price breaks the support/resistance, it will move to the next support/resistance line. White lines indicates previous day high & low, high acts as a resistance & low acts as a support for next day.
Trendlines are also significant to price action. If the price is above/below the trendlines, can expect an UP/DOWN with aggressive move.
Please NOTE: this levels are for intraday trading only.
Disclaimer - All information on this page is for educational purposes only,
we are not SEBI Registered, Please consult a SEBI registered financial advisor for your financial matters before investing And taking any decision. We are not responsible for any profit/loss you made.
Request your support and engagement by liking and commenting & follow to provide encouragement
HAPPY TRADING 👍
