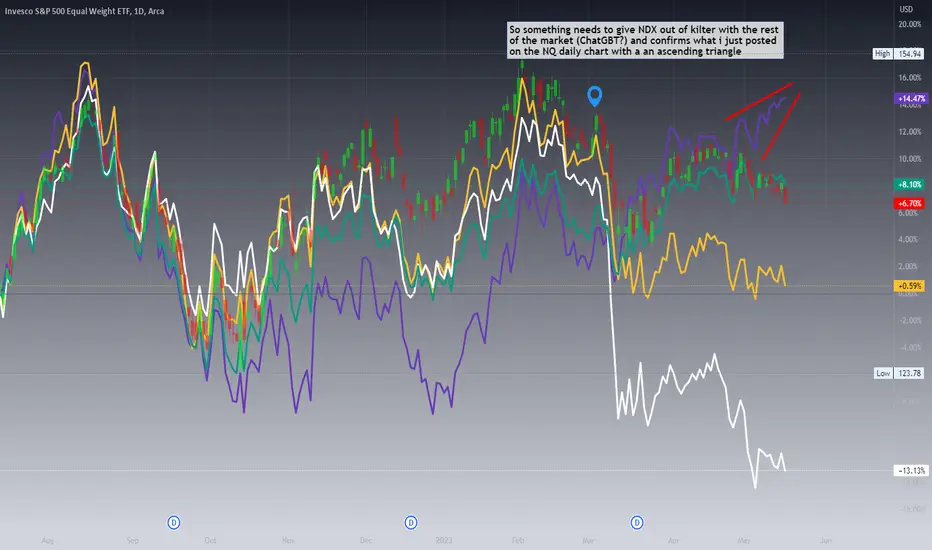
NQ topping? So something needs to give NDX out of kilter with the rest of the market (ChatGBT?) and confirm what i just posted on the NQ daily chart with an ascending triangle
RSP trade ideas
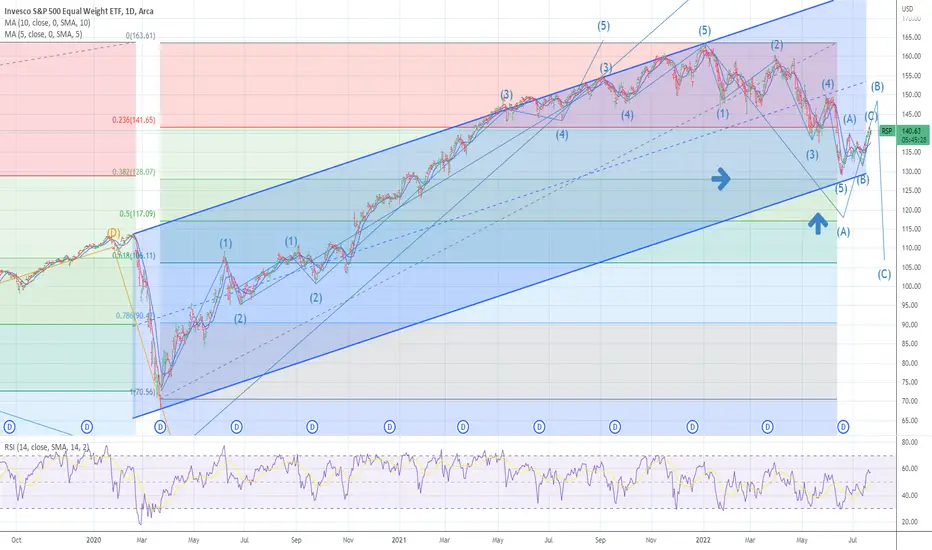
S&P Equal Weight Index (RSP Daily analysis)The volume below is very thin (yellow highlight), and the chart trend is downward and weakening. The equal weight index actually performed a little better than the weighted index during the selloff, retracing only 42% versus SPY 50% during the period of Covid low in March 2020 to all time high in January 2022.
There are three lines of potential support, all at volume points of control as well as Gann lines:
138.96, or -1.8% from 5/12 close at 141.52
135.31, or -4.4% from 5/12 close
130.2, or 8.0 % from 5/12 close
I'm inclined to believe the 8% scenario is most probable, since typical corrections (which I believe is imminent) range around 7%.

The Deflationary SpiralAll credit booms brought about by Central Bank-induced artificially low interest rates and loose lending standards end in busts. In the recessionary phase that follows the boom, credit becomes much harder to attain and many over-leveraged businesses end up going bankrupt. The recessionary phase reveals the malinvestments and unsound business decisions that were made during the economic boom. Businesses & Consumers deleverage their balance sheets either through paying down debt or through bankruptcy. As loan demand falls & credit conditions tighten, debt issuance falls, which reduces the supply of money into the economy because the vast majority of currency that enters the economy is loaned into existence. When credit growths slows and begins contracting alongside a falling money supply, inventory piles up and profits & margins fall while consumer spending falls. Businesses are then forced to sell at discounted rates to liquidate inventory in anticipation of weak future demand, which further reduces profits & margins and leads to increased unemployment and weaker levels of consumption. The “Deflationary Spiral” subsides and an economic recovery can take place once balance sheets are back to healthy levels which can support debt accumulation, capital investment recovers, and once large amounts of the “bad” debts taken on during the economic boom have been deleveraged.
US M2 Money Supply is currently down -4.2% YoY using March 2023 data, the largest monetary contraction in the USA since the Great Depression. Using data going back to 1870, every time the money supply contracted by over 1% YoY the stock market had a large correction and the economy fell into a severe & lengthy contraction with unemployment reaching at least 7%. A banking panic always accompanied those contractions as well. Commercial bank deposits are currently down around -5% YoY, the most since the Great Depression. Total commercial bank deposits didn’t even contract during the early 1990s Savings & Loan Crisis. With money supply shrinking and the majority of banks unable to pay competitive rates on deposits, deposits will continue falling and more bank failures will occur. The large amounts of unrealized losses on bank balance sheets represent another impediment to loan growth and banks have continued to raise reserves for multiple quarters in response to rising default rates.
Fed research from the Fed Bank of Saint Louis show bank lending conditions (measured by percentage of banks tightening lending conditions) are comparable to early 2008 & late 2000. Bank lending conditions are a leading indicator for unemployment. The unemployment rate currently is still below 4%, but with the Conference Board’s Leading Economic Indicators index currently at -7.2% and the bond yield curve still inverted, many reliable economic datapoints show that the economy is closer to the beginning of this business cycle downturn and debt deleveraging than the end. Yield curve inversions & Conference Board LEI’s have been some of the best leading indicators for a recession since the 1970s. Since 1968, any Conference Board LEI contraction of more than -2% YoY has never yielded a false positive in regards to a coming recession. The Credit Managers’ Index newly released data for April showed that the index for rejection of new credit applications (within the service sector) was 45.9, its lowest level since March 2009.
The US Consumer is beginning to run dry on savings. The majority of Americans are living paycheck to paycheck and consumer credit growth (which had been expanding rapidly in 2022) has slowed markedly. Total consumer credit growth has fallen about 50% YoY (using the 3 month average of data from December - February). After falling below 3.2% in the summer of 2022, the US savings rate is still low by historic standards, currently 5.1%. Announced job cuts for the month of March were 89.7K, higher than the first 3 months of the 2008 recession. US large corporate bankruptcy filings (Bankruptcies of companies with over $50M in liabilities) from Jan-April totaled 70, seven more than during the same length of time in 2008. Student loan debt payments are set to resume again this summer, which will further reduce consumer spending. US Consumer sentiment levels measured by University of Michigan hit the lowest levels ever (going back to 1952) in the summer of 2022, and they have been fluctuating around 2H 2008 & 1H 2009 levels ever since. Delinquency rates on things like automobiles, credit cards, and commercial real estate loans are soaring. Cox Automotive found 1.89% of auto loans in January were "severely delinquent" and at least 60 days behind payment, the highest rate since the data series began in 2006. In March, the percentage of subprime auto borrowers who were at least 60 days late on their bills was 5.3%, up from a seven-year low of 2.58% in May 2021 and higher than in 2009, the peak of the financial crisis, according to data from Fitch Ratings.
Retail sales are an economic metric that track consumer demand for finished goods. US real retail sales down -2.1% and EU real retail sales are -9.9%. German real retail sales for the month of march just came in at -15.8% YoY! According to Bloomberg, Global PC shipments are down close to 30% YoY & Apple computer shipments are down about 40% YoY. In the past 50 years, US Gross fixed capital formation has only gone negative in the US before and during recessions. It is now negative and there has never been a false positive. Data from the Mortgage bankers association showed a -39% YoY decline in Mortgage purchase applications, a decline to its lowest levels in over 26 years. US Building Permits are down -24% YoY. Housing Starts YoY are down -17% YoY. Existing Home Sales are down -22%. Every national housing downturn in the past 45 years has taken at least 4 years from peak to trough prices, indicating that the current housing downturn is likely to continue for at least 2-3 years.
Every FED Regional bank report on manufacturing (using a 3 month average of the data) is in a contraction. The April Philadelphia FED Manufacturing index came in at -31.3. Since 1969, Every reading under -30 was either in a recession or a few months away from one. April Richmond FED Service Sector Index registered a -23, the same number as in Nov 2008 & Feb 2009 & worse than Jan 2009 which was -20 (August and September 2008 were -10 for reference). US manufacturing production is down -.5% YoY. March 2023 ISM PMI data was also very insightful. USA ISM Manufacturing PMI (March) was 46.3, its lowest level since June 2009 (excl. H1 2020). For reference, in the 08 recession, it wasn’t until October 2008 that the ISM manufacturing PMI fell under 46.3, over 9 months into that recession. USA ISM Manufacturing New Orders (March) was 44.3, its lowest level since March 2009 (excl. January 2023 & H1 2020), USA ISM Non-Manufacturing PMI (March) came in at 51.2, its lowest level since Jan. 2010 (excl. H1 2020).
The US Stock market is trading at one of the highest Shiller PE ratios & stock market capitalization to GDP ratios in history. Present day stock market valuations are rivaled only by the Roaring 20s Bubble (1929), The Nifty-Fifty Bubble (late 1960s/early 1970s) & the 1999/2000 Dot-com Bubble. All 3 of those examples were followed by the most negative 10 year real returns in USA stock market history going back to 1913. Over 40% of businesses in the Russell2000 are unprofitable and over 1/5 of the S&P500 are zombie companies. Clearly, the stock markets as of April 2023 are still in bubble levels of overvaluation.
Looking at the data in aggregate, I believe that a recession is currently occurring. Assuming earnings fall by about 30% peak to trough, using a conservative average from the past 4 US recessions, I assume S&P annualized earnings will fall to around 155. Using a conservative valuation multiple of 14, that gives a target price of about 2,200 for the S&P500 that is likely to be hit in Q4 2023 or 2024.
Thank you for reading,
Alexander Charles Lambert

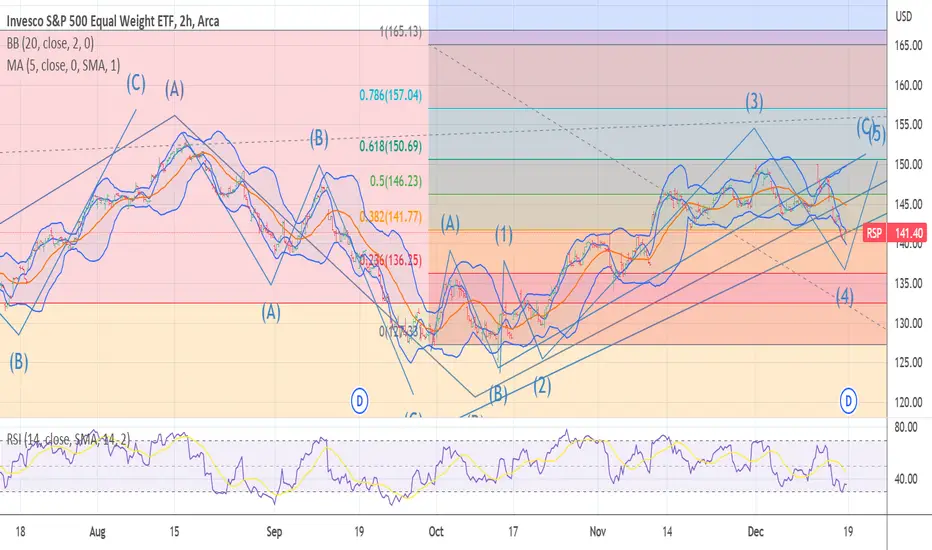
RSP second false break out?How precisely it is at the 50% level between the historical high and low since then?

RSP SP FAR SO GOOD I AM NET SHORT 50%The chart posted is that of the RSP Equal Weighted sp 500 I feel the date of jan 27 was the top in the Bull phase and a very neg phase is apond us for 5.8 to 6.1 weeks

ALT SP 500 WAVE STRUCTURE IS STILL VALID 4th wave The chart posted is the alt wave structure . there is a cycle low due 12/16 and odds favor the last grasp up into jan 3/10 . I still need time for the 2023 forecast as it is a very neg cycle I am working on the time spirals still and it take hours to back check the data back to 1902 . So for now I still feel that we are now in dec late 1973 . The cycle projection from dec forecast model was spot on for the low due 10/4 to the 20th focus on the 10th and a target of 3510/3490 . I am working on the math > I can tell everyone that 2023 will see another drop and decline with the market going from inflation to a massive deflation cycle as the chart of housing is just starting to roll over. As the 40 plus year bull market in BONDS has ended and we just are going back to mean in RATES I do not see rates ever going back to under 2/2.5 in the 10 yr and I have a view that we will see a debt implosion The final bear market low should be oct 2023 and sideways to down into oct 2024 The DEPRESSION LOW
ALL INDEXES SAME PATTERN ABC DECLINE INTO .382 AND 50 % IHAVE NOW COVERED ALL NET SHORTS .I am now moving to a net LONG AT 50 TO 75 % as of this morning . In fact TROW model told me we would see this sharp drop into cycle low due now TROW also dropped to a perfect .618 at todays low at 109.40 the low 109.18 I am net long and out of any shorts at this point BEST OF TRADES WAVETIMER I will be posting the long term update and forecast as I did in dec 22 2021 over this weekend . BEST OF TRADES WAVETIMER

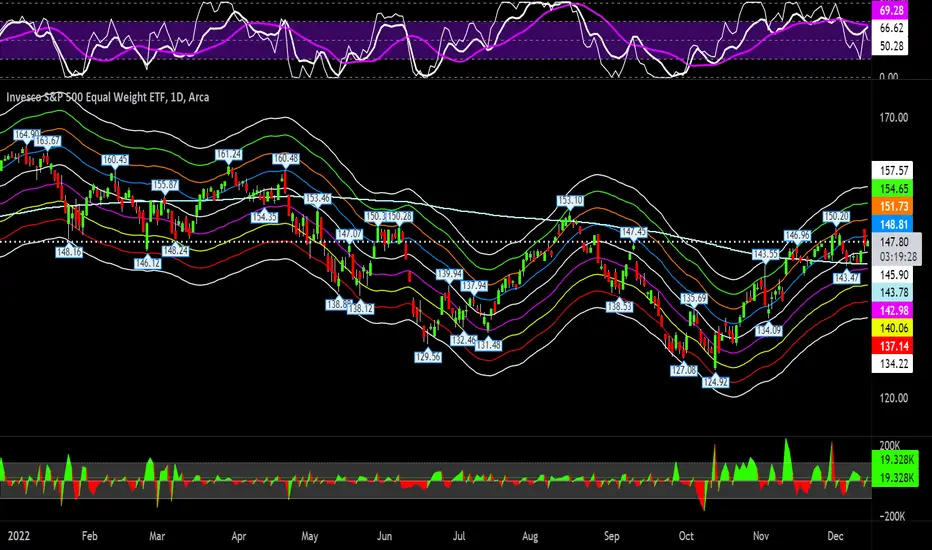
RSP levelsHere's RSP levels on the 1-day chart before today's FOMC interest rate decision at 2pm:
SMA's
SMA50 = $140
SMA100 = $141
SMA150 = $141
SMA200 = $144
SMA20 Triangular Trend Channel
top = $158
R3 = $155
R2 = $152
R1 = $149
pivot = $146
S1 = $143
S2 = $140
S3 = $137
bottom = $134
Do your own due diligence, your risk is 100% your responsibility. This is for educational and entertainment purposes only. You win some or you learn some. Consider being charitable with some of your profit to help humankind. Good luck and happy trading friends...
*3x lucky 7s of trading*
7pt Trading compass:
Price action, entry/exit
Volume average/direction
Trend, patterns, momentum
Newsworthy current events
Revenue
Earnings
Balance sheet
7 Common mistakes:
+5% portfolio trades, capital risk management
Beware of analyst's motives
Emotions & Opinions
FOMO : bad timing, the market is ruthless, be shrewd
Lack of planning & discipline
Forgetting restraint
Obdurate repetitive errors, no adaptation
7 Important tools:
Trading View app!, Brokerage UI
Accurate indicators & settings
Wide screen monitor/s
Trading log (pencil & graph paper)
Big, organized desk
Reading books, playing chess
Sorted watch-list
Checkout my indicators:
Fibonacci VIP - volume
Fibonacci MA7 - price
pi RSI - trend momentum
TTC - trend channel
AlertiT - notification
tickerTracker - MFI Oscillator
www.tradingview.com
$SPX (S&P 500) vs $RSP (S&P 500 Equal Weight) – (Net High/Low 33$SPX posted its second consecutive week of gain (+3.95%), reclaiming its 50-day moving average (declining) during the week. $SPX is currently 5.6% away from recapturing its 200-day moving average.
There is a growing belief among market participants that the Fed will soften its approach after the November meeting. The policy move from the Bank of Canada this week further fueled this notion. The Bank of Canada raised its key policy rate by 50 basis points versus an expected 75 basis points. The European Central Bank, however, delivered a 75 basis point increase for its key policy rates, as expected.
Market participants digested a slew of economic data this week that both supported and undermined the notion that the Fed will soften its approach soon. Some of the data releases included:
September PCE Prices 0.3%
The key takeaway from the report is that with continued income growth and a slightly hotter than expected Core PCE price growth, the Fed has an argument to maintain its aggressive rate hike course.
Weekly Initial Claims 217K
The key takeaway from the report is that the initial claims data suggest the labor market continues to hold up well, which of course is something that will continue to draw the Fed’s attention.
Q3 GDP-Adv. 2.6%
The key takeaway from the report is that it ends a two-quarter streak of negative GDP prints. It also suggests the economy held up well in the third quarter as it started to acclimate to rising interest rates. Real final sales of domestic product, which excludes the change in private inventories, increased a solid 3.3%.
October Consumer Confidence 102.5
The key takeaway from the report is that consumers’ concerns about inflation picked up again in October on the back of rising gas and food prices.
Falling Treasury yields were also a big support factor for the stock market rally during the week.
The support to watch for this week is revised up to 3,720 level, a beach of $SPX rising 10 & 20-day moving average.
Bull Case: Reclaim above 4,110, 200-day moving average level.
Bear Case: Breakdown of 3,720 level, beaching its rising 10 & 20-day moving average. Next support at 3,490 level.

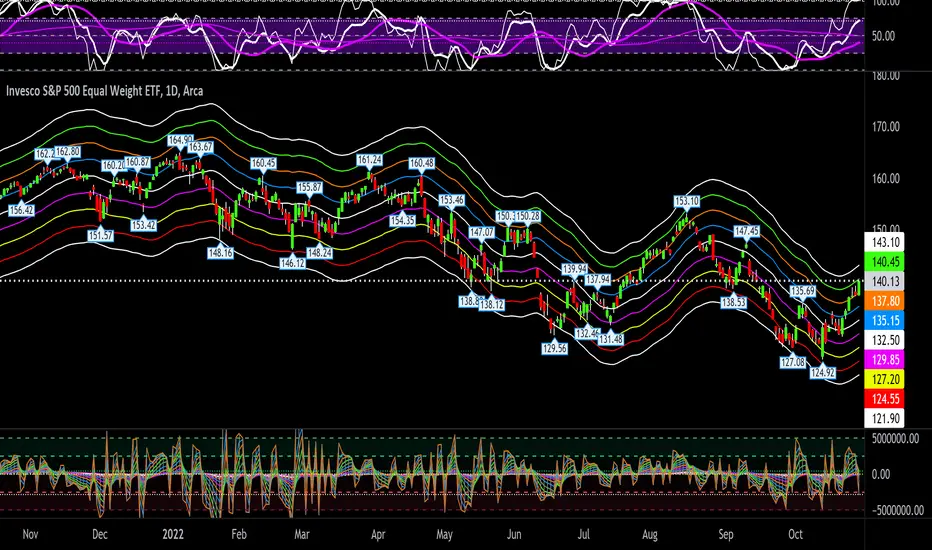
RSP levelsRSP 1 day chart levels:
SMA50 = 136.86
SMA100 = 138.58
SMA150 = 142.58
SMA200 = 145.58
SMA20 trend channel
top = 143.10
R3 = 140.45
R2 = 137.80
R1 = 135.15
pivot = 132.50
S1 = 129.85
S2 = 127.20
S3 = 124.55
bottom = 121.90
Do your own due diligence, your risk is 100% your responsibility. This is for educational and entertainment purposes only. You win some or you learn some. Consider being charitable with some of your profit to help humankind. Good luck and happy trading friends...
*3x lucky 7s of trading*
7pt Trading compass:
Price action, entry/exit
Volume average/direction
Trend, patterns, momentum
Newsworthy current events
Revenue
Earnings
Balance sheet
7 Common mistakes:
+5% portfolio trades, capital risk management
Beware of analyst's motives
Emotions & Opinions
FOMO : bad timing, the market is ruthless, be shrewd
Lack of planning & discipline
Forgetting restraint
Obdurate repetitive errors, no adaptation
7 Important tools:
Trading View app!, Brokerage UI
Accurate indicators & settings
Wide screen monitor/s
Trading log (pencil & graph paper)
Big, organized desk
Reading books, playing chess
Sorted watch-list
Checkout my indicators:
Fibonacci VIP - volume
Fibonacci MA7 - price
pi RSI - trend momentum
TTC - trend channel
AlertiT - notification
tickerTracker - MFI Oscillator
www.tradingview.com
$SPX (S&P 500) vs $RSP (S&P 500 Equal Weight)$SPX (S&P 500) vs $RSP (S&P 500 Equal Weight) – (Net High/Low +17)
The stock market came into this shortened week of trading on a three-week losing streak. It looked on Tuesday as if that streak might be extended to four weeks, but there was an abrupt turn in sentiment that powered a strong move in the major indices over the last three sessions from 3,900 support level. The losing streak was eventually broken and both the $SPX and $QQQ had reclaimed a posture back above their 50-day moving averages.
The resilience to selling efforts in the face of negative developments has fostered a sense that the market has priced in the near-term rate hikes already after enduring three, consecutive weeks of losses. At Tuesday's low, the $SPX was down 10.1% from the intraday high it saw on August 16, so there has been an added sense that the market had gotten oversold and was due for a technical bounce.
At the current juncture, the mid-term downtrend remains intact as $SPX remains trading below its declining 200-day moving average, and AVWAP from all time high.
The support to watch for this week remains at 3,900 level, the recent lowest level.
Bull Case: Reclaim above 4,212 AVWAP from all time high. Immediate resistance at declining 200-day moving average and downtrend line.
Bear Case: Breakdown of 3,900 recent low. next support at 3,800.

Breadth has been strong and this week will be critical for $RSPThe market as a whole needs this rally to have healthy breadth and so far that's what it looks like is happening, a broad-based rally.
It closed above its 200 DMA for the first time since April 21st (albeit by just 13 cents) which is also when the downtrend started. The downtrend has been thoroughly broken.
Looking for 2-3 more strong daily closes above the 200 DMA to be relatively certain that the rally will continue and we could be back in a bull market.

RSP CHANNEL AND .382 at the trendline why we have more downside is still ahead the trendline support at .382 once we break the whole system is falling apart
TOP WAVE STRUCTURE WAVE A DOWN Enjoy this picture . And REMEMBER who told you the top 2020 and low hey its the same guy who said dec2021 in the forecast for 2022 also told you to be ready and go 90% net long at the LOW . watch OCT 4 th week you have not seen anything .have a good week I did
$SPX (S&P 500) vs $RSP (S&P 500 Equal Weight) $SPX breached its 200-day moving average, as $SPX upward momentum faltered with a -1.90% plunge on Friday after National Security Advisor Jake Sullivan acknowledged there was a “distinct possibility” that Russia could invade Ukraine before the end of the Olympics.
$SPX ended the market week with a loss of -1.82%. $SPX remains resisted by a Downtrend Line coinciding with its all time high VWAP resistance.
It is worth to note further deceleration of deterioration on market technical is witnessed on US Market Net Highs/Lows, with only -65 companies for the week (comparing to -121 companies on previous week).
The immediate support to watch for $SPX this week is at 4,320 level. A breach of 4,320 level would be concerning in mid-term as it would confirm the establishment of a downtrend channel (lower highs, lower lows) on $SPX.
he large-cap indices struggled last week, as risk sentiment was pressured by increased rate-hike expectations and concerns over tensions between Russia and Ukraine. The S&P 500 fell -1.8%, the Nasdaq Composite fell -2.2%, and Dow Jones Industrial Average fell -1.0%. The Russell 2000, however, rose +1.4%.
Wednesday’s Fed minutes may provide a sense of how quickly policymakers want a rate-hike. The U.S. data calendar features January figures on producer prices, which will be closely watched after data last week showing consumer prices hit their highest in 40 years last month.
Meanwhile, earnings season is ending, but not before a last flurry of reports.
Here’s what you need to know to start your week.
1. Geopolitical tensions – Gold & Crude
Wall Street’s three main indexes closed sharply lower on Friday after the White House warned that a Russian attack on Ukraine could begin any day. While stocks got hit, prices for Treasuries, the dollar and other safe-haven assets, such as gold ($GLD) rose.
Crude prices also surged as the prospect of sanctions on Russia, a top producer, added to fears over already tight global supplies.
Some analysts believe soaring crude prices could exacerbate already high inflation, adding to pressure on the Fed to raise rates more aggressively.
2. Geopolitical tensions – Lessons from 2014
In keeping in line with history, we could draw lessons from when Russia invaded the Crimean Peninsula in 2014.
Tensions intensified over February through March in 2014 with the ensuing invasion drove a brief rally in the US 10-year Treasury note from a peak of 3.03% at the end of 2013 to about 2.58% by early February before stabilising in a 2.45%–2.6% range until June. There was a similarly mild and short-lived response in stocks and at a time of many other developments. The S&P500 sold-off by under 6% from late January through early February 2014 and then went on to rally for the remainder of the year.
Russia eventually got heavily sanctioned and the ruble eventually collapses and subsequently drives imported inflation much higher. That scenario in 2014–15 drove the Russian central bank to hike its key rate from 5.5% at the start of 2014 to a peak of 17% by the end of 2014. The Russian economy achieved no growth in 2014 and shrank by 2% in 2015.
Nevertheless, differences to 2014 include the facts that Russia’s military build-up appears to be much larger this time than in 2014 and both Europe and the US appear to be much more supportive militarily. Whether the net effect raises risk, or lowers it given a stronger counter presence is highly uncertain.
3. FOMC
With markets already pricing in a strong chance the Fed will hike rates by half a percentage point at its upcoming March meeting, Wednesday’s minutes from the Fed’s January meeting, will be scrutinized for any indications on how big a move officials are contemplating.
Last month Fed Chair Jerome Powell flagged a March lift-off and said there was “quite a bit of room” to raise interest rates without threatening the recovery in the labor market.
Last Thursday Bullard said in the light of the latest CPI reading he now wants a full percentage point of interest rate hikes over the next three Fed meetings.
On Friday, Goldman Sachs said it now expects seven quarter percentage point rate hikes this year, up from its previous forecast of five, as it updated its forecast following Thursday’s U.S. CPI data.
4. Earnings
Earnings season is drawing to a close, but this week will see a big flurry of notable reports. Airbnb Inc ($ABNB) reports on Tuesday, followed by semiconductor giant NVIDIA ($NVDA) and Cisco Systems ($CSCO), which are both due to report after the close of trade on Wednesday. Deere ($DE), the world’s largest maker of farm equipment reports Friday.
Retailer Walmart ($WMT), known for its everyday low pricing, reports Thursday, and is better positioned than other retailers to withstand rising price pressures. The pandemic has triggered inflation across the supply chain from labor to raw materials, forcing companies to pass higher prices onto consumers. However, many companies could still not fully offset the impact and that hit their profits.

The Weekly Picture: $SPX vs $RSPThe earnings season enters one of its busiest phases this week with tech giants Microsoft ($MSFT), Apple ($AAPL) and Tesla ($TSLA) are due to report. Investors will be seeking reassurance from earnings result after last week’s selloff, but market volatility looks set to continue for now.
Fed Chair Jerome Powell is expected to signal that the central bank is on course to deliver its first rate hike since 2018 in March, in a bid to tackle soaring inflation. There is also data on U.S. Q4 GDP.
Here’s what you need to know to start your week.
1. Earnings
Tech giants Microsoft ($MSFT), Apple ($AAPL) and Tesla ($TSLA) are among the big-name companies due to report in what will be a hectic week of earnings results, with investors looking to separate pandemic success stories from fundamentally strong companies.
FAANG darling Netflix ($NFLX) tumbled over 20% on Friday, weighing on the S&P 500 and the Nasdaq, after it forecast new subscriber growth in the first quarter would be less than half of analysts' predictions.
Microsoft, which reports Tuesday, is expected to report quarterly revenue of more than $50 billion for the first time, according to data compiled by FactSet.
Tesla and Apple, reporting Wednesday and Thursday respectively, are expected to post record profits according to FactSet.
Beyond tech, there are a host of other big companies reporting including 3M ($MMM), GE ($GE), IBM ($IBM), Intel ($INTC), Caterpillar ($CAT) and American Express ($AXP). Boeing ($BA), Mastercard ($MA), Visa ($V), McDonald's ($MCD), Johnson & Johnson ($JNJ), and Colgate-Palmolive ($CL) are also scheduled to report.
2. Fed to signal March rate hike
Investors are looking to the Fed for more clarity on the future path of interest rates after data last week showed U.S. inflation rising to near forty-year highs.
Jerome Powell is expected to indicate that the Fed will wind up its bond purchasing stimulus program on schedule at its March meeting and raise interest rates by a quarter point from current levels close to zero at the same meeting.
With markets already pricing in roughly four rate hikes this year investors will also be focusing on what the Fed says about its almost $9 trillion balance sheet.
Markets currently expect the Fed to start trimming the balance sheet later in the year as a way to tighten monetary policy. The minutes of the Fed’s December meeting indicated that officials held lengthy discussions about reducing bond holdings.
Any indications that the balance sheet could be shrunk faster than in the past could extend the selloff in Treasuries and tech shares.
Key Economic Calendar (Weekly)
On Thursday the U.S. is to release advance data on fourth quarter gross domestic product with economists expecting annualized growth of 5.3%. Expectations have been pared back in recent weeks as rising coronavirus cases, driven by the Omicron variant hit economic activity.
All times listed are EST
Monday
3:30: Germany – Manufacturing PMI: seen to retreat to 57.0 from 57.4.
Wednesday
14:00: US – Fed Interest Rate Decision
14:30: US – FOMC Press Conference
Thursday
8:30: US – GDP: anticipated to have more than doubled, to 5.3% from 2.3%.
Top 3 Leading and Lagging Sectors (Weekly)
1. $XLE (Energy) -0.92%
2. $XLP (Consumer Staples) -1.21%
3. $XLU (Utilities) -1.49%
Benchmark: $SPY -5.72%
1. $XLY (Consumer Discretionary) -8.62%
2. $XLF (Financial) -7.42%
3. $XLB (Materials) -6.16%
Market Breath (Weekly)
% of Stocks Above 200 DMA = 31.30% (-28.90%)
% of Stocks Above 50 DMA = 22.20% (-47.16%)
Market Technicals (Distribution Cycle Count: Day 6)
$SPX (S&P 500) vs $RSP (S&P 500 Equal Weight) – (Net High/Low -688)
Markets look set to remain turbulent in the coming week with investors focused on the Fed and earnings.
In a continuation of the tech selloff that has pushed the Nasdaq into correction territory, Wall Street’s main indexes closed sharply lower last week. The S&P 500 and the tech-heavy Nasdaq posted their largest weekly percentage declines since the start of the pandemic in March 2020. $SPX further declined -5.68%, after breaching the 4,610 support highlighted last week. $SPX is now trading below all major moving averages, the first time since March 2020. The $SPX Net High/Lows also affirmed the bearish theme with further deterioration of -688 companies within its constituents, similarly the lowest level since March 2020.
Till date, $SPX have corrected -8.73% from its high (4th January 2022). $RSP have corrected -6.81% from its high (5th January 2022).
With $RSP trading at its highest daily sessional volume on Friday (since 2004), we are likely to see a bounce off 200MA for the indexes this week, if $RSP could hold its Friday low of $152.82.
The immediate support to watch for $SPX this week is at 4,330 level, the previous major low established in $SPX during October 2021.

$SPX (S&P 500) vs $RSP (S&P 500 Equal Weight)
Market Technicals (Rally Cycle Count: Day 4 of 25)
$SPX (S&P 500) vs $RSP (S&P 500 Equal Weight) – (Net High/Low +70)
$SPX posted a solid gain of +2.28% (+105.13 points), erasing the losses experienced in the earlier week. With $SPX closing at 4,725 level, it remains below its all time high level that have tested four times over the past 8 weeks. $RSP broke out of its downtrend line with a pop on the last trading session, minimising the divergence reflected in both the indexes that was highlighted in the previous week.
With both $SPX and $RSP also breaking out of its Anchored VWAP (AVWAP) resistance at 4,640 level, below average trading volume is observed on the subsequent two trading session during the course of the week; as market activity thinned towards the Christmas Holiday.
The immediate support to watch for $SPX this week remains at 4,600 level, creating a box range support beneath the confluence of major Moving Averages (10D, 20D and 50D).

The Big Picture: Renewed pandemic fear, S&P 500, Oil demand outlThe big story on the emergence of a new strain of COVID-19 in South Africa caused Wall Street’s three main indices ($SPX, $NDX, $RUT) to tumbled on Friday as they re-opened after Thursday’s Thanksgiving holiday with energy, financial and travel-related stocks bearing the brunt of the selloff. The renewal or pandemic fear has outlined as the biggest risk to today’s market, and it is likely to inject volatility to the market for the remaining of the year.
Major indices dropped more than 2.0% on Friday, as investors sold risk assets. The $SPX fell 2.3%, the $NDX fell 2.2%, and the $DJI fell 2.5%. The $RUT 2000 underperformed with a 3.7% decline. WTI Crude Futures also fell -12.3% on Friday on worries of a supply glut.
With Equal-Weighted $RSP sitting at its 50DMA confluence with resistance turned support at $156 range, there is a significant representation of $SPX stalling its sell off for this week.
Last week’s leading sectors:
$XLU (Utilities) +3.76%
$XLP (Consumer Staples) +2.39%
$XLV (Healthcare) +0.98%
$SPX -2.20%
This week’s watchlist:
$MF, $PXD, $AA, $AMD and 55 more names.
The new variant strain may also raise doubts over how quickly the Federal Reserve can move to unwind stimulus to tackle spiraling inflation. Eyes will be turned to the US jobs report due Friday, which will probably point to a continued recovery in the labor market. Elsewhere, Federal Reserve Chair Powell testifies before Congress, while a highly anticipated OPEC+ meeting is expected to offer guidance into the coalition’s crude output plans.
Here’s what you need to know to start your week.
Market Technicals
$SPX (S&P 500) vs $RSP (S&P 500 Equal Weight)
$SPX declined -2.20% (-103.34 points). Similarly, Equal Weighted $RSP declined -2.00% (-3.19 points). As the week’s Omicron driven selloff happened on a shortened trading session on Friday, it is worth to note that the transactional volume of that shortened session have far exceeded an recent full average day’s trading volume (50D Average Volume) in all major indexes.
With $RSP sitting at its 50DMA confluence with resistance turned support at $156 range, there is a significant representation of $SPX stalling its current sell off for the week. The key index and level to watch for the week will be $RSP at $155.75 for further confirmation of market weakness.
The immediate support to watch for $SPX this week is at 4,585 level, a further break of the low of Friday’s lowest price action.
New pandemic wave?
Wall Street’s three main indices tumbled on Friday as they re-opened after Thursday’s Thanksgiving holiday with energy, financial and travel-related stocks bearing the brunt of the selloff, sparked by the discovery of the new coronavirus strain.
While little is yet known of the new variant first detected in South Africa, scientists said it has a high number of mutations that may make it vaccine-resistant and more easily transmissible than the Delta variant.
Before Friday, investors had been upbeat about the strength of the economic recovery amid broad vaccine availability and advances in treatments, despite fears over steadily rising inflation.
Jobs report
A robust November jobs report could underline the case for the Fed to speed up unwinding its $120 billion-a-month stimulus program at its next meeting in mid-December. But a fresh wave of the pandemic could throw those plans into doubt.
Concerns over spiraling inflation, coupled with signs of an accelerating economic recovery had prompted investors to begin pricing in a faster taper and earlier interest rate hikes.
Friday’s non-farm payrolls report for November is expected to show that the economy added 550,000 jobs, bringing the unemployment rate down slightly to 4.5%.
Powell and Yellen testimony
Fed Chairman Jerome Powell, fresh from his nomination for a second term by President Joe Biden, is due to testify on the CARES Act, the central bank’s pandemic-era stimulus program, before the Senate Banking Committee in Washington on Tuesday. Treasury Secretary Janet Yellen is also due to testify.
A similar hearing will be held before the House Financial Committee on Wednesday.
Investors will be looking for fresh insights on the outlook for the economic recovery amid renewed pandemic uncertainty.
Oil demand outlook
Oil prices plunged $10 a barrel on Friday, their largest one-day decline since April 2020, as news of the new Omicron variant saw countries rush to restrict travel, adding to concerns that a supply glut could swell in the first quarter.
The Organization of the Petroleum Exporting Countries and its allies (OPEC+) is due to meet on Thursday, after last week’s decision by the U.S. and other governments to release oil from strategic reserves in a bid to lower gasoline prices.
For its part, OPEC+ has stuck to monthly output increases of 400,000 barrels per day (bpd) since August, despite calls to increase output to drive down oil prices.

US Market Technicals Ahead (15 November – 19 November 2021)As U.S. inflation has surged to the highest level in over thirty years, inflation is likely to remain in focus in the coming week with investors looking ahead to the latest U.S. monthly retail sales figures along with earnings results from major retailers, including $WMT (Walmart).
With $SPX (S&P 500) erasing its weekly losses from Friday’s late week rally, the bearish Rising Wedge formation of $RSP (S&P 500 equal weight) remains in play. Attention has being turned towards small-cap companies after a nine month consolidation breakout on $IWM (Russell 2000), setting a potential new leg of multi month long market rally leading by this companies. It is worth to note that $GLD (Gold) have also broken out of a multi month long trendline resistance, gaining +2.71% as the leading asset class of the week.
China will provide an update on the economic recovery via industrial production and retail sales and wide there are expectation for a slowdown in its economic recovery, just as Europe is experiencing a fresh surge in Covid-19 infections.
Here’s what you need to know to start your week.
Market Technicals
$SPX (S&P 500) vs $RSP (S&P 500 Equal Weight)
The benchmark index $SPX retraced with a weekly loss of -0.31% (-14.68 points) confirming last week’s highlight on the over-extension of this rally which was 200% ATR away from its short term moving average, the first time since September 2020. With $SPX reducing its intraweek losses with Friday’s +0.72% gain, it is worth to note that $RSP (S&P 500 Equal Weight) has yet to break its Bearish Wedge Formation, which was has already played out in $SPX. The upwards consolidation of $RSP may be reflecting signs of fatigue, signaling downside potential of $SPX in near term.
The immediate support to watch for $SPX this week is at 4,645 level, a break of its short term pivotal level.
U.S. retail sales
The highlight of the week’s economic calendar will be October retail sales data, due out on Tuesday, with economists expecting an increase of 1.1%, after a 0.7% rise in September.
U.S. inflation has surged to the highest level in over thirty years amid a global supply chain crunch and data on Friday showed that consumer sentiment fell to its lowest in a decade this month, as higher prices eroded living standards.
Investors are betting that the Federal Reserve will have to raise interest rates sooner than currently indicated to stop inflation spiraling upward.
Retail earnings
Third quarter earnings season is continuing to wind down, but investors will get an additional update on the strength of consumer spending this week with results from major retailers, including Home Depot ($HD), Walmart ($WMT), Target ($TGT), and Macy’s ($M).
The earnings reports will face extra scrutiny ahead of the start of the holiday shopping season, with investors looking at guidance from retailers to determine whether inflation will eat into profits or be passed on to consumers.
Third quarter earnings season has largely been upbeat. 459 of the companies in the S&P 500 have reported with 80% of earnings results beating analysts’ forecasts.
China slowdown
The recovery in the world’s number two economy is weakening and data on Monday, which includes reports on retail sales, fixed asset investment and industrial production is expected to confirm this. The loss of momentum in China, a key driver of global growth, is casting a shadow over the uneven global economic recovery from the pandemic.
The recovery in China has been hit by an aggressive approach to containing Covid-19 outbreaks, a massive debt crisis in the country’s real estate sector and an energy crunch that has weighed on manufacturing activity.
Analysts think the country’s central bank is likely to take a cautious approach to loosening monetary policy to bolster the economy as slowing growth combined with soaring inflation fuel concerns over stagflation.
Meanwhile, U.S. President Joe Biden is to hold a virtual meeting with Chinese leader Xi Jinping on Monday, amid rising tensions between the world’s two largest economies.
Pandemic resurgence hits Europe
Europe is seeing a resurgence of the Covid-19 pandemic, adding to headwinds for the region’s already fragile economic recovery.
Europe accounts for more than half of the average 7-day infections globally and about half of latest deaths, according to data compiled by Reuters, the highest levels since April last year when the virus was at its initial peak in Italy.
Several countries, including the Netherlands, Germany, Austria and the Czech Republic are implementing restrictions or planning fresh measures to slow the spread.
Holland entered a three-week partial lockdown on Saturday, the first in Western Europe since the summer. Germany reintroduced free Covid-19 tests on Saturday and Austria is to decide on Sunday whether to impose a lockdown on people who are not vaccinated.

Found one more reason for a breakthrough to the top of the SNP50RSP-"Equally Weighted S & P-500" ETF. Unlike the well-known SPY, where companies are weighted by capitalization, all 500 companies are included in RSP with an equal weight of 0.2%. This makes it much less dependent on the behavior of giants like the Amazon.If the next week the RSP price breaks through the 151.86-152.43 zone and consolidates above this zone. Chances are we'll see a Christmas rally in the stock market

A seasonal sector-switching strategy has beaten the S&P YTDThe Study
I ran an analysis on monthly stock-market returns over the last 20 years or so, to determine which sector delivered the best median dividend-adjusted returns in each month. December 2020 was the last month included in the study.
The sector funds included in the analysis were all equal-weighted, although they don't all use identical methodologies or have identical expense ratios, so keep that in mind. Also, for some funds, there was more data than for others. Some have been around since 2005, some 2007, some 2012. Here are the funds I included: EWRE, RCD, RGI, RTM, RYE, RYF, RHS, RYH, RYU, XAR, XBI, XHB, XME, XTL, XTN, XSW, XSD.
The limitations of the data mean that the results are probably pretty noisy. I've got no real way to determine the statistical significance of these results, because there's just not enough data. A lot of this will be "noise," but probably there's some "signal" here too.
Basically I compared these sector funds' median return in each month and determined which fund gave the best median return. (The median should be a more robust statistical summary than the mean, because the mean will be affected by outliers like meltups and crashes.)
The Results
Here are the best-performing sectors by month:
January: Biotech
February: Aerospace
March: Real Estate
April: Energy
May: Semiconductors
June: Real Estate
July: Semiconductors
August: Semiconductors
September: Materials
October: Transportation
November: Transportation
December: Metals
The Backtest
Since I didn't use data from 2021 to generate these results, we can backtest a sector-switching strategy on 2021. What if, in each month, we switched to the sector with the best median return for that month?
The answer is that the equal-weighted index returned about 18% YTD, whereas the sector-switching strategy returned about 21%. So there's a slight edge here, but not a large one. If you're trading in a tax-deferred IRA, you'd have come out ahead by using the sector-switching strategy. But if your account isn't tax-deferred, then this strategy will have cost you more in capital gains taxes than you're making in excess returns vs. simply holding the index.
The Code
I've put the R code for this analysis on Github, should anyone wish to check my work: github.com

$RSP - Equal Weighted S&P LongI think this looks like the beginning of a new range. I would also expect it to slow (following the extreme capitulation that precedes the current bull flag). Definitely keeping a close eye on $RSP #spacewalk

