ETHUSD trade ideas

ETH weekly flag breakoutafter retrace for weeks. finally see a weekly bullish Price Action.
with flag formation BO price projection, next resistance at $5000.

Ethereum breaking higher now Intraday Update: Ethereum has broken higher after a multi day consolidation under the 78% retracement. The break higher should put the **% retracement in view at 3964.

Buy the Rumor, Sell the News?? - Ethereum ETF ThoughtsWhy isn't ETH pumping right now? Here are some possible reasons:
No capital inflow: The ETFs haven't started yet, so there's no fresh capital inflow.
Early buyers: Since the SEC decision earlier this week, many have already bought what they wanted.
Regulatory hurdles: Only the 19b-4 filings were approved today, not the S-1 forms. In contrast, the Bitcoin ETF approval had the S-1 forms ready, allowing for a quick trading start.
Delegated authority: The approval by "delegated authority" could still be challenged within the next 10 days.
A comparison with the BTC ETF launch:
Price increase Q3 last year: Much of it due to speculation that a spot BTC ETF was imminent.
Market volatility from Cointelegraph post: Notorious events like the Cointelegraph posts on October 15 caused significant market volatility.
Serious discussions in January: Suddenly, it became likely that the ETF would be approved that month.
BTC ETF approval: The SEC approved the BTC ETF on Wednesday, January 10.
Immediate +5% pump: An immediate +5% pump, followed by a significant selloff that lasted almost 2 weeks and severely impacted the market.
Recovery and new ATH: BTC recovered around 39k and almost doubled to a new all-time high.
Possibility for Ethereum:
Buy the Rumor: Massive price increases in anticipation of the event.
Sell the News: Market downturn as the event is already priced in.
Delayed Fuse: Long-term bullishness is processed by the market over a longer period.
Summary and Conclusion: While the exact behavior of the market is not 100% sure, historical patterns show that such events often follow predictable cycles. The "Buy the Rumor" phase leads to significant price increases, followed by a "Sell the News" reaction once the event occurs. Long-term, a "Delayed Fuse" phase may occur, where the market processes the long-term positive impacts of the event. The Ethereum ETF could play a crucial role in establishing Ethereum as a significant asset in the long term. With increasing acceptance and institutional interest, we could see sustainable price increases and broader adoption of Ethereum-based applications. The potential for DeFi (Decentralized Finance) and smart contracts could be further promoted by the ETF.

ETHUSD Will Go Lower From Resistance! Sell!
Please, check our technical outlook for ETHUSD.
Time Frame: 1D
Current Trend: Bearish
Sentiment: Overbought (based on 7-period RSI)
Forecast: Bearish
The market is approaching a significant resistance area 3,752.5.
Due to the fact that we see a positive bearish reaction from the underlined area, I strongly believe that sellers will manage to push the price all the way down to 3,510.9 level.
P.S
Overbought describes a period of time where there has been a significant and consistent upward move in price over a period of time without much pullback.
Like and subscribe and comment my ideas if you enjoy them!

ETHUSD bullish movement is about to happen!!!Hi.
BINANCE:ETHUSDT
Today, I want to analyze ETH for you in a 12H time frame so that we can have a MID-term view of ETH regarding the technical analysis. (Please ✌️respectfully✌️share if you have a different opinion from me or other analysts).
➡️ETH has done a Impressive Movement recently but the odds of another bullish Movement is Pretty high because the pattern which ETH is in, Is a Bullish Flag Pattern! Since The break out has not happened, there is no confirmation of a Bullish Movement But If It happens, we Can Expect a Bullish Movement as much as the Measured Price movement (flag pole) to happen!
✅ Due to the Ascending structure of the chart...
🟢 ETH has been Bullish Recently!
🟢REEGULAR BULLISH Divergence
🟢ETH is in a Bullish Flag
🟢(AB=CD)
🟢Price is gonna Reach $4100
✨Targets are:
🎯$3390
🎯$3500
🎯$3750
🎯$4100
Stay awesome my friends.
_ _ _ _ _ _ _ _ _ _ _ _ _ _ _ _ _ _ _ _ _ _ _ _ _ _ _ _ _ _ _ _ _
✅Thank you, and for more ideas, hit ❤️Like❤️ and 🌟Follow🌟!
⚠️Things can change...
The markets are always changing and even with all these signals, the market changes tend to be strong and fast!!

ETH IS IT POSSIBLE?I see lot of greeds around ETH, and i think we can see something similar as the BTC ETF event. A shakeout and a drop can likely happen, and it would be a gift if the price can drop till $3.300, a level that looks solid for a possible bounce. Main trend is bullish and actually there are no reason to look for a short

ETHEREUM, 1 day ahead of ETF Since Monday, ETH has risen by a spectacular 25%!
On Tuesday, we recovered a key zone: the $3730 level, where a great deal of liquidity was present.
We are now 1 day away from the potential approval of the Ethereum ETF (May 23, 2024).
It is therefore very difficult, if not impossible, to position oneself on the market, even if the direction seems to be taking shape.
So I'm going to remain a spectator on ETH while waiting for the results.
If the ETF is approved, I expect a correction over the next few days.
“Buy the rumour, sell the news”.
Feel free to subscribe and boost this post if you enjoyed my analysis, and tell me what you think!
Happy trading and a great week :)

ETH pullback? Eth appears to be at resistance and also I’m seeing some unusual amounts of eth being transferred to exchanges. Personally looking for price to move towards 2100-2500.
THIS IS NOT FINANCIAL ADVICE

ETH updateAt this moment and in given time frame Target is 4020.
Overall - All time High is on the way!
Good Luck!

$ETH retest of low $2ks before higher?While Ethereum looks bullish over the longer term, price would need to break above the two lines of resistance for the chart to stay bullish.
If price rejects here, we risk a double top which would send price back to the low $2000s.
I'm leaning towards a rejection as the base case here as sentiment is pretty extreme to the bullish side.
Let's see what happens over the coming weeks.

Triangle Pattern Breakout & Wolf Wave TargetIn Ethereum Triangle Pattern formed & Breakout. To achieve the Wolf Wave Target (Target 1).
I want to help people Make Profit all over the World throughout my entire life. Additionally, I am eager to Receive Money form Worldwide because of my Potential.

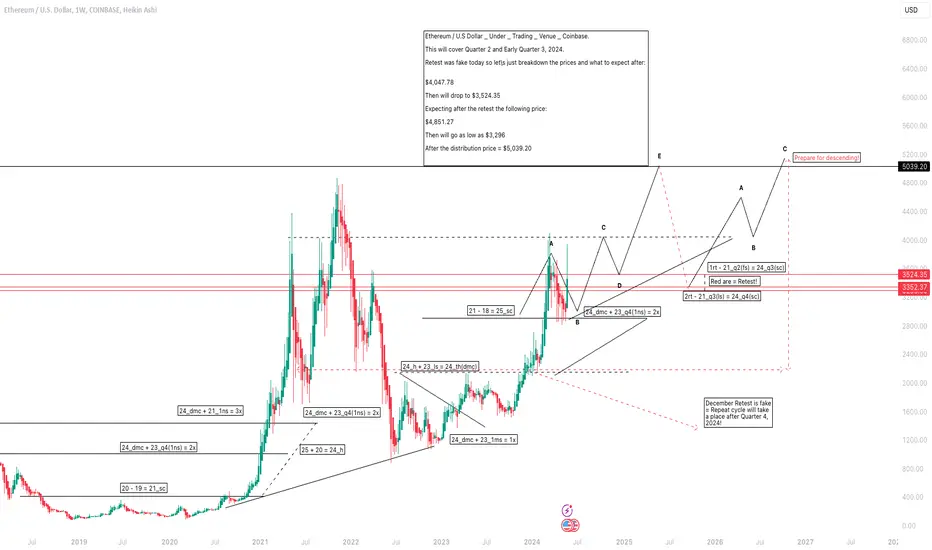
Ethereum / U.S Dollar _ Under _ Trading _ Venue _ Coinbase.Ethereum / U.S Dollar _ Under _ Trading _ Venue _ Coinbase.
You're unsure when and why and how far can go and where will be the lowest and the highest!
I will break it down as they follow numbers so there will be no if and when!
This will cover Quarter 2 and Early Quarter 3, 2024.
Retest was fake today so let\s just breakdown the prices and what to expect after:
$4,047.78
Then will drop to $3,524.35
Expecting after the retest the following price:
$4,851.27
Then will go as low as $3,296
After the distribution price = $5,039.20
ETHUSD. Short-termShort-term targets are at $4168, if we see a price drop to $3517, the low of wave 4, this forecast will change. More discussions on cryptocurrencies in the closed channel.

ETH. Weekly trading levels 20 - 26.05.2024During the week you can trade from these price levels. Finding the entry point into a transaction and its support is up to you, depending on your trading style and the development of the situation. Zones show preferred price ranges WHERE to look for an entry point into a trade.
If you expect any medium-term price movements, then most likely they will start from one of the zones.
Levels are valid for a week, the date is in the title. Next week I will adjust the levels based on new data and publish a new post.
! Please note that brokers have a difference in quotes, take this into account when trading.
The history of level development can be seen in my previous posts. They cannot be edited or deleted. Everything is fair. :)
----------------------------------------------
I don’t play guess the direction (that’s why there are no directional arrows), but zones (levels) are used for trading. We wait for the zone to approach, watch the reaction, and enter the trade.
Levels are drawn based on volumes and data from the CME. They are used as areas of interest for trading. Traded as classic support/resistance levels. We see the reaction to the rebound, we trade the rebound. We see a breakout and continue to trade on a rollback to the level. The worst option is if we revolve around the zone in a flat.
Do not reverse the market at every level; if there is a trend movement, consider it as an opportunity to continue the movement. Until the price has drawn a reversal pattern.
Don't forget to like Rocket and Subscribe!!! Feedback is very important to me!

ETH GARTLEY 2500 INCOMINGHere is an epic "potential" eth Gartley. Aiming for a late June/July bottom

ETH: Bearish – BAT Detected + ROC DivergenceETH: Bearish – BAT Detected + ROC Divergence
The Wolf of Zurich detected a bearish “BAT” on Ethereum
We could therefore go up to around 3 270 3560
Then go back down to point C around the polarity zone of 1800-2035
The 50 and 200 exponential moving averages are still potential targets
In addition you will notice a divergence in the ROC between the price which is rising and the ROC which is flat
The ROC (Rate of change) gives you the speed of the asset's momentum.
Stay safe

Ethereum will give you a Ferrari in the futureIn the big picture, extremely BULLISH!!!!!!
!In a small picture!:
MACD crossing down is very likely.
Because macd has failed crossing, which makes the next crossing more realistic.
Crossing down means BUY when the price is in red and there is no sign of green. Support points or resistances are required
Under 3000k soon. The landing level is not known today, only time will tell.
I could be wrong, but I could be absolutely right
MoralDisciple

Ethereum 15k+- i am far to be Elliot Wave expert and to be honest i am not a fan.
- there's a lack of precision and EW can be extended.
- Don't forget that the real name is " Elliot Wave THEORY ".
- included a Fibo Analysis + Trend Analysis + famous bubbles.
"The Elliott Wave Theory is a form of technical analysis that looks for recurrent long-term price patterns related to persistent changes in investor sentiment and psychology. The theory identifies impulse waves that set up a pattern and corrective waves that oppose the larger trend ".
- Everything is in graphic as always.
Happy Trading !

ETHEREUM - BULLISH MOVE 🚀Hi Traders !
The ETHEREUM Price Failed To Break The Support Level (2921.76 - 2868.32).
Currently, The Resistance Line is Broken !
So, I Expect a Bullish Move📈
--------------
TARGET: 3135.00🎯

Potential bullish bounce off 50% Fibonacci support?ETH/USD is falling towards a support level which is a pullback support that aligns with the 50% Fibonacci retracement and could bounce from this level to our take profit.
Entry: 3,035.12
Why we like it:
There is a pullback support level that lines up with the 50% Fibonacci retracement.
Stop loss: 2,926.40
Why we like it:
There is a pullback support level.
Take profit: 3,196.54
Why we like it:
There is a pullback resistance level.
Please be advised that the information presented on TradingView is provided to Vantage (‘Vantage Global Limited’, ‘we’) by a third-party provider (‘Everest Fortune Group’). Please be reminded that you are solely responsible for the trading decisions on your account. There is a very high degree of risk involved in trading. Any information and/or content is intended entirely for research, educational and informational purposes only and does not constitute investment or consultation advice or investment strategy. The information is not tailored to the investment needs of any specific person and therefore does not involve a consideration of any of the investment objectives, financial situation or needs of any viewer that may receive it. Kindly also note that past performance is not a reliable indicator of future results. Actual results may differ materially from those anticipated in forward-looking or past performance statements. We assume no liability as to the accuracy or completeness of any of the information and/or content provided herein and the Company cannot be held responsible for any omission, mistake nor for any loss or damage including without limitation to any loss of profit which may arise from reliance on any information supplied by Everest Fortune Group.

ETHEREUM ETF Can SEND $ETH to $7300The Bitcoin etf
Basically doubled the price of #BTC
from the lows post etf trading to our recent peak in March
A similar outcome and performance for Ethereum
Would send #ETH to the 1.618 Fib extension
This would be epic for altcoins, memecoins and DEFI
what do you think
do you agree?

Ethereum- Nice bullish chart structure indicates 5kLike BITSTAMP:BTCUSD and much of the crypto market, COINBASE:ETHUSD is also in a strong uptrend.
A correction began in March and concluded at the beginning of May.
After breaking out of the corrective falling wedge, the price rose again to the 4k zone, with a high likelihood of breaking above this important level at this moment
If this occurs, I expect Ethereum to reach a new all-time high around 5k or even higher.
I remain bullish as long as the price stays above 3.5k.
