SILVER (XAG/USD): One More Bullish Wave is Coming?!⚠️ SILVER appears to be confined within a horizontal range, as observed on the 4-hour chart. The price is currently nearing the upper limit of this range.
Given the prevailing strong bullish trend, there is a considerable likelihood of a continued upward movement.
A breakout and a 4-hour candle cl

The best trades require research, then commitment.
Get started for free$0 forever, no credit card needed

Scott "Kidd" PoteetThe unlikely astronaut

Where the world does markets
Join 100 million traders and investors taking the future into their own hands.
Major indices

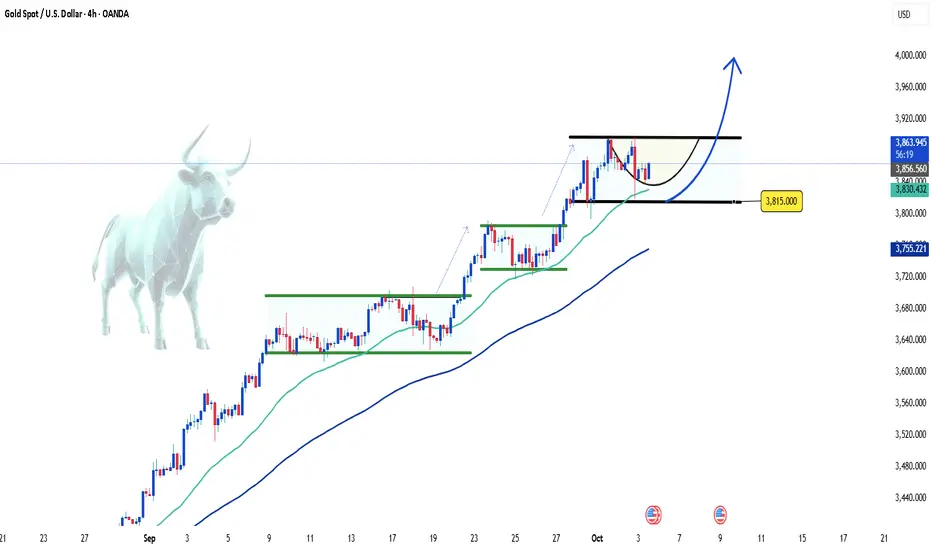
Gold Continues to Challenge Record Resistance Levels👋Hello everyone, what are your thoughts on OANDA:XAUUSD ?
As of this writing, gold continues its upward momentum, having reached new highs as investors increase their bets on the Federal Reserve cutting interest rates in the near future. The concerns over the U.S. government shutdown and global e
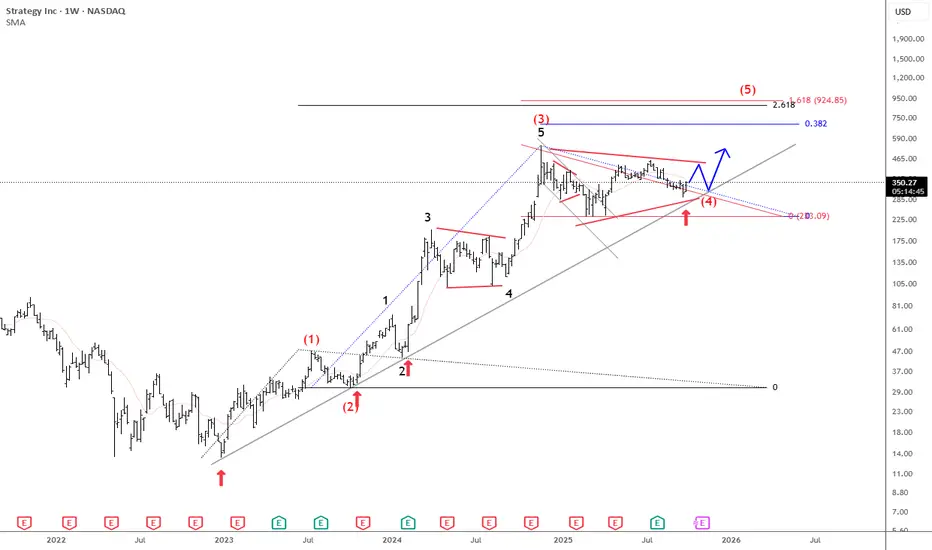
Microstrategy Is Still Pointing Higher For The Final 5th WaveMicrostrategy is a US business intelligence and software company, but it has become best known for its aggressive Bitcoin strategy. Under co-founder Michael Saylor, the company shifted from focusing mainly on software to also using Bitcoin as its primary treasury reserve asset.
Since 2020, MicroStra
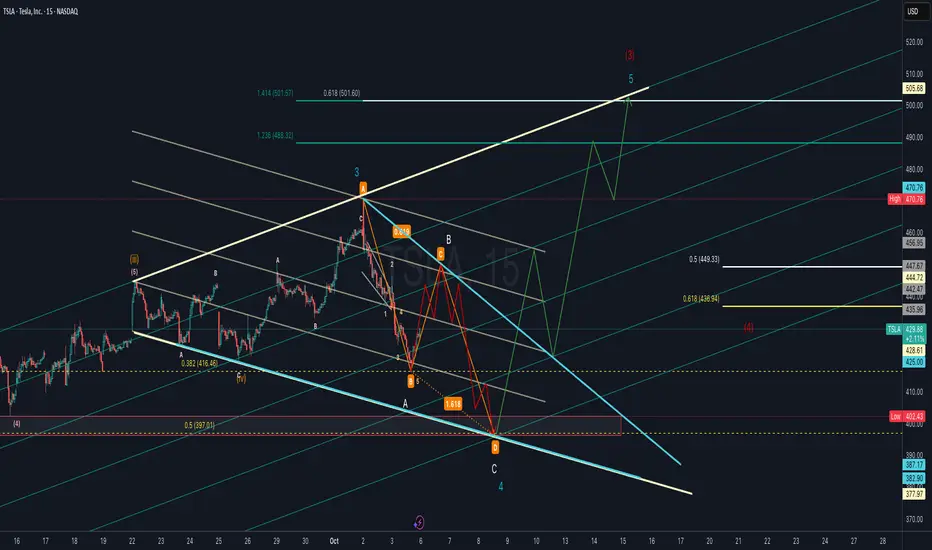
TSLA Elliott Wave Count with ABC Harmonic or Flat Corrective Tesla (TSLA) is forming a potential Wave 4 correction that aligns with an ABC harmonic structure. Price action suggests a possible deeper retracement into the 0.5–0.618 Fibonacci support zone (436–449 area) before resuming its larger uptrend.
If Wave 4 completes near the harmonic “D” zone (highligh
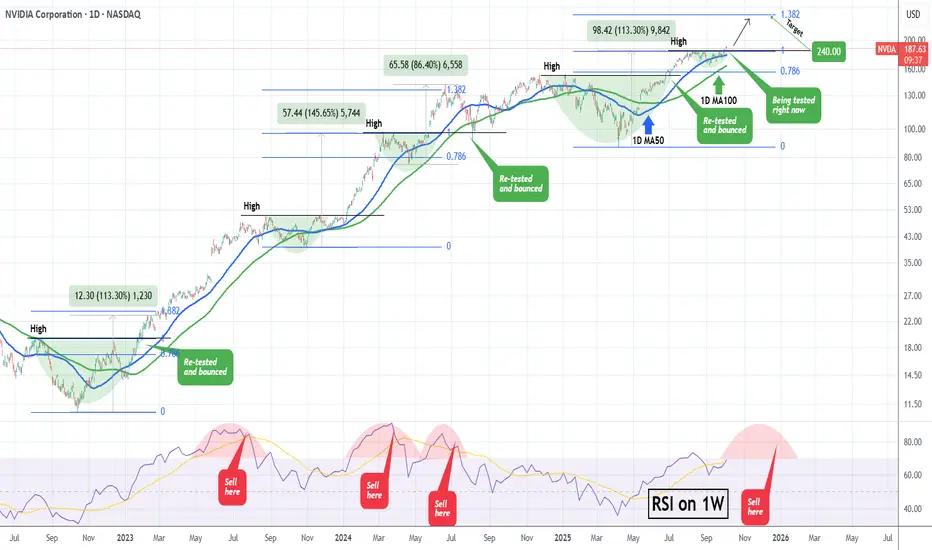
NVDA Ready for Takeoff: $200 Target in Sight!
Based on the daily chart of NVIDIA (NVDA) on NASDAQ, here’s a breakdown:
🔎 Technical Analysis
Overall Trend
The stock is in a strong uptrend (rallying from around $120 to the current $186).
Higher lows are forming, and price is pressing against the 185–187 resistance zone, showing strong buying

Why Gen X Struggles with Crypto?Why does Gen X struggle with crypto?
Because they’re used to the stock market system, where ownership is recorded by a central registry and trades that are tied to a specific exchange.
In their world, you typically should buy through Nasdaq in this example and expect to sell through Nasdaq. But w

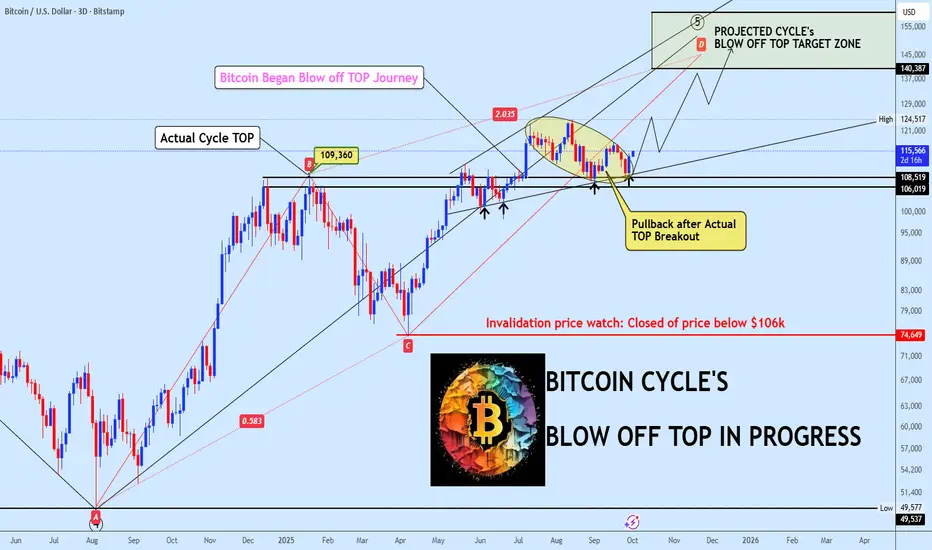
BTC ULTIMATUM: True Top Reached, Blow-Off Phase About to ExplodeHey everyone,
Let's cut through the noise. The market is flooded with conflicting signals about a potential market top, but the data on the chart is telling a crystal clear story. Many are getting this cycle wrong, so pay close attention.
Here's the truth: The Actual Cycle TOP was established back
BMNR Technical Outlook: A Textbook PlayStructure and Pattern Recognition
BMNR has developed a constructive base while holding its broader uptrend structure. The chart highlights the potential formation of a double bottom reversal, a classical pattern that often signals the exhaustion of selling pressure and a shift toward accumulation.

Gold Tops $3,800 to New Record as Traders Wonder: Short or Long?Gold OANDA:XAUUSD is back in the spotlight, flashing new record highs in bold efforts to reclaim its throne as the ultimate “don’t panic” asset.
The yellow metal hit a record high of $3,820 per ounce early Monday morning before cooling slightly to hover near $3,810. That’s up more than 47% year

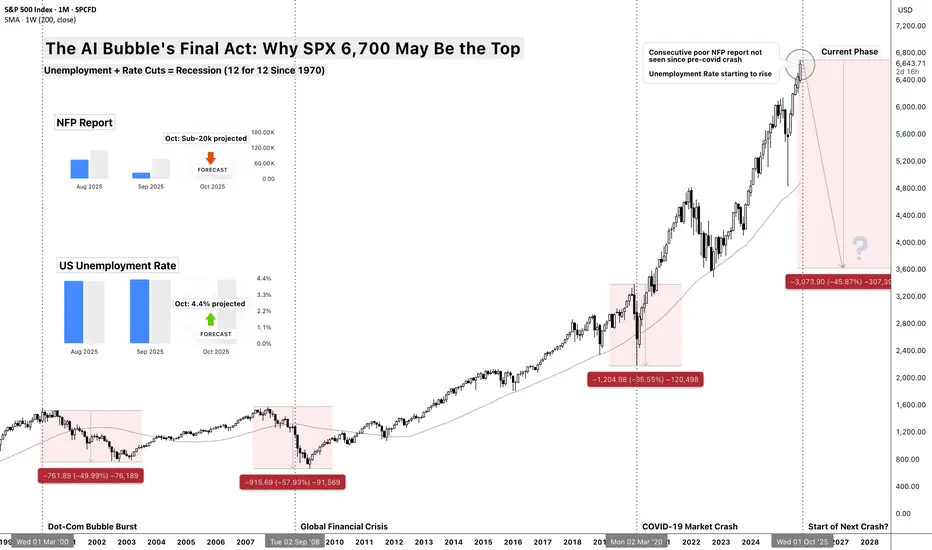
The AI Bubble's Final Act: Why $SP:SPX 6,700 May Be the TopThe AI Bubble's Final Act: Why SP:SPX 6,700 May Be the Top
Unemployment + Rate Cuts = Recession (12 for 12 Since 1970)
The Death Cross Pattern
There's a simple rule that's worked for 55 years: When the Fed cuts rates while unemployment is rising from cycle lows, recession follows within 12 m
See all editors' picks ideas
PongExperience PONG! The classic arcade game, now on your charts!
With this indicator, you can finally achieve your lifelong dream of beating the Markets. . . at PONG!
Pong is jam-packed with features! Such as:
2 Paddles
A moving dot
Floating numbers
The idea of a net
This indicator is solel

Options Max Pain Calculator [BackQuant]Options Max Pain Calculator
A visualization tool that models option expiry dynamics by calculating "max pain" levels, displaying synthetic open interest curves, gamma exposure profiles, and pin-risk zones to help identify where market makers have the least payout exposure.
What is Max Pain?
Max

Volume Profile 3D (Zeiierman)█ Overview
Volume Profile 3D (Zeiierman) is a next-generation volume profile that renders market participation as a 3D-style profile directly on your chart. Instead of flat histograms, you get a depth-aware profile with parallax, gradient transparency, and bull/bear separation, so you can see w

RiskMetrics█ OVERVIEW
This library is a tool for Pine programmers that provides functions for calculating risk-adjusted performance metrics on periodic price returns. The calculations used by this library's functions closely mirror those the Broker Emulator uses to calculate strategy performance metrics (

Simple Decesion Matrix Classification Algorithm [SS]Hello everyone,
It has been a while since I posted an indicator, so thought I would share this project I did for fun.
This indicator is an attempt to develop a pseudo Random Forest classification decision matrix model for Pinescript.
This is not a full, robust Random Forest model by any stretch o

Tick CVD [Kioseff Trading]Hello!
This script "Tick CVD" employs live tick data to calculate CVD and volume delta! No tick chart required.
Features
Live price ticks are recorded
CVD calculated using live ticks
Delta calculated using live ticks
Tick-based HMA, WMA, EMA, or SMA for CVD and price
Key tick levels (S

analytics_tablesLibrary "analytics_tables"
📝 Description
This library provides the implementation of several performance-related statistics and metrics, presented in the form of tables.
The metrics shown in the afforementioned tables where developed during the past years of my in-depth analalysis of various str

Adaptive Trend Classification: Moving Averages [InvestorUnknown]Adaptive Trend Classification: Moving Averages
Overview
The Adaptive Trend Classification (ATC) Moving Averages indicator is a robust and adaptable investing tool designed to provide dynamic signals based on various types of moving averages and their lengths. This indicator incorporates multipl

Statistics • Chi Square • P-value • SignificanceThe Statistics • Chi Square • P-value • Significance publication aims to provide a tool for combining different conditions and checking whether the outcome is significant using the Chi-Square Test and P-value.
🔶 USAGE
The basic principle is to compare two or more groups and check the results

FiniteStateMachine🟩 OVERVIEW
A flexible framework for creating, testing and implementing a Finite State Machine (FSM) in your script. FSMs use rules to control how states change in response to events.
This is the first Finite State Machine library on TradingView and it's quite a different way to think about your

See all indicators and strategies
Community trends
NVO: Awakening a Sleeping GiantNovo Nordisk (NVO) has been through a turbulent period marked by political pressure, leadership transition, and volatile price action. Once a dominant growth leader, the stock entered a prolonged downtrend, losing nearly two-thirds of its value from its highs. But beneath the surface, critical stru

TSLA Elliott Wave Count with ABC Harmonic or Flat Corrective Tesla (TSLA) is forming a potential Wave 4 correction that aligns with an ABC harmonic structure. Price action suggests a possible deeper retracement into the 0.5–0.618 Fibonacci support zone (436–449 area) before resuming its larger uptrend.
If Wave 4 completes near the harmonic “D” zone (highligh
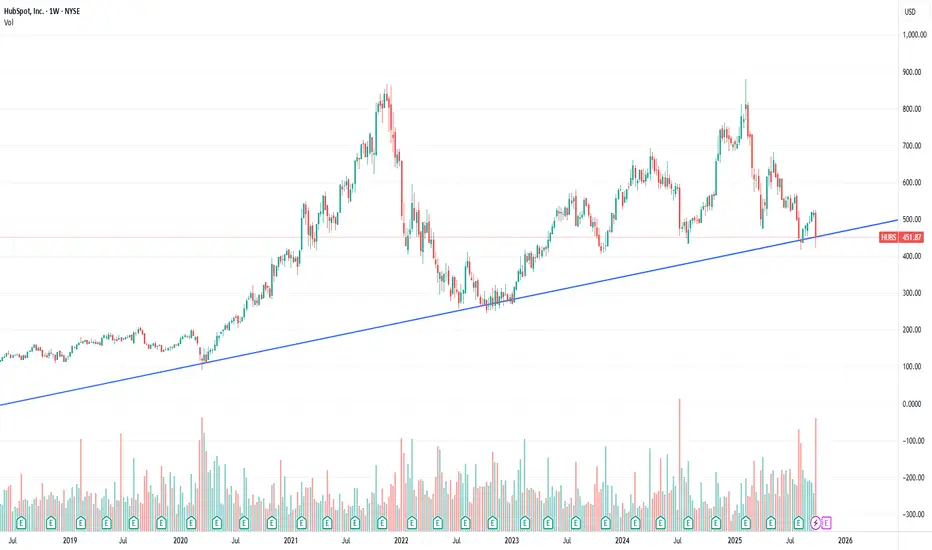
HUBS bounced up from the multi-year uptrend supportHUBS under pressure from recent OpenAI SaaS rollout. Giving a nice opening for entry.
NVIDIA What happens when it retests a Resistance after a break?NVIDIA Corporation (NVDA) has been on a strong rise since the mid-term September 05 Low and this week finally broke above its previous $184 High. During the current Bull Cycle (since the October 2022 bottom), every time the price broke above a previous High and re-tested it as a Support, it started
Microstrategy Is Still Pointing Higher For The Final 5th WaveMicrostrategy is a US business intelligence and software company, but it has become best known for its aggressive Bitcoin strategy. Under co-founder Michael Saylor, the company shifted from focusing mainly on software to also using Bitcoin as its primary treasury reserve asset.
Since 2020, MicroStra
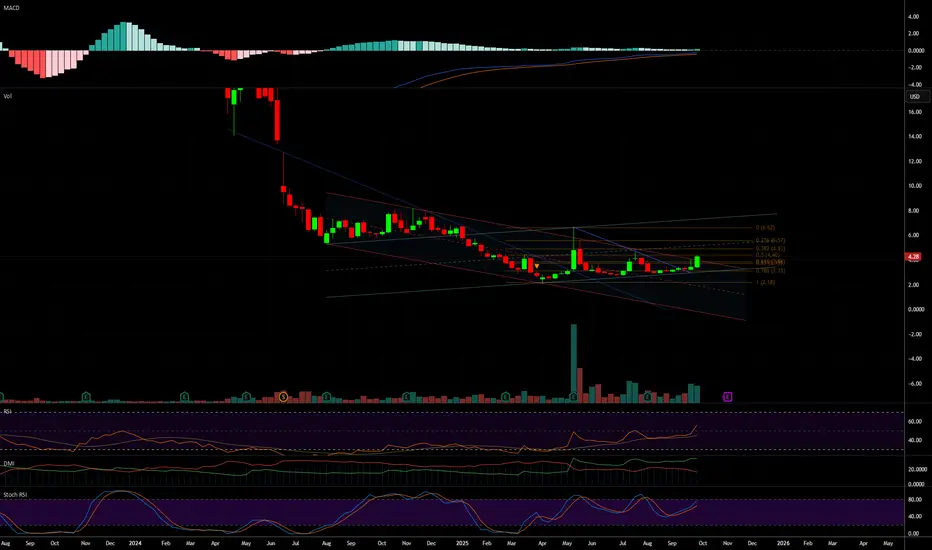
$SPCE - Punch it Chewie -VIRGIN GALACTIC IN SPACE 2026Another NYSE:SPCE update, just really like what the charts are showing. This stock has been in a long downtrend for quite some time and we're finally beginning to see some candles breaking resistance.
The MACD is flattening out and a bullish crossover may be forming. Again we should always wait
When will Microsoft (MSFT) close its monthly gap?NASDAQ:MSFT
Microsoft (MSFT) saw a 7% gap up following its earnings report in May.
To fill this gap, the stock would need to drop about 28.59% from its high, or 23.33% from the current level.
Historically, gaps on the monthly chart have eventually been filled, so it’s reasonable to assume that

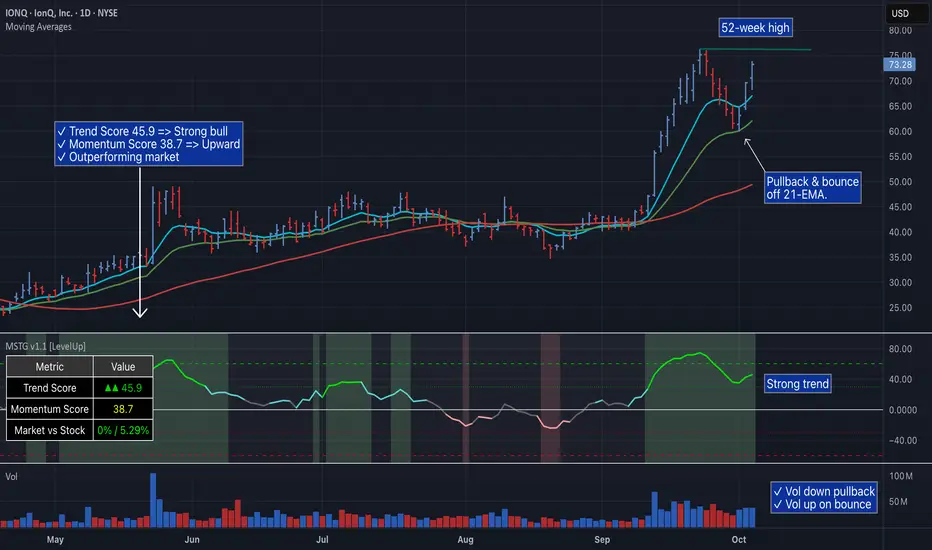
IONQ’s Next Move: $75 Breakout or Another 21-EMA Support Test?IonQ (IONQ) showed strong performance this week, hitting new highs and maintaining bullish technical ratings as sector momentum continued and news of strategic investments boosted sentiment.
The company traded near its 52-week high at around $73.54, up over 70% year-to-date, and benefited from its
What AMD's Chart Says Ahead of This Month's Earnings ReportAdvanced Micro Devices NASDAQ:AMD has gained nearly 40% so far this year, but its performance has actually lagged that of rival high-end chip designers like Nvidia NASDAQ:NVDA and Broadcom NASDAQ:AVGO . What does AMD's technical and fundamental analysis say might happen next?
Let's look:
A

Double or nothing The price is moving with its third upward wave toward the $16 mark.
It’s possible that this move will represent a solid +100% gain from the lows near the lower blue support at $7.77.
Head and shoulders completed on 4H
Be cautious: these small-cap companies often swing 10% in a single day due to h

See all stocks ideas
Tomorrow
PKEPark Aerospace Corp.
Actual
—
Estimate
—
Tomorrow
LFCRLifecore Biomedical, Inc.
Actual
—
Estimate
−0.31
USD
Tomorrow
GMGIGolden Matrix Group, Inc.
Actual
—
Estimate
−0.00
USD
Tomorrow
VFSVinFast Auto Ltd.
Actual
—
Estimate
−0.26
USD
Tomorrow
CMTLComtech Telecommunications Corp.
Actual
—
Estimate
−0.75
USD
Tomorrow
STZConstellation Brands, Inc.
Actual
—
Estimate
3.38
USD
Tomorrow
AEHRAehr Test Systems
Actual
—
Estimate
0.00
USD
Oct 7
MKCMcCormick & Company, Incorporated
Actual
—
Estimate
0.81
USD
See more events
Community trends
BTC/USDT | BTC Uptober Begins – Massive Rally Loading!By analyzing the Bitcoin chart on the 4-hour timeframe, we can see that the price moved exactly as expected — it hit the $118,000 target and even rallied up to $123,900 . After reaching this key supply zone, which we had marked earlier, BTC faced selling pressure and is now trading around $121,8

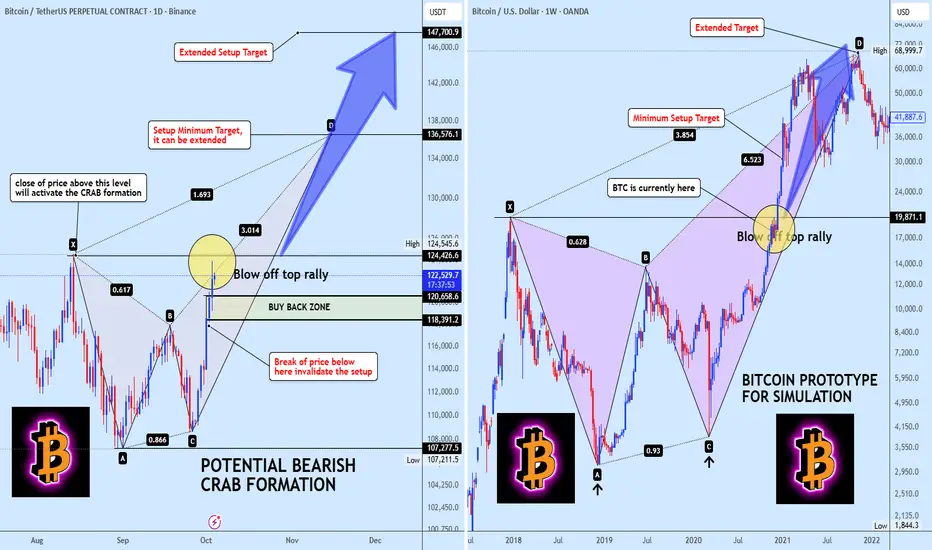
BTC's 2021 Playbook is Back Are You Ready for the Final Rally?History doesn't repeat itself, but it often rhymes. And right now, Bitcoin is composing a symphony we've heard before, one that ended in a PARABOLIC EXPLOSION.
We're looking at a potential BEARISH CRAB PATTERN on the daily chart, and it's a near perfect mirror of the 2017-2021 prototype that launch
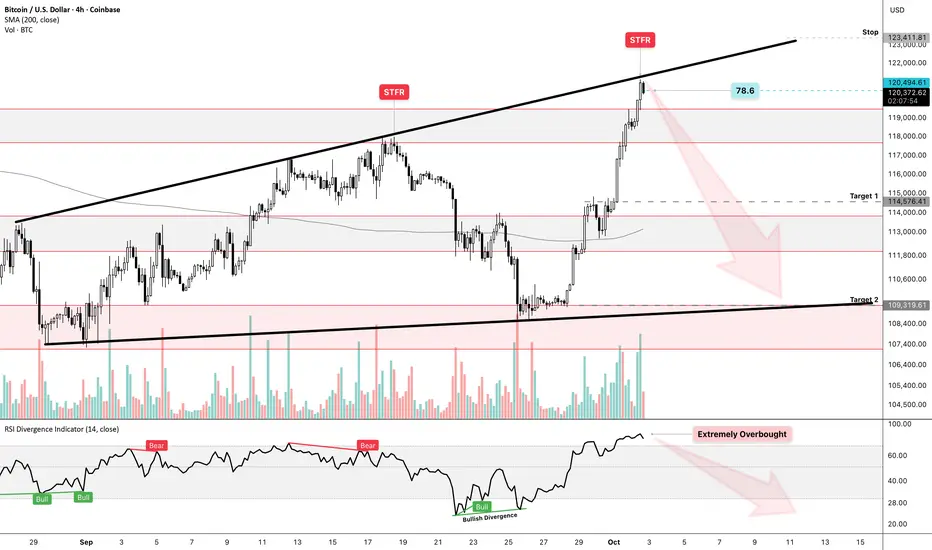
BTCUSD – Go Short or Go Broke | H4 Setup📝Thesis: Just entered a short on COINBASE:BTCUSD based on a confluence of technical and macro signals. This isn’t just about overbought RSI - it’s about asymmetric risk, deceptive bullish structure, and a broader bearish undertone most traders are ignoring.
📉 Setup Breakdown
RSI (H4): 85.12 –
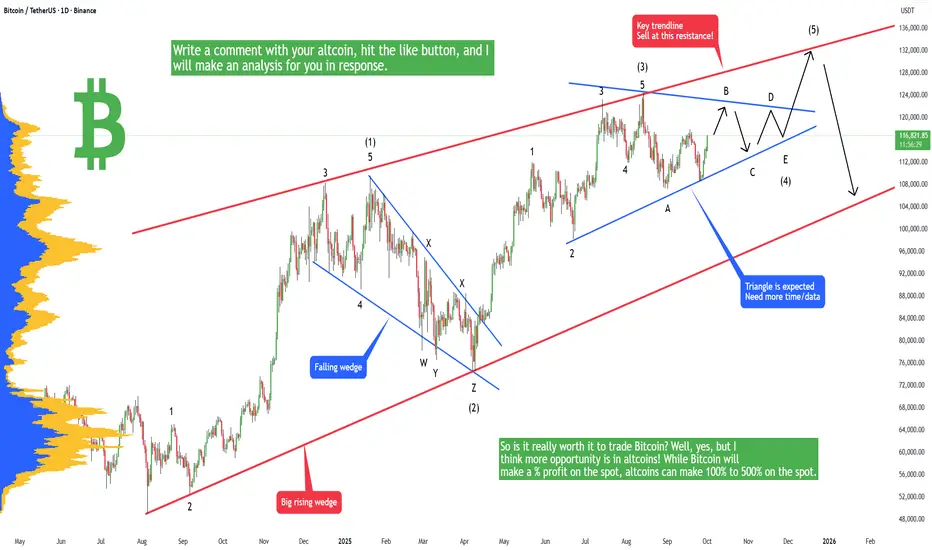
Bitcoin - LifeTime opportunity if you read this!Bitcoin is in the last stage of the current bull market (from 15k to 130k) and you definitely want to know where to sell otherwise you can experience a huge loss in 2026. You don't want to watch your portfolio dropping by 50% to 80%. You probably already know that the market is completely manipulate
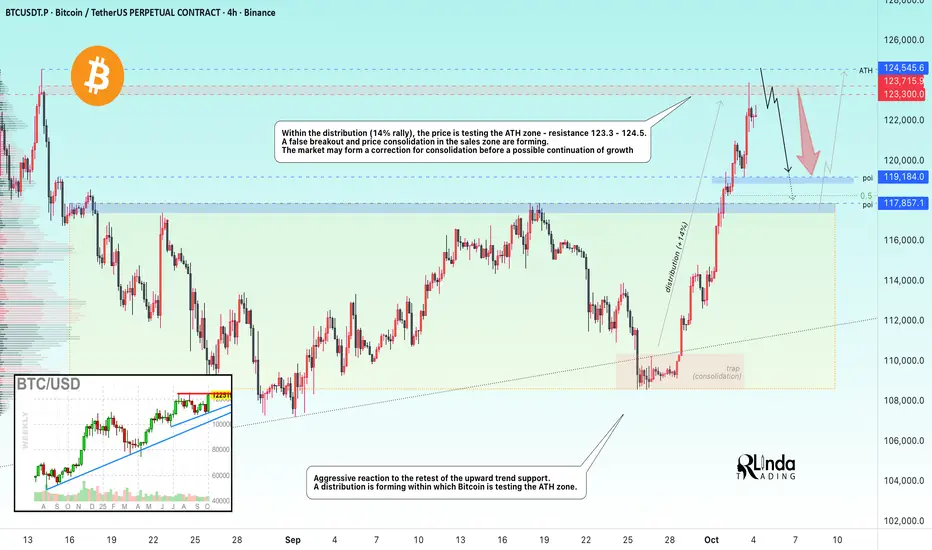
BITCOIN → False breakout of the all-time high zoneBINANCE:BTCUSDT is rising amid the US government shutdown and testing the all-time high zone and resistance at 123.3K - 123.7K. A false breakout has formed and the market is moving into local consolidation.
The price is reacting aggressively to the retest of the uptrend support. A rally is for
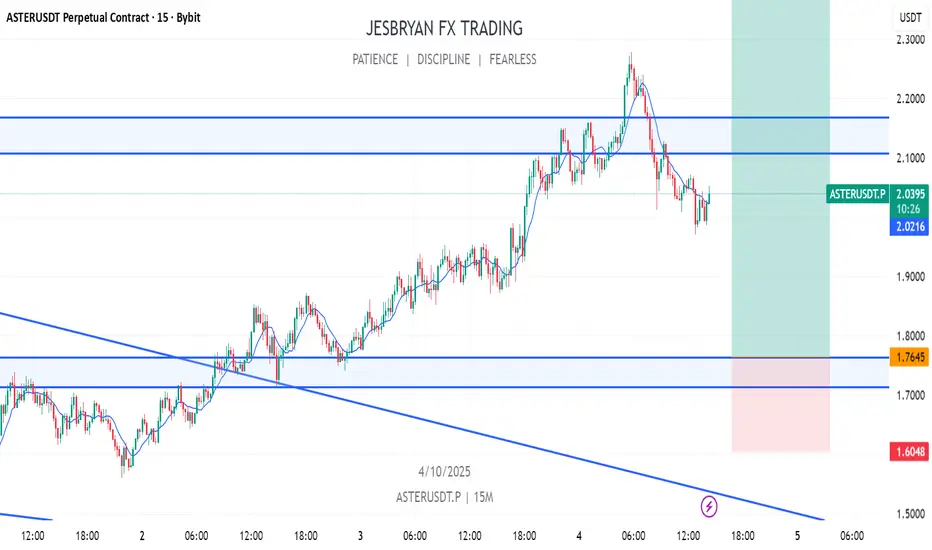
ASTER analysisPrice has broken the falling wedge and continues its upward movement. You can accumulate at the support area. As BNB leads the market, we may see upward movement in ASTER, which is the #1 DEX on the Binance chain.
Support Area: $2.10-$2.15
Second Support Area: $1.70-$1.75
Resistance Area: $2.45-$
Ethereum - The clear $20.000 target!🚀Ethereum ( CRYPTO:ETHUSD ) is breaking out:
🔎Analysis summary:
Despite the recent back and forth, Ethereum clearly remains bullish. We are still able to see the underlying triangle pattern, which Ethereum is attempting to break again. After a successful breakout, Ethereum will immediately st

DOT: Still bullish and well-positioned for further gainsDOT: Still bullish and well-positioned for further gains
DOT continues to extend its upward move. The price reached 4.34 so far with minor moves.
Momentum looks weak considering BTC is testing strong territory again. However, considering all altcoins have plenty of room to grow further, the chance

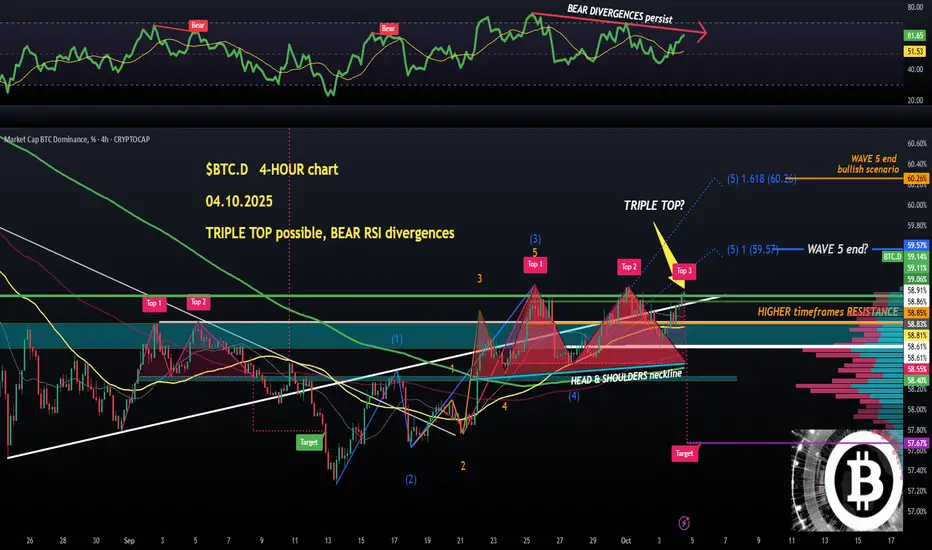
$BTC.D (4-hour): TRIPLE TOP possibility mixed with BEAR RSI divsI haven't posted the most important crypto ticker for the altseason in a few days, which I consider #BTC.D , so here we go.
The DAILY is still bullish with a falling wedge breakout (looking a bit weak already) targetting 62%, so I will simply look into shorter timeframes, 4-hr first.
First of all
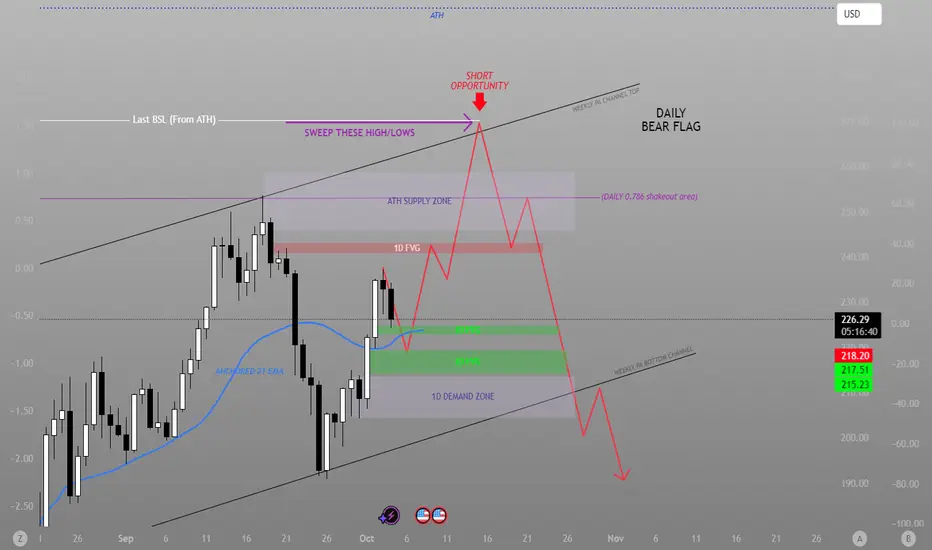
Time for the bears to step in, FINALLY!Overview Context:
Support: $190.00
Resistance: $260.00
Supply Area: $245 to $260
Demand Area: $200 to $215
Psychological Levels: $270 and ATH ($300 Area)
Technical Context:
Technical Structure- We are still residing in our Weekly PA channel that began in April of 2025. With Solana showing strong b
See all crypto ideas
XAU/USD Bullish Setup ( Nfp )This chart analysis of XAU/USD (Gold vs US Dollar, 1H timeframe) highlights a bullish setup supported by an upward trend line. Price is currently trading around 3858, just below the resistance zone near 3873 – 3897.
Support: The rising trend line is acting as a key support, keeping the bullish stru

Gold Continues to Challenge Record Resistance Levels👋Hello everyone, what are your thoughts on OANDA:XAUUSD ?
As of this writing, gold continues its upward momentum, having reached new highs as investors increase their bets on the Federal Reserve cutting interest rates in the near future. The concerns over the U.S. government shutdown and global e
Weekly Gold Outlook: Safe-Haven Demand Fuels UptrendHello everyone,
Last week gold demonstrated remarkable strength, quickly rebounding from its lows and closing at 3,887 USD/oz, up 50 USD from the session bottom. The main driver continues to be safe-haven demand amid US political uncertainty and the weakening dollar.
On the macro side, the US go

XAU/USD | Gold Volatility High – Correction or New Rally? (READ)By analyzing the gold chart on the 1-hour timeframe, we can see that after climbing to $3,897 yesterday, the price sharply corrected down to $3,819. From this demand level, gold rebounded and filled the liquidity gap, rallying up to $3,890.5.
Right after touching this key supply zone, heavy selling

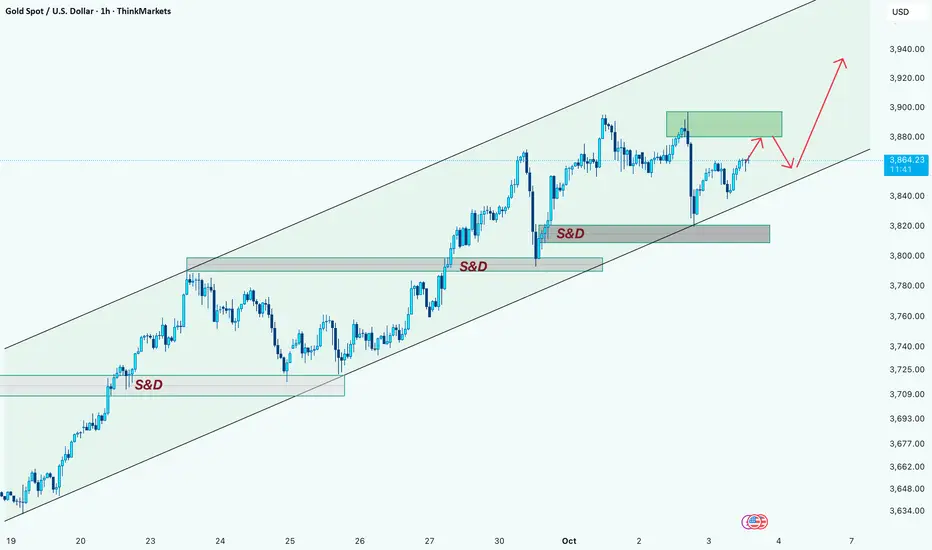
Gold Bulls Warming Up for the Next Rally After PullbackHi guys
Gold is still respecting the ascending channel structure, creating higher highs and higher lows. The price has already reacted strongly from the demand (S&D) zone around 3820–3840, pushing back toward the upper side of the channel.
🔎 At this stage, the key area to watch is the green supply
Continue to create new ATH, gold will increase next week✍️ NOVA hello everyone, Let's comment on gold price next week from 10/06/2025 - 10/10/2025
⭐️GOLDEN INFORMATION:
Gold (XAU/USD) climbs 0.7% during Friday’s North American session to around $3,882, extending its winning streak to a seventh consecutive week as the US government shutdown enters its t

SILVER (XAG/USD): One More Bullish Wave is Coming?!⚠️ SILVER appears to be confined within a horizontal range, as observed on the 4-hour chart. The price is currently nearing the upper limit of this range.
Given the prevailing strong bullish trend, there is a considerable likelihood of a continued upward movement.
A breakout and a 4-hour candle cl
S&P 500 Futures: Trend Intact, Nothing Suggesting a Top YetDaily chart view on ES (S&P 500 Futures) — the trend remains extremely clean with price holding well above the 5, 10, 20, and 50 MAs. Each pullback has been shallow and met with strong buying, confirming that momentum and structure are still fully bullish.
There’s currently nothing on the chart sug

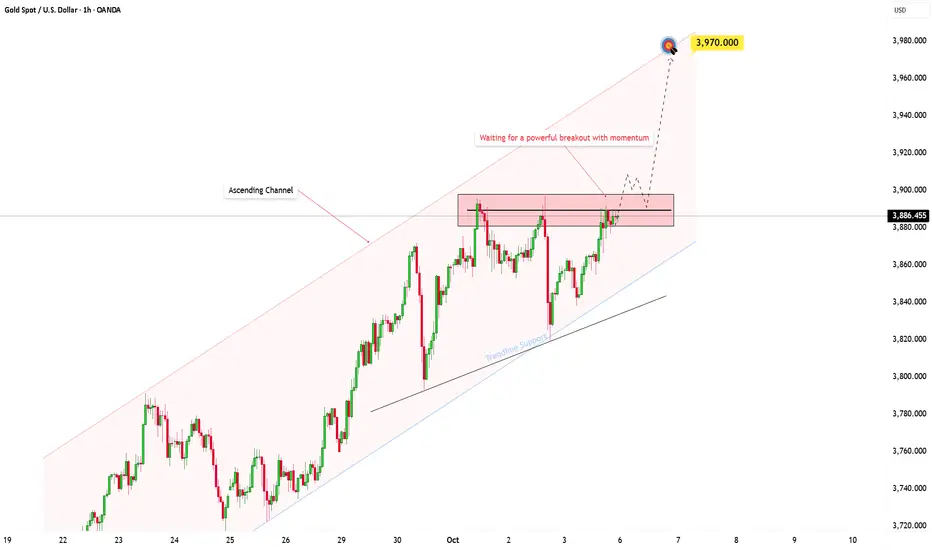
The Gold Bulls Take Control!Hi everyone, Kilian here!
Let’s talk about XAUUSD.
Gold is showing a clear and structured bullish trend right now. The price continues to move within a well-established ascending channel, and the price action has consistently respected both the upper and lower boundaries. This suggests that the bu
Gold prices are expected to continue rising next weekGold prices continued to rise last week
Now it finished another correction down and rejected from the Daily bullish FVG so next week we could see more upside again.
Let's see what price does and react.
Trade idea: Wait for a small correction down on a lower timeframe and a change in orderflow to

See all futures ideas
Euro will potentially Fall to 1.1680 After a Fake RallyHello traders, I want share with you my opinion about Euro. The market dynamic for the Euro has shifted from bullish to corrective after the price broke down from a prior upward channel. This structural change has led to the formation of a large downward pennant, a consolidation pattern that has bee

NZDUSD: Waiting for a Fall! 🇳🇿🇺🇸
NZDUSD will most likely complete a correctional movement soon.
The price continues retesting a recently broken major structure
and the pair is already close to its upper boundary.
Be ready for a strong bearish movement from that.
Next support - 0.57
❤️Please, support my work with like, thank

GBP/AUD – Triangle Breakout (03.10.2025)📊 Setup:
GBP/AUD has broken down from a Triangle Pattern on the 30M chart. Price rejected the resistance zone and confirmed bearish momentum by closing below the trendline support. The breakout signals potential continuation towards lower support levels.
📉 Trade Plan:
Bias: Bearish as long as price

GBPAUD IS GOING LONG THIS WEEK! Don't you think? Hey Traders!
This is my TA for GA this week, I do believe that this pair has been trending up and has had heavy rejection to the downside in the 4 hour time table, so that paird with impactful news that looks to have AUD consumers to be negative impact I believe AUD will fall in strength giving GB

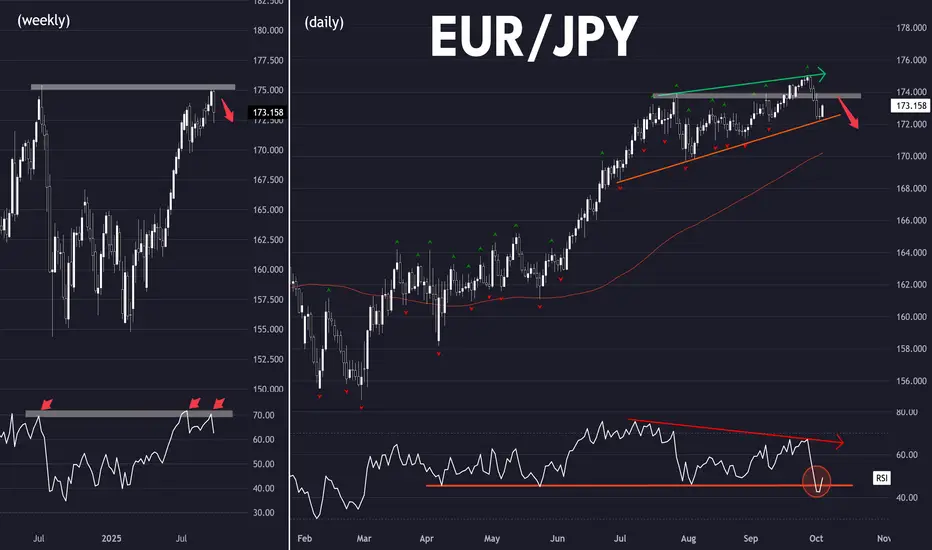
Getting in early on a trend reversal (EUR/JPY)Setup
Bearish: Potential long term top.
Bearish engulfing candlestick from multi-year highs
RSI has dropped from 70 overbought
Signal
Fakeout: Looking for rebound to stall near the former resistance at 174.
RSI bearish divergence, taken out support
Caution: uptrend line has held so far. A break
EUR/USD - HIGH VOLUME CONTROL1st-----⬆️
Then---⬇️
💡Expect rally to supply zone before continuation lower
🚨Price has to expand up or attempt to rally from contraction to supply area
🎯Then big bear trend down🔴
-------------------------------------------------------------------------------------
🎯 KEY PIVOT
📍 Zone Type: ACTIVE P

EURUSD is bearish due to dollar strentheningEURUSD is bearish due to dollar strenthening. US economy is doing well currently.

GJ LongI feel like it's going to breakout of this zone aggressively and head towards the next level.

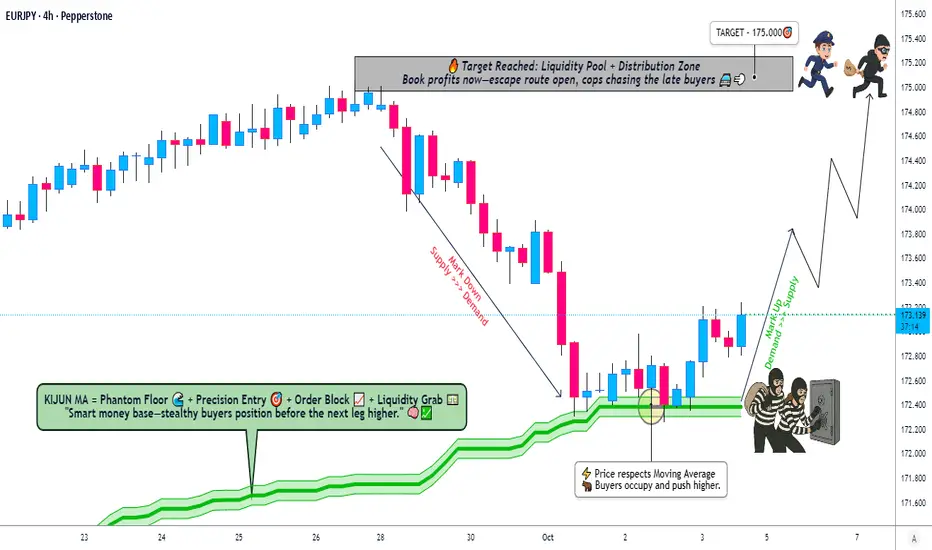
Is EURJPY Setting Up for a Powerful Bullish Run?🎯 EUR/JPY: "Euro vs. Yen" Wealth Heist Strategy 🤑 (Swing/Day Trade)
🚨 Thieves aka (Smart traders) of the Forex Market, Assemble! 🚨Get ready to pull off a slick bullish heist on EUR/JPY with this Thief-Style Trading Plan! We're leveraging a Kijun-Sen pullback to spot a juicy demand zone where the bu

See all forex ideas
| - | - | - | - | - | - | - | ||
| - | - | - | - | - | - | - | ||
| - | - | - | - | - | - | - | ||
| - | - | - | - | - | - | - | ||
| - | - | - | - | - | - | - | ||
| - | - | - | - | - | - | - | ||
| - | - | - | - | - | - | - | ||
| - | - | - | - | - | - | - |
Trade directly on the supercharts through our supported, fully-verified and user-reviewed brokers.


