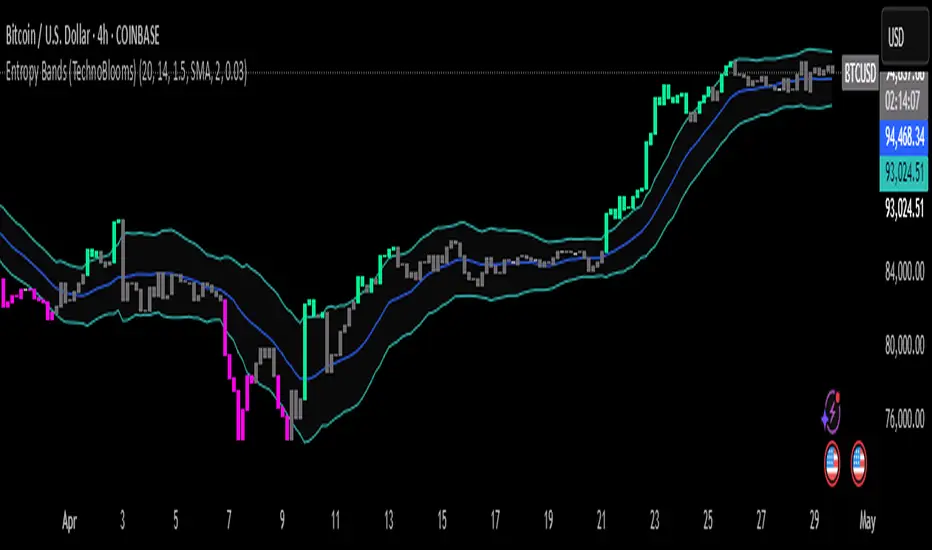
Entropy Bands (TechnoBlooms)Entropy Bands — A New Era of Volatility and Trend Analysis
Entropy Bands is our next indicator as a part of the Quantum Price Theory (QPT) Series of indicators.
🧠 Overview
Entropy Bands are an advanced volatility-based indicator that reimagines traditional banded systems like Bollinger Bands.
Built on entropy theory, adaptive moving averages, and dynamic volatility measurement, Entropy Bands provide deeper insights into market randomness, trend strength, and breakout potential.
Instead of only relying on price deviation (like Bollinger Bands), Entropy Bands integrate chaos theory principles to create smarter, more responsive dynamic bands that adapt to real market behavior.
🚀Why is Entropy Bands Different — and Better
Dynamic Band Width : Adjusts using both entropy and ATR, creating smarter expansion/contraction.
Multi-Moving Average Core : Choose between SMA, EMA, or WMA for optimal centerline behavior.
Noise and Breakout Filtering : Filters fake breakouts by analyzing candle body size and entropy conditions.
Visual Clarity : Background and candle coloring highlight chaotic/noisy zones, trend zones, and breakout moments.
Entropy Bands don't just react to price — they analyze the underlying market behavior, offering superior decision-making signals.
📚 Watch Band Behavior:
Bands expand during volatility spikes or chaotic conditions.
Bands contract during low volatility or tight consolidation zones.
📚 Analyze Candle Coloring:
Green = Bullish breakout (closing above upper band).
Pink = Bearish breakout (closing below lower band).
Gray = Inside bands (neutral/random noise).
✨ Key Features of Entropy Bands:
Entropy-Based Band Width Calculation: A scientific edge over pure price deviation methods.
Dynamic Background Coloring: Highlights high entropy areas where randomness dominates.
Candle Breakout Coloring: Easy-to-spot trend breakouts and strength moves.
Multi-MA Flexibility: Adapt the bands’ core to trending, ranging, or volatile markets.
Body Size Filter: Protects against fake breakouts by requiring meaningful candle body moves.
Educational
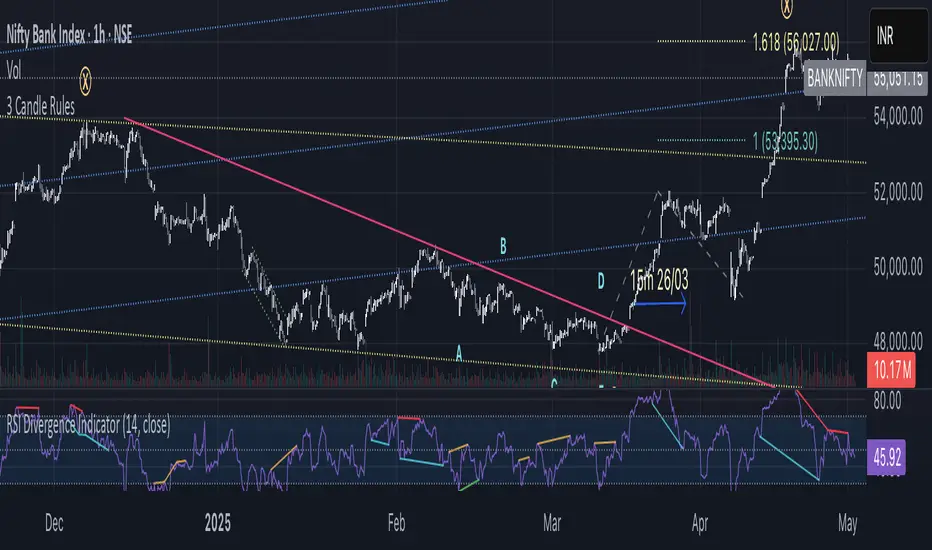
3 Candle Rules -PJThis script is to identify the change in trend by simply applying 3 rules on candle sticks. These three rules are applied by comparing HLC of current candle with previous candle.
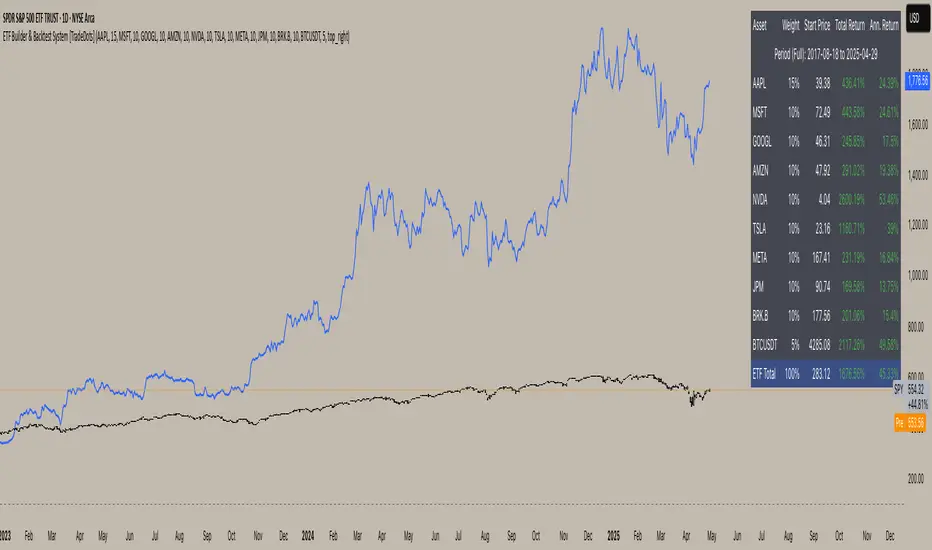
ETF Builder & Backtest System [TradeDots]Create, analyze, and monitor your own custom “ETF-like” portfolio directly on TradingView. This script merges up to 10 different assets with user-defined weightings into a single composite chart, allowing you to see how your personalized portfolio would have performed historically. It is an original tool designed to help traders and investors quickly gauge risk and return profiles without leaving the TradingView platform.
📝 HOW IT WORKS
1. Custom Portfolio Construction
Multiple Assets : Combine up to 10 different stocks, ETFs, cryptocurrencies, or other symbols.
User-Defined Weights : Allocate each asset a percentage weight (e.g., 15% in AAPL, 10% in MSFT, etc.).
Single Composite Value : The script calculates a weighted “ETF-style” price, effectively simulating a merged portfolio curve on your chart.
2. Performance Tracking & Return Analysis
Automatic History Capture : The indicator records each asset’s starting price when it first appears in your chosen date range.
Rolling Updates : As time progresses, all asset prices are continually evaluated and the portfolio value is updated in real time.
Buy & Hold Returns : See how each asset—and the overall portfolio—performed from the “start” date to the most recent bar.
Annualized Return : Automatically calculates CAGR (Compound Annual Growth Rate) to help visualize performance over varying timescales.
3. Table & Visual Output
Performance Table : A comprehensive table displays individual asset returns, annualized returns, and portfolio totals.
Normalized Chart Plot : The composite ETF value is scaled to 100 at the start date, making it easy to compare relative growth or decline.
Optional Time Filter : You can define a specific date range (Start/End Dates) to focus on a particular period or to limit historical data.
⚙️ KEY FEATURES
1. Flexible Asset Selection
Choose any symbols from multiple asset classes. The script will only run calculations when data is available—no need to worry about missing quotes.
2. Dynamic Table Reporting
Start Price for each asset
Percentage Weight in the portfolio
Total Return (%) and Annualized Return (%)
3. Simple Backtesting Logic
This script takes a straightforward Buy & Hold perspective. Once the start date is reached, the portfolio remains static until the end date, so you can quickly assess hypothetical growth.
4. Plot Customization
Toggle the main “ETF” plot on/off.
Alter the visual style for tables and text.
Adjust the time filter to limit or extend your performance measurement window.
🚀 HOW TO USE IT
1. Add the Script
Search for “ETF Builder & Backtest System ” in the Indicators & Strategies tab or manually add it to your chart after saving it in your Pine Editor.
2. Configure Inputs
Enable Time Filter : Choose whether to restrict the analysis to a particular date range.
Start & End Date : Define the period you want to measure performance over (e.g., from 2019-12-31 to 2025-01-01).
Assets & Weights : Enter each symbol and specify a percentage weight (up to 10 assets).
Display Options : Pick where you want the Table to appear and choose background/text colors.
3. Interpret the Table & Plots
Asset Rows : Each asset’s ticker, weighting, start price, and performance metrics.
ETF Total Row : Summarizes total weighting, composite starting value, and overall returns.
Normalized Plot : Tracks growth/decline of the combined portfolio, starting at 100 on the chart.
4. Refine Your Strategy
Compare how different weights or a new mix of assets would have performed over the same period.
Assess if certain assets contribute disproportionately to your returns or volatility.
Use the results to guide allocations in your real trading or paper trading accounts.
❗️LIMITATIONS
1. Buy & Hold Only
This script does not handle rebalancing or partial divestments. Once the portfolio starts, weights remain fixed throughout the chosen timeframe.
2. No Reinvestment Tracking
Dividends or other distributions are not factored into performance.
3. Data Availability
If historical data for a particular asset is unavailable on TradingView, related results may display as “N/A.”
4. Market Regimes & Volatility
Past performance does not guarantee similar future behavior. Markets can change rapidly, which may render historical backtests less predictive over time.
⚠️ RISK DISCLAIMER
Trading and investing carry significant risk and can result in financial loss. The “ETF Builder & Backtest System ” is provided for informational and educational purposes only. It does not constitute financial advice.
Always conduct your own research.
Use proper risk management and position sizing.
Past performance does not guarantee future results.
This script is an original creation by TradeDots, published under the Mozilla Public License 2.0.
Use this indicator as part of a broader trading or investment approach—consider fundamental and technical factors, overall market context, and personal risk tolerance. No trading tool can assure profits; exercise caution and responsibility in all financial decisions.
EMA200 Golden/Death Cross Gradient // (\_/)
// ( •.•)
// (")_(")
EMA200 Golden/Death Cross Gradient
A Pine Script v6 overlay that highlights trend-change signals with a volatility-based color gradient.
*Moving Averages
*Short EMA (default 50 periods) in bright yellow
*Long EMA (default 200 periods) in vivid red
*Cross Detection
*Golden Cross: when the short EMA crosses above the long EMA → signals bullish shift
*Death Cross: when the short EMA crosses below the long EMA → signals bearish shift
Volatility Filter
*Uses ATR (default 14) to gauge current market volatility
*User-set Min/Max Volatility thresholds map ATR values onto a color gradient
Dynamic Background
*On a Golden Cross, the background glows with a semi-transparent gold gradient, growing more intense as volatility increases
*On a Death Cross, the background glows with a semi-transparent red gradient, likewise scaling with volatility
*No background fill when no cross is active
Customizable Inputs
*Short/Long EMA periods
*ATR length
*Minimum & maximum ATR values for gradient scaling

Daily Target & Consistency Tracker (Fixed)This allows you to add in your consistency and profit goals for any prop firm.

BalajiForex1.2Balaji Forex Indicator Will Work On All Assets But It Is Designed Specially For Gold (XAUUSD) and Bitcoin (BTCUSD), As A Trader Work On 5 Mints Time Frame And Follow Targets and Stop Loss. For More Clear Direction It Will Provide U Information For 15, 30 & 60 Mints. And The Magical Part Is When All Time Frame Provide Same Signal Screen Background Color Will Be Green For Buy And Red For Sell. U Will Get Confidence By This Feature For Direction.
For Side Ways Market We Have Provided Neutral Option When Market Turns Side Ways U Will Get Confirmation On Top Right Side Of The Window.

RM Market StructureThis indicator helps you identify market structure by plotting swing highs and lows (HH, LH, HL, LL), and BOS/CHOCH. 4 swing lengths can be plotted on the chart.

IMPOSSIBLE IS INMy Curiosity about all the trading Strategies and mindset came to an end. It has cost me a lot more than money to reach to this point, but with no regrets I present you the unbeatable🚩 inevitable dream strategy that could create unbelievable a
& catastrophic changes in your whole lifetime. This has cost me far more than any material value. A taste of lost luck and merely only my passion for my trading journey. I never stopped. Thank you.
And remember one thing age is just a number. I made this being a 23 year old Guy, whose was just dreaming along Situations that were totally depressing but life has its own ways
Try these setting on one hour time frame=
🎴BB Length 27
🎴BB StdDev 1.2
🎴Basis MA Type@ SMMA (…)
🎴Source: close
🎴Offset: 3
🕦Start Date: 2018-01-01🏁05:30
🕦End Date: 2069-12-31🏁23:59
🎴ATR Length🚩10
🎴ATR Multiplier for Trailing Stop🚩1.7
🤝Properties-
🎴Initial capital- 100000
🎴Base currency USD💵
👉🏻Order size: 25% of equity
👉🏻Pyramiding: 1
🎴 COST SIMULATION:
👉🏻Commission: 0.05
🎴MARGIN:
👉🏻Margin for long positions: 25%
👉🏻Margin for short positions: 25%
🎴RECALCULATE:
👉🏻 After order is filled:✅
👉🏻On every tick:✅
🎴FILL ORDERS:
👉🏻On bar close:✅
👉🏻 Using standard OHLC✅

Custom Rotatable PinwheelCustom Rotatable Pinwheel – Art Generator (Fully Color-Configurable)
This visual indicator draws a rotating pinwheel using radial spokes. It's designed purely for artistic and decorative purposes — not for trading signals. Use it to create abstract, mandala-like effects by layering multiple instances with different rotation angles and color palettes.
Fully Customizable Spoke Colors
You can now define up to 8 custom spoke colors, which cycle across the pinwheel arms.
Optionally, enable "Use Single Color" to override all spokes with a single color.
This gives full creative control over your color palette and design aesthetic.
Controls:
Number of Spokes – Total number of radial arms
Rotation Offset (°) – Adjusts the starting angle, useful when layering multiple instances
Spin Speed – Controls how fast the pinwheel rotates with each bar
Inner / Outer Radius – Adjusts the spoke arm lengths
Transparency – Controls how visible the lines are
Use Single Color – Toggle between a single color or a full custom palette
Color 1–8 – Set your preferred spoke colors (used when single color is off)
Setup for a Clean Chart Canvas (No Price Bars or Gridlines)
To hide all default chart visuals and show only the pinwheel design:
Right-click chart → Settings
Symbol tab: Uncheck "Show Bars"
Scales tab: Uncheck "Price Scale" and "Time Scale"
Appearance tab:
Set background to black
Uncheck grid lines, watermark, etc.
Status Line and Events: Uncheck all

CCI Cross Signal with RSI FilterThis indicator is made for educational purpose. Use it to predict the change of trend, it helps to saving wrong decisions in trading. Please use own analysis also

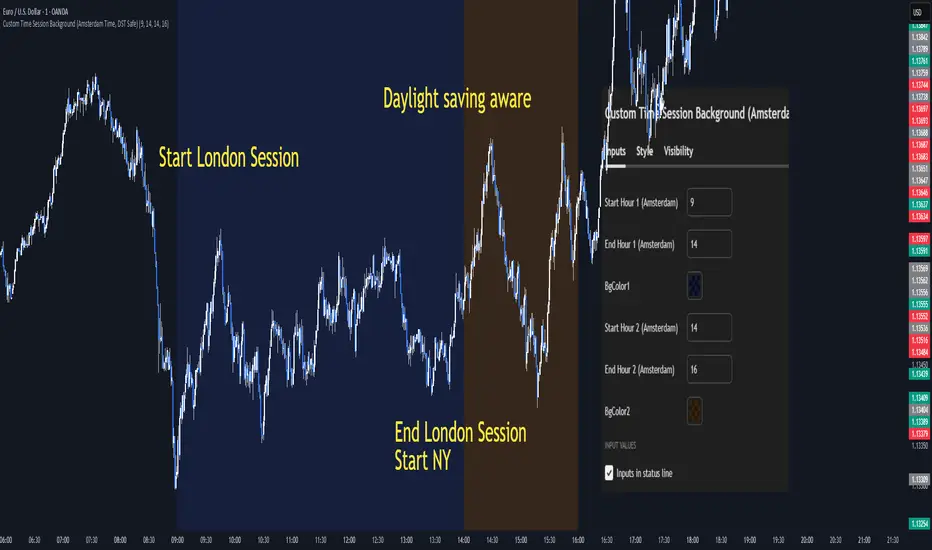
Custom Time Session Background (Amsterdam Time, DST Safe)This indicator highlights two custom intraday time ranges with background colors on your chart. The times are set based on your local Amsterdam time and automatically adjust for Daylight Saving Time (DST).
📌 Features:
- Define two separate time ranges (Start & End) in local Amsterdam time
- Background color highlighting for each range
- Fully DST-aware using the "Europe/Amsterdam" timezone
- Works across all intraday timeframes
🎯 Use Cases:
- Highlight key market sessions (e.g., EU open, NY overlap)
- Visually segment your trading hours
- Eliminate manual DST adjustments
Developed with Pine Script v5.
Made for traders who want clarity during specific time zones, without worrying about time shifts across the year.
DCA Strategy TesterBacktest DCA method. Choose start and end date, monthly amount and see graph, buys orders and stats.

RSI Yüzdelik Türev GöstergesiThe derivative of the RSI indicates the acceleration in momentum.
On the chart, you can see where Ethereum began to start rising.
At the start of a commodity trend, it typically exhibits a significant RSI change.
Situations where the RSI value changes this dramatically are hard to liquidate and tend to trigger a rally.

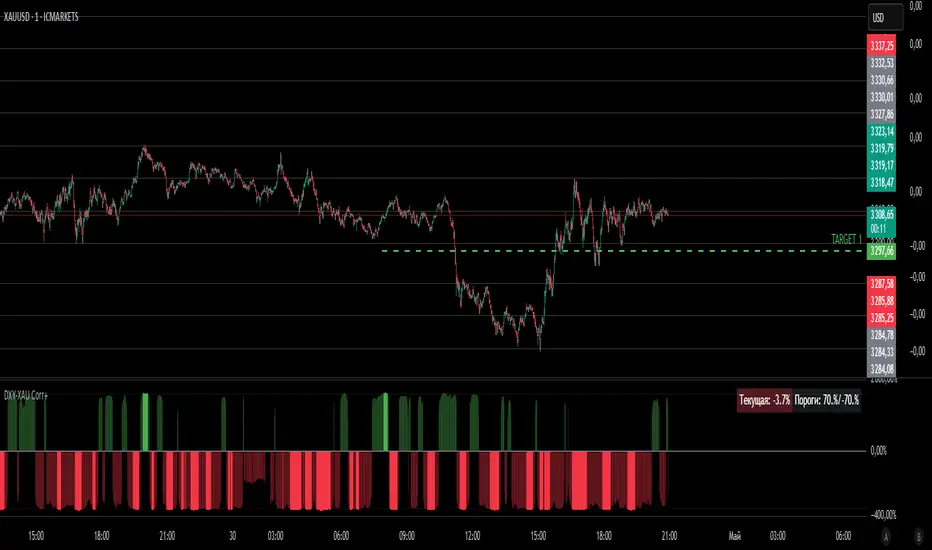
DXY-XAUUSD Correlation with ThresholdsIndicator Description: "DXY-XAUUSD Correlation with Thresholds"
This indicator tracks the dynamic correlation between the US Dollar Index (DXY) and gold prices (XAUUSD) over a user-defined period, expressed as a percentage. It calculates the rolling correlation coefficient between the closing prices of these two assets, scaled to ±100%, and visualizes it as a histogram.
Key Features:
Adjustable correlation period (default: 30 bars) and configurable positive/negative thresholds (default: ±70%).
Color-coded histogram: Intense green/red highlights correlations exceeding thresholds, signaling strong positive/negative relationships.
Horizontal dotted lines mark threshold levels, aiding in identifying overextended "overbought" or "oversold" correlation conditions.
An info table displays the current correlation value and active thresholds for quick reference.
Designed for traders analyzing the inverse relationship between the dollar and gold, this tool helps spot periods of extreme correlation divergence or convergence. The visual alerts and customizable parameters make it adaptable to various trading strategies and timeframes.
Note: The indicator is plotted in a separate pane (non-overlay) for clarity.
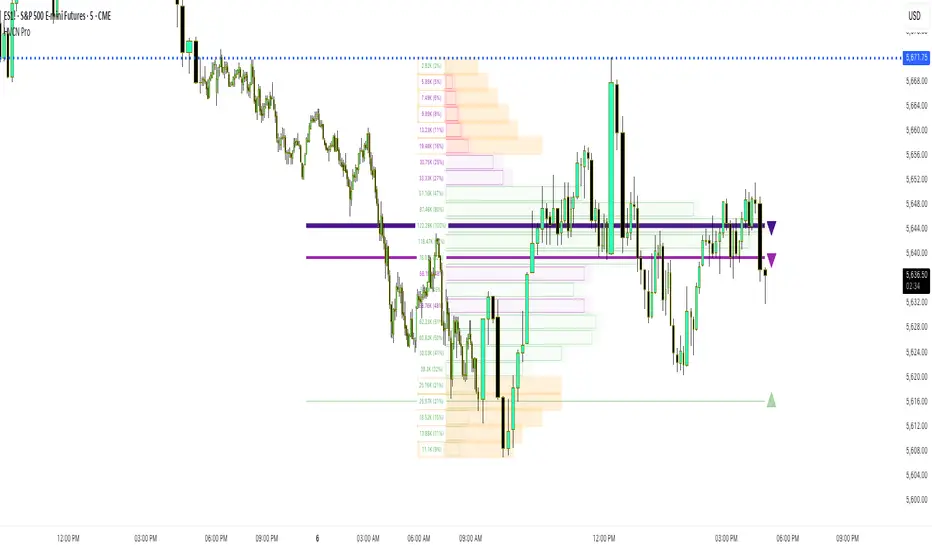
High Volume Candle Node & S/R @MaxMaseratiHigh Volume Candle Node (HVCN)
The High Volume Candle Node (HVCN) indicator, developed by MaxMaserati, is a powerful tool for identifying significant volume-based support and resistance levels on TradingView. Built with Pine Script v5, it visualizes volume nodes and dynamic or semi-static lines to highlight key price levels where high, medium, and low volume activity occurs. This indicator is designed to assist traders in spotting potential breakout zones and critical price levels for decision-making.
Key Features
Volume Nodes: Displays volume distribution across price levels, categorized as High Volume Nodes (HVN), Medium Volume Nodes (MVN), and Low Volume Nodes (LVN).
Dynamic/Semi-Static Lines:
Dynamic Mode: Lines adjust to recent volume changes, reflecting current market activity.
Semi-Static Mode: Lines remain fixed at key price levels for consistent reference.
HVC/MVC/LVC Lines:
High Volume Candle (HVC): Represents price levels with significant trading activity (default threshold: 73%).
Medium Volume Candle (MVC): Indicates moderate volume zones (default threshold: 25%-73%).
Low Volume Candle (LVC): Highlights areas with minimal volume (default threshold: <25%).
Breakout Detection: Identifies price breakouts above or below HVC, MVC, or LVC lines, with customizable sensitivity thresholds.
Visual Enhancements: Includes glow effects, customizable colors, triangles at line ends, and volume labels for better readability.
Bullish/Bearish Coloring: Nodes and lines are colored based on whether bullish or bearish volume dominates, aiding in trend analysis.
LVC/MVC/HVC Labels and Percentages
HVC Labels (High Volume, >73%): Mark price levels with the highest trading activity, often acting as strong support or resistance. These zones indicate where large market participants are active.
MVC Labels (Medium Volume, 25%-73%): Highlight areas with moderate volume, often serving as secondary support/resistance or consolidation zones.
LVC Labels (Low Volume, <25%): Identify price levels with low trading activity, typically areas of low interest or potential breakout zones.
Label Display Options: Users can choose to show volume in normal format (e.g., 1.2M), percentage format (e.g., 73%), or both. Labels can be positioned at price levels or node edges, with customizable size and background opacity.
Settings
Profile Settings: Adjust the number of rows (10-100), lookback length (10-1500 bars), and profile width (10%-100%).
Node Thresholds: Customize HVC (50%-99%) and LVC (5%-49%) thresholds to define volume significance.
Display Toggles: Enable/disable HVC, MVC, LVC nodes, labels, breakout detection, and visual effects like glow or triangles.
Color Customization: Separate bullish and bearish colors for nodes and lines, with adjustable opacity for boxes and labels.
Breakout Sensitivity: Fine-tune breakout thresholds (0.1%-100%) for HVC, MVC, and LVC lines.
How It Works
The HVCN indicator analyzes volume distribution within a specified lookback period, dividing the price range into rows to calculate volume at each level. It then identifies HVC, MVC, and LVC zones based on user-defined thresholds. Dynamic or semi-static lines are drawn at the most significant price levels for each category, with optional breakout detection to signal when the price crosses these lines. Volume labels provide detailed insights into the strength of each level, expressed as a percentage of total volume or absolute value.
Use Cases
Support/Resistance Identification: HVC lines often act as strong barriers, while MVC and LVC indicate weaker zones.
Breakout Trading: Breakout labels and triangles help traders spot potential trend reversals or continuations.
Volume Analysis: Bullish/bearish volume coloring aids in understanding market sentiment at key levels.
Disclaimer
The use of the HVCN indicator is entirely at the user's responsibility. It is a tool for analysis and does not guarantee trading success. Always conduct thorough research and risk management before making trading decisions.
ICT Killzones Bias & Volume Sweeps @MaxMaserati📌 Overview
This indicator helps traders identify key ICT Killzones (Asian, London, NY AM, NY PM sessions) along with volume analysis and sweep detection. It highlights institutional order blocks, tracks session bias, and detects liquidity sweeps with volume confirmation.
Key Features:
✅ ICT Killzones (Asian, London, NY AM, NY PM)
✅ Volume Analysis (High/Low volume detection)
✅ Sweep Detection (Buyside/Sellside sweeps with volume confirmation)
✅ Session Bias (Bullish/Bearish bias based on price action)
✅ Customizable Sessions (Add personal trading hours)
✅ Institutional Order Build-up (30-min pre-session accumulation zones)
⚙️ Input Settings
1. Timezone Settings
Chart Timezone: Adjust to your local timezone (default: New York).
2. Session Toggles
Asian / London / NY AM / NY PM Sessions: Enable/disable each session.
NY Lunch Session: Optional session (disabled by default).
Personal Trading Time: Customize your trading hours.
3. Label Settings
Label Size: Tiny, Small, Normal, Large.
Session Labels: Customize text for High (H), Low (L), Mid (M) labels.
Background Transparency: Adjust session box opacity.
4. Volume Analysis
Show Volume Labels: Displays volume strength (🚀 Very High, 🔥 High, ⚖️ Normal, 💤 Low, 🐢 Very Low).
Volume Lookback Period: Adjusts volume comparison window.
High/Low Volume Thresholds: Define what constitutes high/low volume.
5. Sweep Detection
Buyside/Sellside Sweeps: Highlights liquidity sweeps.
Sweep Margin: Adjust sensitivity for sweep detection.
Fake Sweep Zones: Option to hide or highlight fakeouts.
Example of Session Sweep and Volume:
Here we have a Bullish Sweep of London Low session by NY AM
However, the volume was low suggesting buyers are not strong enough (M1)
And then the sellers took over and a pressure retest by the buyers of the level and then sellers entered with more power/pressure
6. Session Momentum & Bias
Show Session Bias: Indicates bullish/bearish bias for each session.
Bias Strength Threshold: Adjust sensitivity for bias detection.
📊 How It Works
1. Session Highs/Lows
The indicator tracks High, Low, and Mid prices for each session.
Lines and boxes are drawn to visualize the session range.
2. Volume Analysis
Compares current volume to historical average.
Displays volume strength with emojis (🚀, 🔥, ⚖️, 💤, 🐢).
Highlights high-volume sweeps for confirmation.
3. Sweep Detection
Detects buyside sweeps (liquidity above highs) and sellside sweeps (liquidity below lows).
Sweep zones expand if price lingers near the swept level.
4. 30 minute Pre-session Institutional order buildup
Highlights 30-minute pre-session zones where institutions may accumulate orders.
5. Session Bias
Calculates bias based on open/close price action within the session.
Displays Bullish, Bearish, or Neutral labels.
]
🎯 Trading Applications
1. Liquidity Sweeps
Look for sweeps with high volume as confirmation of institutional activity.
Fade fake sweeps (if enabled) when price reverses quickly.
2. Session Breakouts
Trade breakouts from Asian/London ranges during NY sessions.
Watch for volume expansion on breakouts for confirmation.
3. Pre- Session Institutional Block
Price often reacts to pre-session institutional position build-up (30-min before session opens).
LV:Low Volume, HV: High volume and MV: Medium Volume
NY AM Pre-Session institutional Order Build-up block with high sweep
🔧 Customization Tips
Adjust session times to normal future sessions to match your trading style.
Modify sweep sensitivity if too many/too few sweeps are detected.
Use volume thresholds to fine-tune high/low volume alerts.
📌 Final Notes
This indicator combines ICT concepts with volume analysis for a powerful trading edge. Use it alongside price action and market structure for best results at your own risk.

PKN TrendThis Indicator is for educational purpose only. Do use it in Paper trading for practice purpose.

PKN HedgingThis Indicator is for educational purpose only. Do use it in Paper trading for practice purpose.

Power Law Global Liquidity Price Model & OscillatorDescription:
This Pine Script implements a predictive Bitcoin (BTC) price model derived from an observed power-law relationship between BTC price and Global Liquidity (specifically Global M2).
To clarify, the indicator doesn't show M2 directly as many indicators do, but uses an empirical observed relationship between BTC price and M2. This is an important difference from other Global Liquidity indicators and makes it very useful because it allows for making predictions on the future of Bitcoin price.
The model is based on the relationship BTC ~ GL^9.3, where GL represents Global M2, and the best correlation is achieved with an 85-period lead in GL, making it a leading indicator for BTC price movements. The observed correlation is higher than 0.92, giving high confidence in the model's validity. The 85-day lead was chosen by calculating the predictive rate of the model (how many times a positive/negative return in the model correlates with the price) with a given lead. The relationship between a chosen delay and predictive power has a maximum at 85 days.
Features:
BTC Price Model:
Calculates a BTC price model using the power-law relationship (BTC ~ GL^9.3) with an 85-period lead in Global Liquidity data.
The model is superimposed on the chart using forced overlay for clear visualization of the predicted BTC price trend relative to actual price.
Directional Oscillator:
Displayed in a lower panel, the oscillator compares the structural similarity between the actual BTC price and the GL-based price model.
Computes the win rate of the averaged BTC price (over a 1-year period) versus the price model to highlight structural alignment.
Projects future oscillator values based on the 85-period lead in the GL model, providing insight into potential price direction.
This feature is also very unique, and it is not present in most Global Liquidity indicators. The reason to choose the win rate is that this parameter doesn't depend on a precise scaling
between the BTC price and GL. This allows for better identification of changes in features between the 2 time series (for example, a downturn, a run up, peaks, bottoms, and similar).
Purpose:
This script serves as a predictive tool for traders and analysts by leveraging the leading relationship between Global Liquidity and BTC price. The overlay model and oscillator provide both a visual and quantitative framework to anticipate BTC price trends and assess structural alignment with global economic indicators.
The indicator allows for early identification of bottoms, peaks, and possible local bull or bear runs.
Usage Notes:
This indicator works best when used with the "All Time History" BTCUSD index.
The 85-period lead in GL allows for forward-looking projections, making this tool suitable for strategic planning.
The oscillator aids in confirming the structural validity of the model, enhancing confidence in its projections.

2.Purchase Taraması - Only Long"Finds stocks with RSI>30. Works with RTWPCrypto2."
What Does It Do?
1. Signal Screening for 20 Stocks
The getSignal() function scans 20 different stocks (symbol1 to symbol20).
Stocks with buy/sell signals are added to the longArray and shortArray lists.
A summary table is displayed in the top-right corner, showing which stocks have active buy or sell signals.
2. Displaying Buy Levels in Oversold RSI Zones (RSI < 30)
When the RSI value drops below 30:
Target buy prices (targetBuyPrice, targetBuyPrice2) are calculated.
Labels and lines can be placed at these price levels (currently commented out in the code).
3. Price Level Tracking Based on RSI (Labels and Lines)
Based on RSI values:
Counters such as upperTouchCount and lowerTouchCount track how many times certain levels are touched.
Resistance and support zones can be identified and visualized with horizontal lines.
This section sets the groundwork and is meant to be completed in later parts of the code.
Summary:
This script:
Automatically scans 20 stocks and lists buy/sell signals.
Detects potential buy zones based on RSI levels.
Lays the foundation for support/resistance tracking.

UNITED TRADING COMMUNITY WaterMarkWATER MARK indicator. Will allow you to improve the order of the entries you need on the chart.
1. Name and date for the traded instrument
2. Watermarks to protect your charts (in the center and around the perimeter of the chart)
3. The new "notes" option will allow you to keep focus on the factors that are important to you on the chart.
Very flexible settings for any notes, labels, watermarks on the chart that are important to you.
Индикатор WATER MARK . Даст возможность вам улучшить порядок нужных вам записей на графике.
1. Название и дата для торгуемого инструмента
2. Водные знаки для защиты ваших графиков ( в центре и по периметру графика)
3. Новая опция "заметки" позволит вам держать фокус на важных для вас факторах на графике.
Очень гибкая настройка , любых значимых для вас заметок , лейблов , вотермарк на графике.

B-AWACS_Alarm📡Increase your number of Alarms with your membership on Tradingview (paid). An ideal ALARM setting indicator for those who use Fibonacci, Harmonic and XABCD Formations. Set 10 alarms for the same stock, independent of each other.


Price Channel MarkerThis indicator identifies a dynamic price channel based on the most relevant recent price action. It draws two horizontal lines:
* 🔴 Red Line – Marks the high of the most recent red candle (bearish) whose high is just below the current price. It selects the red candle with the high closest in price to the current close, and ensures it is from a valid historical context (ignoring recent highs above the current price).
* 🟢 Green Line – Marks the low of the most recent green candle (bullish) whose low is just above the current price, also selected based on proximity to the current price.
Together, these two lines define a potential price compression zone or "trap" area — showing where price may currently be trading between recent supply (red candle) and demand (green candle). The lines update dynamically and extend into the future to help visualize breakout or rejection levels.
Use Cases:
* Spot potential breakout zones.
* Define short-term support and resistance.
* Filter for entries in range-bound or squeeze conditions.
Customization:
* Adjustable lookback range (up to 5000 bars).
* Colors and line style are easily customizable.
