Smart Directional Fib Zone (Selectable Session)🎯 Overview
This indicator plots a dynamic Fibonacci zone between the 0.5 and 0.618 levels , calculated from the previous day’s price action , and is designed specifically for intraday traders.
It visually highlights key retracement or reaction areas where the market often pauses or reverses.
🔍 How it works
At the start of each day, the script automatically captures:
the previous day’s open (pdo),
high (pdh),
low (pdl),
and close (pdc).
It then determines if the previous day was bullish (Close > Open) or bearish (Close < Open).
Based on that:
If the previous day was bullish, it projects the Fibonacci levels down from the high (typical for expecting retracements).
If bearish, it projects them up from the low.
The two key levels are:
0.5 (50%) retracement / projection
0.618 (61.8%) retracement / projection
A colored zone is plotted between these levels to act as a leading guide for intraday setups.
⏰ Time filtering & session customization
A unique feature is the dynamic session filtering:
By default, the zone is only plotted during active market hours, keeping your chart clean outside trading hours.
The script provides a dropdown selector so you can quickly switch between:
India session (9:15 to 15:30)
Europe session (9:00 to 17:30)
US session (9:30 to 16:00)
Or even define your own custom session times.
This makes it ideal for intraday traders in any region.
🎨 Visual features
The fill zone changes color based on the previous day’s sentiment:
Green zone if the previous day was bullish
Red zone if the previous day was bearish
🚨 Alerts
The script includes an alert condition, so you can easily set up TradingView alerts to notify you when:
Price enters the Fibonacci zone.
This is extremely helpful for catching retracements or reversals without staring at the screen all day.
⚙️ How to use
✅ Works on any intraday timeframe (1 min, 5 min, 15 min, etc.).
✅ Simply add it to your chart, pick your session in the dropdown, and watch the Fibonacci zone automatically adjust to your selected market hours.
Use it as a confluence tool alongside other indicators like VWAP, EMAs, Bollinger Bands, or price action patterns to time entries and exits.
💪 Why this is powerful
This is more than a simple Fib retracement tool:
It dynamically adapts to the previous day’s sentiment, helping you trade in alignment with recent market psychology.
The session filtering ensures your charts are focused only on the periods
Forecasting

DAX Setup ScreenerPine Script – Setup Screener
This code detects:
Range trading zone
Breakout long & breakdown short signals
With visual overlay
Use it like this:
Adjust rangeHigh, rangeLow, and breakoutBuffer
Enabled: Draws signals on the live chart

Unicorn Trade Indicator - EnhancedThis script displays breaker blocks and if the correct conditions are met it will indicate a unicorn entry with a yellow diamond.
Users need to experiment with setting the swing length option, I found 2 or 3 to work best.
I decided to build this indicator as I could not find an open source one that worked adequately
Enjoy

VIX-Price Covariance MonitorThe VIX-Price Covariance Monitor is a statistical tool that measures the evolving relationship between a security's price and volatility indices such as the VIX (or VVIX).
It can give indication of potential market reversal, as typically, volatility and the VIX increase before markets turn red,
This indicator calculates the Pearson correlation coefficient using the formula:
ρ(X,Y) = cov(X,Y) / (σₓ × σᵧ)
Where:
ρ is the correlation coefficient
cov(X,Y) is the covariance between price and the volatility index
σₓ and σᵧ are the standard deviations of price and the volatility index
Enjoy!
Features
Dual Correlation Periods: Analyze both short-term and long-term correlation trends simultaneously
Adaptive Color Coding: Correlation strength is visually represented through color intensity
Market Condition Assessment: Automatic interpretation of correlation values into actionable market insights
Leading/Lagging Analysis: Optional time-shift analysis to detect predictive relationships
Detailed Information Panel: Real-time statistics including current correlation values, historical averages, and trading implications
Interpretation
Positive Correlation (Red): Typically bearish for price, as rising VIX correlates with falling markets. This is what traders should be looking for.
Negative Correlation (Green): Typically bullish for price, as falling VIX correlates with rising markets
How to use it
Apply the indicator to any chart to see its correlation with the default VIX index
Adjust the correlation length to match your trading timeframe (shorter for day trading, longer for swing trading)
Enable the secondary correlation period to compare different timeframes simultaneously
For advanced analysis, enable the Leading/Lagging feature to detect if VIX changes precede or follow price movements
Use the information panel to quickly assess the current market condition and potential trading implications

Top 10 NASDAQ Resilience + DD BandsTracks the top 10 weighted stocks in NQ and has DD bands from RS included.

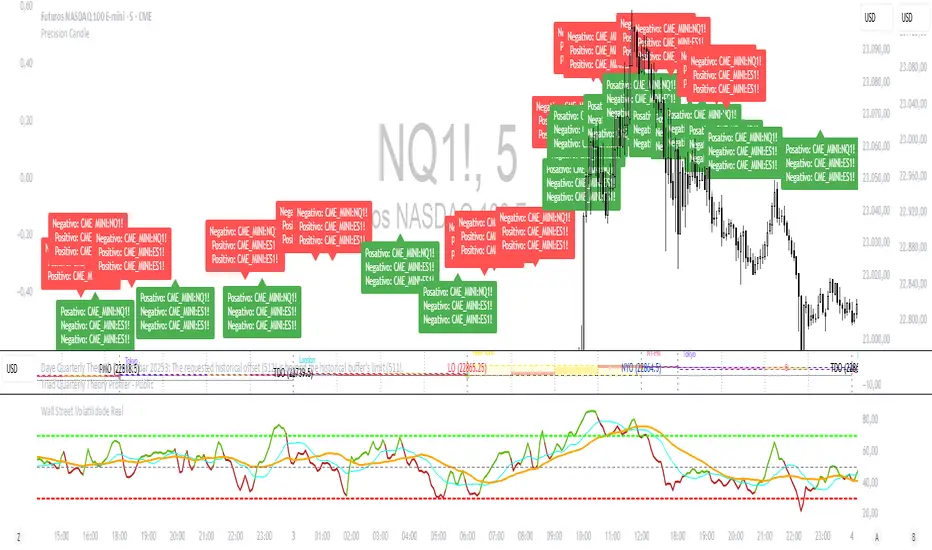
Precision CandleThis Pine Script is designed to help you uncover hidden divergences among multiple assets by tracking how their candles close. Imagine you're analyzing three different assets — they could be indices, currencies, or even cryptocurrencies — and you want to know when one of them is moving out of sync with the others. That’s where this script comes into play.
First, it gives you the flexibility to choose custom ticker symbols or rely on predefined ones based on different asset classes like metals, bonds, or altcoins. Once the symbols are set, the script continuously monitors the opening, high, low, and closing prices of each asset.
The magic happens when it determines the nature of each candle: is it bullish or bearish? By comparing these closing behaviors, the script checks for any discrepancies — situations where at least one asset diverges from the trend of the others. When this happens, the script plots a red "PC" marker below the bar on your chart, drawing your attention to these moments of divergence.
This tool can be invaluable for traders looking to spot unique market dynamics, identify potential trading opportunities, or simply get insights into how different assets behave in relation to each other. It's a simple but powerful way to keep an eye on correlations and anticipate shifts in market sentiment.
Easy Position Size Calculator with Fees# Easy Position Size Calculator with Fees - Manual
## Overview
The Easy Position Size Calculator is a Pine Script indicator designed to help traders calculate the optimal position size for their trades while accounting for trading fees. This tool automatically determines whether you're planning a long or short position and calculates the exact position size needed to risk a specific dollar amount.
## Key Features
- **Automatic Trade Direction Detection**: Determines if you're going long or short based on entry price vs stop loss
- **Fee Integration**: Accounts for trading fees in position size calculations
- **Risk Management**: Calculates position size based on your specified risk amount
- **Risk Factor Adjustment**: Allows you to scale your position size up or down
- **Visual Display**: Shows all calculations in a clear, organized table
## Input Parameters
### Entry Price ($)
- **Purpose**: The price at which you plan to enter the trade
- **Default**: 0.0
- **Range**: Any positive value
- **Step**: 0.01
### Stop Loss ($)
- **Purpose**: The price at which you will exit the trade if it goes against you
- **Default**: 0.0
- **Range**: Any positive value
- **Step**: 0.01
### Risk ($)
- **Purpose**: The maximum dollar amount you're willing to lose on this trade
- **Default**: 0.0
- **Range**: Any positive value
- **Step**: 0.01
### Risk Factor
- **Purpose**: A multiplier to scale your position size up or down
- **Default**: 1.0 (no scaling)
- **Range**: 0.0 to 10.0
- **Step**: 0.1
- **Examples**:
- 1.0 = Normal position size
- 2.0 = Double the position size
- 0.5 = Half the position size
### Fee (%)
- **Purpose**: The percentage fee charged per transaction (buy/sell)
- **Default**: 0.01% (0.01)
- **Range**: 0.0% to 1.0%
- **Step**: 0.001
## How It Works
### Trade Direction Detection
The script automatically determines your trade direction:
- **Long Trade**: Entry price > Stop loss price
- **Short Trade**: Entry price < Stop loss price
### Position Size Calculation
#### For Long Trades:
```
Position Size = -Risk Factor × Risk Amount / (Stop Loss × (1 - Fee) - Entry Price × (1 + Fee))
```
#### For Short Trades:
```
Position Size = -Risk Factor × Risk Amount / (Entry Price × (1 - Fee) - Stop Loss × (1 + Fee))
```
### Fee Adjustment
The script accounts for fees on both entry and exit:
- **Long trades**: You pay fees when buying (entry) and selling (exit)
- **Short trades**: You pay fees when shorting (entry) and covering (exit)
## Output Display
The indicator displays a table with the following information:
### Trade Information
- **Trade Type**: Shows whether it's a LONG, SHORT, or INVALID trade
- **Entry Price**: Your specified entry price
- **Stop Loss**: Your specified stop loss price
- **Fee (%)**: The fee percentage being used
### Risk Parameters
- **Risk Amount**: The dollar amount you're willing to risk
- **Risk Factor**: The multiplier being applied
### Calculated Values
- **Effective Entry**: The actual cost per share including fees
- **Effective Exit**: The actual exit value per share including fees
- **Expected Loss**: The calculated loss if stop loss is hit
- **Deviation from Risk %**: Shows how close the expected loss is to your target risk
- **Position Size**: The number of shares/units to trade
## Usage Examples
### Example 1: Long Trade
- Entry Price: $100.00
- Stop Loss: $95.00
- Risk Amount: $500.00
- Risk Factor: 1.0
- Fee: 0.01%
**Result**: The script will calculate how many shares to buy so that if the stop loss is hit, you lose approximately $500 (accounting for fees). Position Size: 99.61152
### Example 2: Short Trade
- Entry Price: $50.00
- Stop Loss: $55.00
- Risk Amount: $300.00
- Risk Factor: 1.0
- Fee: 0.01%
**Result**: The script will calculate how many shares to short so that if the stop loss is hit, you lose approximately $300 (accounting for fees). Position Size: 59.87426
## Important Notes
### Validation Requirements
For the script to work properly, all of the following must be true:
- Entry price > 0
- Stop loss > 0
- Risk amount > 0
- Entry price ≠ Stop loss (to determine direction)
### Negative Position Sizes
The script may show negative position sizes, which is normal:
- **Negative values for long trades**: Represents shares to buy
- **Negative values for short trades**: Represents shares to short
### Risk Deviation
The "Deviation from Risk %" shows how closely the calculated position size matches your target risk. Small deviations are normal due to:
- Fee calculations
- Rounding
- Market precision
## Color Coding
The table uses color coding for easy identification:
- **Green**: Long trade information
- **Red**: Short trade information
- **Gray**: Invalid trade (when inputs are incorrect)
- **Blue**: Final position size
- **Red background**: Risk-related calculations
## Troubleshooting
### Common Issues
1. **Position Size shows 0**
- Check that all inputs are greater than 0
- Ensure entry price is different from stop loss
2. **Trade Type shows INVALID**
- Verify that entry price and stop loss are both positive
- Make sure entry price ≠ stop loss
3. **Large Risk Deviation**
- This is normal for very small position sizes
- Consider adjusting your risk amount or price levels
## Best Practices
1. **Always validate your inputs** before placing actual trades
2. **Double-check the trade direction** shown in the table
3. **Review the expected loss** to ensure it aligns with your risk management
4. **Consider the effective entry/exit prices** which include fees
5. **Use appropriate risk factors** - avoid extreme values that could lead to overexposure
## Disclaimer
This tool is for educational and planning purposes only. Always verify calculations manually and consider market conditions, liquidity, and other factors before placing actual trades. The script assumes that fees are charged on both entry and exit transactions.


RSI- RSI 8 Level Indicator
- Finally, The Bullish and Bearish 8 Level Power Zone indicator with alerts on each level!
Customize the colors however you like and remember if you need to set alerts you can also do that in the alerts section of the indicator. Just make sure what level the alert is for, and always look out for regular divergence, hidden divergence, and exaggerated divergence using this indicator that goes along with the power zones. :)
- RSI Strategy
Trading Bullish & Bearish Power Zones using regular divergence, hidden divergence, and exaggerated divergence.
P.s.
90, 80, 50, 40 Bullish Power Zones in green
65, 55, 30, 20 Bearish Power Zones in red

Breaker BlockA brand new script that correctly displays the current breaker block in play but also shows the previous 2 breaker blocks for both bullish and bearish scenarios.
This greatly improves my previous code that was used for Unicorn setups, I was not happy with the logic around the production of the breaker blocks.
A new Unicorn version will be published using this new logic soon.

Position Size Calculator with Fees# Position Size Calculator with Portfolio Management - Manual
## Overview
The Position Size Calculator with Portfolio Management is an advanced Pine Script indicator designed to help traders calculate optimal position sizes based on their total portfolio value and risk management strategy. This tool automatically calculates your risk amount based on portfolio allocation percentages and determines the exact position size needed while accounting for trading fees.
## Key Features
- **Portfolio-Based Risk Management**: Calculates risk based on total portfolio value
- **Tiered Risk Allocation**: Separates trading allocation from total portfolio
- **Automatic Trade Direction Detection**: Determines long/short based on entry vs stop loss
- **Fee Integration**: Accounts for trading fees in position size calculations
- **Risk Factor Adjustment**: Allows scaling of position size up or down
- **Visual Display**: Shows all calculations in a clear, color-coded table
- **Automatic Risk Calculation**: No need to manually input risk amount
## Input Parameters
### Total Portfolio ($)
- **Purpose**: The total value of your investment portfolio
- **Default**: 0.0
- **Range**: Any positive value
- **Step**: 0.01
- **Example**: If your total portfolio is worth $100,000, enter 100000
### Trading Portfolio Allocation (%)
- **Purpose**: The percentage of your total portfolio allocated to active trading
- **Default**: 20.0%
- **Range**: 0.0% to 100.0%
- **Step**: 0.01
- **Example**: If you allocate 20% of your portfolio to trading, enter 20
### Risk from Trading (%)
- **Purpose**: The percentage of your trading allocation you're willing to risk per trade
- **Default**: 0.1%
- **Range**: Any positive value
- **Step**: 0.01
- **Example**: If you risk 0.1% of your trading allocation per trade, enter 0.1
### Entry Price ($)
- **Purpose**: The price at which you plan to enter the trade
- **Default**: 0.0
- **Range**: Any positive value
- **Step**: 0.01
### Stop Loss ($)
- **Purpose**: The price at which you will exit if the trade goes against you
- **Default**: 0.0
- **Range**: Any positive value
- **Step**: 0.01
### Risk Factor
- **Purpose**: A multiplier to scale your position size up or down
- **Default**: 1.0 (no scaling)
- **Range**: 0.0 to 10.0
- **Step**: 0.1
- **Examples**:
- 1.0 = Normal position size
- 2.0 = Double the position size
- 0.5 = Half the position size
### Fee (%)
- **Purpose**: The percentage fee charged per transaction
- **Default**: 0.01% (0.01)
- **Range**: 0.0% to 1.0%
- **Step**: 0.001
## How Risk Amount is Calculated
The script automatically calculates your risk amount using this formula:
```
Risk Amount = Total Portfolio × Trading Allocation (%) × Risk % ÷ 10,000
```
### Example Calculation:
- Total Portfolio: $100,000
- Trading Allocation: 20%
- Risk per Trade: 0.1%
**Risk Amount = $100,000 × 20 × 0.1 ÷ 10,000 = $20**
This means you would risk $20 per trade, which is 0.1% of your $20,000 trading allocation.
## Portfolio Structure Example
Let's say you have a $100,000 portfolio:
### Allocation Structure:
- **Total Portfolio**: $100,000
- **Trading Allocation (20%)**: $20,000
- **Long-term Investments (80%)**: $80,000
### Risk Management:
- **Risk per Trade (0.1% of trading)**: $20
- **Maximum trades at risk**: Could theoretically have 1,000 trades before risking entire trading allocation
## How Position Size is Calculated
### Trade Direction Detection
- **Long Trade**: Entry price > Stop loss price
- **Short Trade**: Entry price < Stop loss price
### Position Size Formulas
#### For Long Trades:
```
Position Size = -Risk Factor × Risk Amount / (Stop Loss × (1 - Fee) - Entry Price × (1 + Fee))
```
#### For Short Trades:
```
Position Size = -Risk Factor × Risk Amount / (Entry Price × (1 - Fee) - Stop Loss × (1 + Fee))
```
## Output Display
The indicator displays a comprehensive table with color-coded sections:
### Portfolio Information (Light Blue Background)
- **Portfolio (USD)**: Your total portfolio value
- **Trading Portfolio Allocation (%)**: Percentage allocated to trading
- **Risk as % of Trading**: Risk percentage per trade
### Trade Setup (Gray Background)
- **Entry Price**: Your specified entry price
- **Stop Loss**: Your specified stop loss price
- **Fee (%)**: Trading fee percentage
- **Risk Factor**: Position size multiplier
### Risk Analysis (Red Background)
- **Risk Amount**: Automatically calculated dollar risk
- **Effective Entry**: Actual entry cost including fees
- **Effective Exit**: Actual exit value including fees
- **Expected Loss**: Calculated loss if stop loss is hit
- **Deviation from Risk %**: Accuracy of risk calculation
### Final Result (Blue Background)
- **Position Size**: Number of shares/units to trade
## Usage Examples
### Example 1: Conservative Long Trade
- **Total Portfolio**: $50,000
- **Trading Allocation**: 15%
- **Risk per Trade**: 0.05%
- **Entry Price**: $25.00
- **Stop Loss**: $24.00
- **Risk Factor**: 1.0
- **Fee**: 0.01%
**Calculated Risk Amount**: $50,000 × 15% × 0.05% ÷ 100 = $3.75
### Example 2: Aggressive Short Trade
- **Total Portfolio**: $200,000
- **Trading Allocation**: 30%
- **Risk per Trade**: 0.2%
- **Entry Price**: $150.00
- **Stop Loss**: $155.00
- **Risk Factor**: 2.0
- **Fee**: 0.01%
**Calculated Risk Amount**: $200,000 × 30% × 0.2% ÷ 100 = $120
**Actual Risk**: $120 × 2.0 = $240 (due to risk factor)
## Color Coding System
- **Green/Red Header**: Trade direction (Long/Short)
- **Light Blue**: Portfolio management parameters
- **Gray**: Trade setup parameters
- **Red**: Risk-related calculations and results
- **Blue**: Final position size result
## Best Practices
### Portfolio Management
1. **Keep trading allocation reasonable** (typically 10-30% of total portfolio)
2. **Use conservative risk percentages** (0.05-0.2% per trade)
3. **Don't risk more than you can afford to lose**
### Risk Management
1. **Start with small risk factors** (1.0 or less) until comfortable
2. **Monitor your total exposure** across all open positions
3. **Adjust risk based on market conditions**
### Trade Execution
1. **Always validate calculations** before placing trades
2. **Account for slippage** in volatile markets
3. **Consider position size relative to liquidity**
## Risk Management Guidelines
### Conservative Approach
- Trading Allocation: 10-20%
- Risk per Trade: 0.05-0.1%
- Risk Factor: 0.5-1.0
### Moderate Approach
- Trading Allocation: 20-30%
- Risk per Trade: 0.1-0.15%
- Risk Factor: 1.0-1.5
### Aggressive Approach
- Trading Allocation: 30-40%
- Risk per Trade: 0.15-0.25%
- Risk Factor: 1.5-2.0
## Troubleshooting
### Common Issues
1. **Position Size shows 0**
- Verify all portfolio inputs are greater than 0
- Check that entry price differs from stop loss
- Ensure calculated risk amount is positive
2. **Very small position sizes**
- Increase risk percentage or risk factor
- Check if your risk amount is too small for the price difference
3. **Large risk deviation**
- Normal for very small positions
- Consider adjusting entry/stop loss levels
### Validation Checklist
- Total portfolio value is realistic
- Trading allocation percentage makes sense
- Risk percentage is conservative
- Entry and stop loss prices are valid
- Trade direction matches your intention
## Advanced Features
### Risk Factor Usage
- **Scaling up**: Use risk factors > 1.0 for high-confidence trades
- **Scaling down**: Use risk factors < 1.0 for uncertain trades
- **Never exceed**: Risk factors that would risk more than your comfort level
### Multiple Timeframe Analysis
- Use different risk factors for different timeframes
- Consider correlation between positions
- Adjust trading allocation based on market conditions
## Disclaimer
This tool is for educational and planning purposes only. Always verify calculations manually and consider market conditions, liquidity, and correlation between positions. The automated risk calculation assumes you're comfortable with the mathematical relationship between portfolio allocation and individual trade risk. Past performance doesn't guarantee future results, and all trading involves risk of loss.


Moving Average Exponential//@version=5
indicator("ETH Scalping Strategy", overlay=true)
// Define the short-term and medium-term EMAs
ema9 = ta.ema(close, 9)
ema21 = ta.ema(close, 21)
// Define RSI
rsi = ta.rsi(close, 14)
// Define Buy and Sell conditions
buyCondition = ta.crossover(ema9, ema21) and rsi > 50
sellCondition = ta.crossunder(ema9, ema21) and rsi < 50
// Plot the EMAs on the chart
plot(ema9, color=color.green, title="EMA 9", linewidth=2)
plot(ema21, color=color.red, title="EMA 21", linewidth=2)
// Plot buy/sell signals as arrows on the chart
plotshape(series=buyCondition, location=location.belowbar, color=color.green, style=shape.labelup, title="Buy Signal", text="BUY")
plotshape(series=sellCondition, location=location.abovebar, color=color.red, style=shape.labeldown, title="Sell Signal", text="SELL")
// Generate alerts based on buy/sell conditions
alertcondition(buyCondition, title="Buy Signal", message="ETH Buy Signal: EMA9 crossed above EMA21 and RSI > 50")
alertcondition(sellCondition, title="Sell Signal", message="ETH Sell Signal: EMA9 crossed below EMA21 and RSI < 50")

HSHS Volume Divergence MTF v6 (Final Fix)HSHS Volume Divergence MTF v6
Zmienność
Dywergencja
Momentum
RSI

Range Breakout Statistics [Honestcowboy]
⯁ Overview
The Range Breakout Statistics uses a very simple system to detect ranges/consolidating markets. The principle is simple, it looks for areas where the slope of a moving average is flat compared to past values. If the moving average is flat for X amount of bars that's a range and it will draw a box.
The statistics part of the script is a bit more complicated. The aim of this script is to expand analysis of trading signals in a different way than a regular backtest. It also highlights the polyline tool, one of my favorite drawing tools on the tradingview platform.
⯁ Statistics Methods
The script has 2 different modes of analyzing a trading signals strength/robustness. It will do that for 2 signals native to the script.
Upper breakout: first price breakout at top of box, before max bars (100 bars by default)
Lower breakout: first price breakout at bottom of box, before max bars
The analysis methods themselves are straightforward and it should be possible for tradingview community to expand this type of analysis to other trading signals. This script is a demo for this analysis, yet some might still find the native signals helpful in their trading, that's why the script includes alerts for the 2 native signals. I've also added a setting to disable any data gathering, which makes script run faster if you want to automate it.
For both of the analysis methods it uses the same data, just with different calculations and drawing methods. The data set is all past price action reactions to the signals saved in a matrix. Below a chart for explaining this visually.
⯁ Method 1: Averages Projection
The idea behind this is that just showing all price action that happened after signal does not give actionable insights. It's more a spaghetti jumble mess of price action lines. So instead the script averages the data out using 3 different approaches, all selectable in the settings menu.
Geometric Average: useful as it accurately reflects compound returns over time, smoothing out the impact of large gains or losses. Accounts for volatility drift.
Arithmetic Average: a standard average calculation, can be misleading in trading due to volatility drift. It is the most basic form of averaging so I included it.
Median: useful as any big volatility huge moves after a signal does not really impact the mean as it's just the middle value of all values.
These averages are the 2 lines you will find in the middle of the projection. Having a clear difference between a lower break average and upper break average price reaction can signal significance of the trading signal instead of pure chaos.
Outside of this I also included calculations for the maximum and minimum values in the dataset. This is useful for seeing price reactions range to the signal, showing extreme losses or wins are possible. For this range I also included 2 matrices of highs and lows data. This makes it possible to draw a band between the range based on closing price and the one using high/low data.
Below is a visualisation of how the averages data is shown on chart.
⯁ Method 2: Equity Simulation
This method will feel closer to home for traders as it more closely resembles a backtest. It does not include any commissions however and also is just a visualisation of price reaction to a signal. This method will simulate what would happen if you would buy at the breakout point and hold the trade for X amount of bars. With 0 being sell at same bar close. To test robustness I've given the option to visualise Equity simulation not just for 1 simulation but a bunch of simulations.
On default settings it will draw the simulations for 0 bars holding all the way to 10 bars holding. The idea behind it is to check how stable the effect is, to have further confirmation of the significance of the signal. If price simulation line moves up on average for 0 bars all the way to 10 bars holding time that means the signal is steady.
Below is a visualisation of the Equity Simulation.
⯁ Signal filtering
For the boxes themselves where breakouts come from I've included a simple filter based on the size of the box in ATR or %. This will filter out all the boxes that are larger top to bottom than the ATR or % value you setup.
⯁ Coloring of Script
The script includes 5 color themes, each carefully created using color themes from the pantone color institute. There are no color settings or other visual settings in the script, the script themes are simple and always have colors that work well together. Equity simulation uses a gradient based on lightness to color the different lines so it's easier to differentiate them while still upper breaks having a different color than lower breaks.
This script is not created to be used in conjunction with other scripts, it will force you into a background color that matches the theme. It's purpose is a research tool for systematic trading, to analyse signals in more depth.
Metaverse color theme:
⯁ Conclusion
I hope this script will help traders get a deeper understanding of how different assets react to their assets. It should be possible to convert this script into other signals if you know how to code on the platform. It is my intention to make more publications that include this type of analysis. It is especially useful when dealing with signals that do not happen often enough, so a regular backtest is not enough to test their significance.

BTC/ETH RatioThis indicator allows us to calculate altcoin and bitcoin season from the btc divided by eth ratio. The golden ratio is 37!

Superdupermegadeduper signals by BrenFX# 🚀 Multi-Timeframe Scalping Strategy - Advanced Trading Signals
## 📋 OVERVIEW
The **Multi-Timeframe Scalping Strategy** is a comprehensive Pine Script v6 indicator designed for precision scalping on the 1-minute timeframe. It combines multiple timeframe analysis with advanced confluence filters to provide high-probability entry signals while eliminating false breakouts and wrong-direction trades.
## 🎯 KEY FEATURES
### ✅ **Multi-Timeframe Analysis**
- **1-Hour Trend Filter**: Uses 200 EMA to determine overall market bias
- **15-Minute Structure Zones**: Identifies key supply and demand levels
- **1-Minute Entry Signals**: Precise entry timing with multiple confirmations
### ✅ **Non-Repainting Technology**
- Uses only **confirmed, historical data** to prevent signal repainting
- All higher timeframe data uses completed bars only ( offset)
- Real-time performance matches backtesting results
### ✅ **Advanced Signal Filtering**
- **RSI Kernel Optimization**: Smoothed RSI with noise reduction for better reversal detection
- **Candlestick Pattern Recognition**: Bullish/bearish engulfing and rejection patterns
- **Stochastic RSI Crossovers**: Momentum confirmation from oversold/overbought levels
- **Volume Spike Detection**: Confirms signals with unusual volume activity
- **Price Structure Analysis**: Ensures signals align with market structure
### ✅ **Smart Zone Logic**
- **Supply Zone Detection**: Identifies resistance levels with strong bearish follow-through
- **Demand Zone Detection**: Identifies support levels with strong bullish follow-through
- **Zone Position Validation**: Prevents longs at supply zones and shorts at demand zones
- **Zone Reaction Strength**: Filters weak touches, only trades strong reactions
## 📊 SIGNAL TYPES
### 🟢 **LONG SIGNALS**
Triggered when:
- Price is above 1H EMA (bullish trend)
- Price reacts to demand zone
- Bullish candlestick pattern confirmed
- Stochastic RSI crosses up from oversold
- Optional: Volume spike confirmation
### 🔴 **SHORT SIGNALS**
Triggered when:
- Price is below 1H EMA (bearish trend)
- Price reacts to supply zone
- Bearish candlestick pattern confirmed
- Stochastic RSI crosses down from overbought
- Optional: Volume spike confirmation
## ⚙️ CUSTOMIZATION OPTIONS
### **Trend Filter Settings**
- Enable/disable 1H trend filter
- Adjustable EMA length (default: 200)
- Trend background visualization
### **Zone Settings**
- Zone lookback period (3-20 bars)
- Zone strength threshold
- Zone tolerance for price reactions
### **Signal Filters**
- **Simple Mode**: Basic reliable signals (recommended for beginners)
- **Complex Mode**: Advanced confluence filters (for experienced traders)
- RSI Kernel filter with customizable parameters
- Price structure and momentum filters
### **Risk Management**
- Visual TP/SL lines on chart
- Configurable risk-reward ratios (0.5x to 5x)
- Automatic position tracking
## 🔧 RECOMMENDED SETTINGS
### **For Beginners:**
- ✅ Simple Signal Logic: ON
- ❌ RSI Kernel Filter: OFF
- ❌ Price Structure Filter: OFF
- ❌ Volume Filter: OFF
### **For Advanced Traders:**
- ❌ Simple Signal Logic: OFF
- ✅ Enable all confluence filters
- Risk-Reward Ratio: 2:1
- Zone Reaction Strength: 0.8+
## 📈 BEST USED ON
- **Timeframe**: 1-minute charts (primary)
- **Markets**: Forex major pairs, Gold (XAUUSD), Major indices
- **Session**: High volatility sessions (London/New York overlap)
- **Pairs**: EUR/USD, GBP/USD, XAU/USD, NAS100, SPX500
## ⚠️ IMPORTANT NOTES
### **Risk Disclaimer**
- This indicator is for educational purposes only
- Past performance does not guarantee future results
- Always use proper risk management
- Test thoroughly before live trading
### **Technical Features**
- **No Repainting**: Uses confirmed data only
- **Real-time Alerts**: Customizable alert messages
- **Performance Optimized**: Efficient Pine Script v6 code
- **Visual Clarity**: Clean chart display with optional debug info
## 📱 ALERT SETUP
The indicator includes built-in alert functionality:
1. Enable "Alerts" in settings
2. Create TradingView alert on the indicator
3. Receive notifications for LONG/SHORT signals
4. Alerts include entry price, stop loss, and take profit levels
## 🎨 VISUAL ELEMENTS
- **Green Labels**: LONG entry signals
- **Red Labels**: SHORT entry signals
- **Green Lines**: Demand zones (support)
- **Red Lines**: Supply zones (resistance)
- **Blue Lines**: Entry price levels
- **Yellow Line**: 200 EMA trend filter
- **Background**: Trend bias coloring (optional)
## 🏆 WHAT MAKES THIS SPECIAL
1. **Multi-Confluence System**: Combines 6+ different signal confirmations
2. **Zone-Based Logic**: Trades only from key levels, not random price action
3. **Non-Repainting**: Reliable signals that don't disappear
4. **Beginner-Friendly**: Simple mode for new traders, advanced options for pros
5. **Complete Solution**: Trend, zones, entries, and risk management in one indicator
---
## 📞 SUPPORT & UPDATES
Follow for updates and trading insights. Questions? Feel free to comment below!
**Happy Trading! 🎯**
---
*Tags: scalping, multi-timeframe, supply-demand, RSI, stochastic, non-repainting, forex, gold, indices, Pine Script v6*

Bradley Siderograph - Future Projections█ Extended Version - Bradley Siderograph with Future Projections
This script builds upon my original open-source contribution: Bradley Siderograph and introduces a unique future projection feature that extends the Siderograph forward up to 500 bars on any timeframe.
Unlike the open-source version, this implementation is purposefully streamlined to focus solely on its projection logic that offers traders and researchers a unique forward-looking input that can be incorporated into broader analytical or forecasting frameworks. It is not intended to be relied upon in isolation, but rather as a supplemental lens into potential timing dynamics.
Original Description
This indicator functions as a Planetary Barometer, bringing the Bradley-Siderograph directly onto your TradingView chart. Designed for tracking the algebraic sum of planetary aspects and declination values in relation to market movements, it analyzes sidereal potential, long-term and mid-term planetary aspects, and the declination factor to provide insight into potential shifts in mass psychology. The built-in gauges act like a barometer, visually measuring the intensity and range of the components.
As Donald Bradley states in Stock Market Prediction:
"The siderograph is nothing more than a time chart showing a wavy line, which represents the algebraic total of the declination factor, the long terms, and the middle terms. It can be computed for any period—past or future—for which an ephemeris is available. Every aspect, whether long or middle term, is assigned a theoretical value of 10 at its peak. The value of the declination factor is half the algebraic sum of the given declinations of Venus and Mars, with northern declination considered positive and southern declination negative."
How the Bradley-Siderograph Works:
The Siderograph assigns positive and negative valencies based on the transits of inner and outer planets, categorized into long-term and mid-term aspects.
Each aspect (15° orb) is given a theoretical value, with the peak set at ±10. The approach and separation phases influence the weighting of each aspect leading up to its peak.
The sign of the valency depends on the type of aspect:
Squares and oppositions are assigned negative values
Trines and sextiles are assigned positive values
Conjunctions can be either positive or negative, depending on the planetary combination
Formula Used:
The Siderograph is computed as follows:
𝑃 = 𝑋 (𝐿 + 𝐷) + 𝑀
Where:
P = Sidereal Potential (final computed value)
X = Multiplier (to weight long-term aspects)
L = Long-term aspects (10 aspect combinations)
D = Declination factor (half the sum of Venus and Mars declinations)
M = Mid-term aspects
The long-term component (L + D) can be multiplied by a chosen factor (X) to emphasize its influence relative to the mid-term aspects.
How to Use the Indicator:
Once applied, the Siderograph line overlays on the chart, using the left-side scale for reference.
The indicator provides separate plots for:
Sidereal potential
Long-term aspects
Mid-term aspects
Declination factor
The indicator also marks the yearly high and low of the current year’s sidereal potential, providing a reference for when the market is trading above or below key levels. This feature was inspired by an observation made by Bradley in his book, which I wanted to incorporate here.
Users can fully customize the indicator by:
Switching between geocentric and heliocentric views.
Adjusting the orb of planetary transits to refine aspect sensitivity.
Multiplier (to weight long-term aspects)
Explore the Bradley-Siderograph and experiment with its settings.
Main Use Case
The Siderograph can be thought of as a psychological wind sock, gauging shifts in mass sentiment in response to planetary influences. Rather than forecasting market direction outright, it serves as an early warning system, signaling when conditions may be primed for changes in collective psychology.
As Donald Bradley notes in Stock Market Prediction:
"A limitation of the siderograph is that it cannot be construed as a forecast of secular trend. In statistical terminology, 'lines of regression' fitted to the market course and to the potential should not be expected to completely agree, for reasons obvious to everybody with keen business sense or commercial training. However, the siderograph may be depended upon to reward its analyst with foreknowledge of coming conditions in general, so that the non-psychological factors may be evaluated accordingly. By this, we mean that the potential will afford one with clues as to how the mass mind will 'take' the other mechanical or governmental vicissitudes affecting high finance. The siderograph may be thought of as a principle 'symptom' in diagnosing current market circumstances and as a sounding-board for prognoses concerning further developments."
Credits & Acknowledgments:
This is my implementation of Donald Bradley’s Siderograph, as described in Stock Market Prediction: The Planetary Barometer and How to Use It.
Built using the MLP 2.0 Astrolib library by @BarefootJoey . No modifications were made to the original library.

Nasdaq Macro Radar 3.5Nasdaq Macro Radar is an intraday tool that condenses five macro-drivers of the Nasdaq-100 into a single color-coded table:
• real-time moves in the 10- and 2-year Treasury yields
• dollar strength via the Dollar Index
• equity volatility level (VIX)
• risk tone in high-yield credit (HYG ETF)
• dynamic slope of the 2-10-year curve
Each cell flips from neutral to “long” or “short” on the fly, letting you see at a glance whether the macro backdrop is helping trend continuation or signalling a potential reversal.
• No extra pane – the table sits directly on your price chart and can be parked in any corner.
• All sensitivity thresholds are user-adjustable from Settings.
• Built-in alerts for the most critical levels.
Designed for scalpers and day-traders who need an instant macro check without juggling multiple charts
Nasdaq Macro Radar è un indicatore intraday che sintetizza, in un’unica tabella color-code, cinque motori macro-finanziari chiave per il Nasdaq-100:
• movimento dei rendimenti Treasury a 10 a & 2 a
• variazioni del Dollar Index
• livello della volatilità implicita (VIX)
• tono del mercato credito high-yield (ETF HYG)
• pendenza dinamica della curva 2-10 a
Ogni cella passa dal neutro a “long” o “short” in tempo reale, consentendo di valutare a colpo d’occhio se il contesto macro favorisce prosecuzioni o inversioni del trend di prezzo.
• Nessuna finestra separata: la tabella resta sovrapposta al grafico e può essere spostata in qualsiasi angolo.
• Parametri di sensibilità completamente regolabili dal pannello Settings.
• Alert integrati per le soglie critiche più importanti.
Pensato per chi fa scalping o day-trading sul Nasdaq e vuole un check macro immediato senza aprire dieci grafici di supporto.

Swing Crypto Bot – Extended Patterns + Three Outside UpSwing Crypto Bot – Extended Patterns is a Pine-Script indicator that automatically scans for seven high-probability bullish setups and only signals when multiple conditions align. Here’s an advanced overview of how it works under the hood:
1. Multi-Factor Filters
Trend Filter: Price must be above the 50-period Simple Moving Average.
Volatility Filter: Price must also break above the upper Bollinger Band (20,2) to catch momentum expansions.
Momentum Filter: RSI(14) is constrained to between 45 and 80, avoiding both extreme overbought and oversold readings.
Participation Filter: Current bar’s volume must exceed its 20-period moving average.
2. Seven Candlestick Patterns
The script codes and counts each of these classic bullish reversals:
Hammer – a long lower wick (≥2× body) after a downtrend.
Bullish Engulfing – a green body fully engulfing the prior red body.
Bullish Harami – a small green body contained within the prior red body.
Morning Star – a three-bar sequence: a down bar, a neutral/doji bar, then a strong up close above mid-point.
Three White Soldiers – three consecutive long green bars each closing higher than the last.
Tweezer Bottom – two bars with identical lows and the second bar green, marking a double-bottom.
Three Outside Up – three bars: a red bar, a green engulfing bar, then a third green bar closing above the engulfing high.
Each pattern sets its own Boolean flag (hammerOK, engulfOK, etc.), then the script tallies how many of the seven are true on that bar.
3. Pattern Naming Logic
If exactly one pattern flag is true, the indicator labels it by name (“Hammer”, “Engulfing”, etc.).
If more than one triggers simultaneously, it displays “Mixed”.
If none are found (even if the bar meets other filters), it shows “None”.
4. Scoring & Signal Logic
The script awards 1 point each for:
Price > SMA50
Price > Upper BB
Volume > MA(20)
RSI in
Any of the 7 patterns detected
A buy signal fires only when the bar is the last bar, and the score ≥ 3.
5. Risk Management & Alerts
Stop-Loss = 1.5 × ATR(14) below entry (automatically guaranteed to be below current price).
Take-Profit = 2 × that ATR-based risk (ensuring a minimum 2:1 RR).
On the final bar, the script plots:
A 🔥 flame icon above the bar.
A single info bubble showing
By layering trend, momentum, volume and 7 distinct candlestick patterns into a concise entry rule with built-in TP/SL, this script gives swing traders a comprehensive, multi-signal alert system—all visible at a glance on your chart.

Session Dividers for Yr/Qtr/Month/Week/Day by EasycatorsThis indicator provides custom dividing lines between important periods like day/week/month/quarter/year that make it easy to distinguish a new day from a new week or month or year with thickness, style, and color.
There are several indicators in the library that attempt to do this but fail. I got tired of it so I decided to make one that looks good and just works.
Human markets are cyclical, following the rhythm of life, and so I like to see the cyclicality of market price action, to be able to compare the current period to the same period last week or last year. So making it easy to see when each period repeats is important.
So Easycators Dividers shows dividing lines between periods (day, week, month, quarter, year). As you move your chart up to higher timeframes, lines intuitively disappear so your screen stays uncluttered while still telling you what you need to know.
EZ_Dividers also allows displaying background colors for each period, either with or without lines, if so desired. You can have a custom background color for each day of the week (intraday charts) and each month of the year (daily/weekly charts).
It also provides optional, unobtrusive text labels, showing the name of each weekday and month, at the top and/or bottom of your chart (your choice which goes where).
You can set all colors and transparencies text, lines, and backgrounds to suit your needs ... no hard-coded colors. All line and background colors are specified individually, and the color applied to all the text labels can be specified as well.
You can set the line style differently for each different period: perhaps solid for years, dashed for quarters, dotted for months, whatever you want.
You can turn any lines or backgrounds or labels on/off as needed.
You can enable/disable lines for years, quarters, months, weeks, and days.
You can set what day of the month to display the month names (15th by default).
You can set what hour of the day to display the weekday names (12:00 noon by default).
You can also set a specific hour to rollover the day instead of the default exchange rollover.
Check it out, and I hope this helps you all as much as it has me!

Goldbach Algo 2 – Buy/Sell Signals | NAS100 BTC SPX XAULadies and Gentlemen,
I'm proud to present the Goldbach Algo 2 Indicator , a precision-based, algorithmic Buy/Sell signal tool specially optimized for NAS100, SPX, BTC, and XAUUSD.
This tool is built for serious traders who want clean, rule-based entries and confirmation-driven setups, without relying on lagging indicators. It operates using structured Goldbach ranges and PO3 logic, mapping engineered price delivery across fractals like 243, 729, and 81.
This tool is built around Goldbach-derived PO3 ranges and reflects how algorithmic price delivery reacts within key zones of liquidity. It's ideal for traders who seek clarity, structure, and a logic-driven approach — not noise or guesswork.
This is not a repainting or lagging indicator. It’s a logic-based signal engine that uses PO3 behavior inside mathematically defined dealing ranges — originally optimized for 243 (default), but fully customizable to fit your strategy and asset.
⚙️ How It Works :
The indicator reads algorithmic behavior using PO3 structure inside fractal-based price ranges such as:
243 (Default)
81 (Good for Gold / XAUUSD)
729 (Macro confirmations)
27 or 162 (Advanced fine-tuning)
The default PO3 range is 243, which works well with NAS100 and trending indices.
However, Gold (XAUUSD) traders may find more signal clarity using 81.
You can adjust this easily inside the settings panel.
📈 Suggested Timeframes:
1–5 min: Scalping or NY Open setups
15–30 min: Intra-day confirmation
1H–4H: Macro trend & swing trade clarity
🧠 Assets That Work Well:
NAS100 (optimized)
XAUUSD (set PO3 = 81)
BTCUSD
SPX / S&P500
...and any instrument that respects structured algorithmic delivery
We recommend testing different PO3 settings per asset during your trial. This allows you to dial in the range that gives clean signals for your preferred market.
📊 Using the Goldbach Algo 2 Efficiently
This indicator was made for real traders — those who understand the value of alignment. You can combine the Buy/Sell signals with your own ICT-style session timing, such as New York Killzone or Tesla 3-6-9 timing models, to build high-probability entries. The goal is not just to trade randomly, but to enter with the trend, not against it.
Backtesting is strongly encouraged. Use the tool to identify manipulation sweeps and take trades that align with session-based reversals, Goldbach range taps, or PO3 formations.
🎛️ Custom View Options (Settings Tab):
PO3 Range: Default is set to 243, but you can change it freely to any fractal range like 81, 729, or 27 to suit your asset.
Goldbach Zones & Lines: Toggle these on or off to clean up your chart or track engineered levels more clearly.
Signal Style: Choose between Buy/Sell text labels or simple green/red circle signals for visual clarity.
Zone Colors: RB, OB, FV, MB, BR, LV zones are all color-coded and editable.
Whether you’re trading XAUUSD with 81 or NAS100 with 243, this indicator flexes to fit your structure.
Backtest, align, and confirm — and use it to support, not replace, your existing system.
⚠️ Important Note:
This is not financial advice.
All trading carries risk and past performance is not indicative of future results.
Use this tool as a confirmation layer within a well-structured trading system.
🔐 Access Info:
🤝 Try It FREE First — No Pressure
You're encouraged to try this tool at your own pace. Use the free trial period to calmly test how well the signals align with your personal strategy and market style . Whether you're trading NAS100, SPX, BTC, or XAUUSD — see for yourself how the indicator fits into your existing routine. Only when you're confident it adds value should you consider unlocking full access. No pressure, no rush — just precision and clarity.
💬 If you find it useful, we can discuss a one-time access fee — no monthly charges, no pressure. I want you to feel confident before committing.
📩 Contact me anytime here on TradingView (DM) or via Discord / YouTube (see bio/profile for links).
Thank you , traders. Enjoy the tool, and Good luck in the markets!

Candle box - All SessionsCandle Box – All Sessions + Weekday Filter
This indicator automatically draws boxes on your chart, highlighting custom sessions based on user-defined start and end times.
For each selected session, it visually marks the high and low of the opening candle from your chosen timeframe, making it easy to analyze volatility, breakouts, and ranges.
Key Features:
Full Time Customization: Choose the start and end hour/minute for your session boxes.
Reference Candle Timeframe: Select which timeframe’s high/low to use (e.g., 5min, 15min, etc).
Weekday Selection: Display boxes only on the days of the week you want—any combination of weekdays and weekends.
Session History: All previous session boxes remain visible on the chart, allowing easy review of price behavior across multiple days.
Visual Customization: Adjust border color, background color, and border width for each box.
Typical Uses:
Highlight volatility during key market sessions (e.g., NY Open, London, Close, etc.).
Mark opening ranges for daily or any custom time window.
Identify breakout and consolidation patterns across sessions.
How to Use:
Add the indicator to your chart.
Configure your preferred start/end time, reference candle timeframe, visual style, and select the days of the week.
The indicator will automatically draw all session boxes for both current and past days, making market structure and session dynamics instantly clear.
