the latest pattern shows a more bearish signal. unless something changes within the turkey government. I don't see any lira recovery happening soon. on the bright sight. we can now travel to turkey like a rockstarts
so much so investors want to be bullish on tech, looking at this chart, without forcing any wave count I see apple stock to have one more drop to complete wave c of (Y)
here is an update from my last analysis. it seems to me now Apple forms a continuous pattern. we can leverage on this structure.
the very nice impulsive rally from Oct 2022 to Feb 2023. It took about 76 trading days to complete such a move. price drop exactly after such a period. if you are a student of time and cycle, you won't be surprised by the precision of the move. right now we are looking for a dip into the grey box area and i assume it will complete soon and ready for a rally.
not your typical cow horn. this is a chart pattern. a horn when interpreted in Elliott wave structure, is actually a 12, 12 wave structure. a measure moved will bring the price to $313 lets see how it goes.
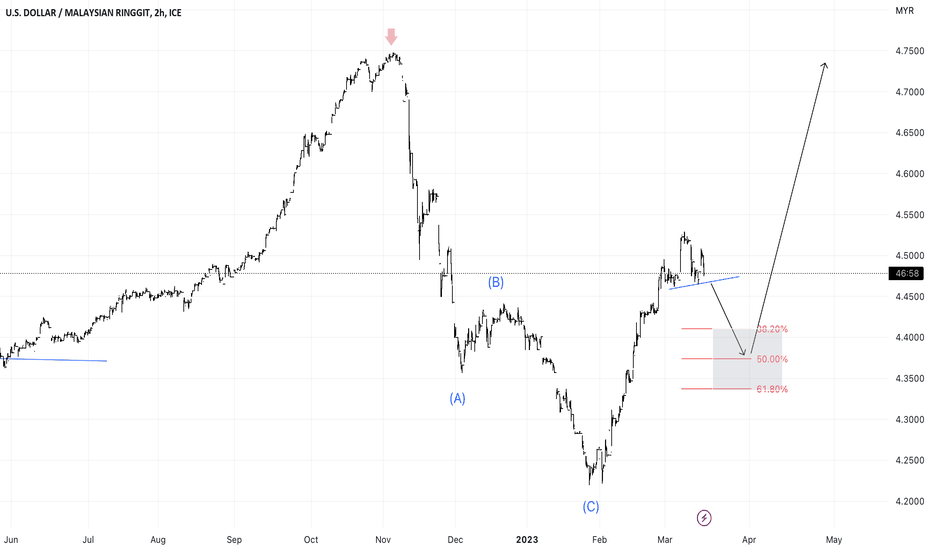
A drop from Nov 2022 peak (red arrow) shows a 3-wave ABC corrective move. this follows by an impulsive move (5 waves) starting Feb 2023. we might see a temporary pullback, a break below the head, and should pattern to RM4.3 before moving higher.
the story started with a very wide-inversed H&S, well in Elliott wave this pattern indicated a turning point for an impulsive 12345 or ABC corrective wave judging from the price move in 2023, it seems to me NVDA falls into the impulsive wave category. yesterday we had a nice BO from the megaphone structure. while the immediate target is around $266. but I want...
QQQ, the move from 13 Oct 2022 looks like a corrective. therefore, the recent breakout from the flag will at least make a measure to move the target to $340. if the price moves beyond $350, I will consider this as an impulsive move and we will see QQQ re-throne its previous glory (ATH)
This bitcoin set up based on inversed head & shoulder. once the price closed above the neckline, I can see bitcoin returning to $34K.
for this pair, im looking at price to make 1 more leg down to the box area to complete a standard correction. but the yellow highlights area must complete before we look for a drop to the grey box.
I presented two possible moves for GLD. I know many traders have been positive on gold lately due to bank runs. the dip in the month of Feb shows an impulsive move. I most preferably another move to the downside (inside the grey box area) before a rally continuation. however, if the price breaks the blue box, I think gold will continue to go higher. (alternate...
judging from the yellow area. it seems to me a sideway corrective wave structure which was completed at around $10.28. I'm more bearish on these stocks as compared to tesla (my earlier analysis
Grey box act as support. currently looking at a corrective move to the support zone (grey box) if the price goes below my invalidation line, (dotted red line) then we should look at a more complex and deeper correction.
I'm expecting a pullback to the grey box to complete the correction for the five wave moves.
currently, the price is still within the long-term channel. the grey box is where price should find support to spring up to wave 5 (red) of (3)
Channel breakout. 5 waves impulsive move to the upside. we might see pullback to the grey box to complete wave (2)
Hang Seng Tech Price broke out from a long-term down-sloping channel (since 2021). the recent price advance since Oct 2022 shows a 5-wave impulsive move. Therefore I believe the bottom is over.


