2017-2020 Bitcoin = 1998-2007 Amazon Fundamental Similarities Dot.com stocks: Big learning curve Undoubtably huge interest + optimism within the community Massive potential growth + benefit to society Cryptos: Big learning curve Undoubtably huge interest + optimism within the community Massive potential growth + benefit to society Are cryptos similar to...
NVDA 1M: 2016 - Price formed "U" at/below previous ATH. Slow Stochastic hit overbought then formed "U". Price then broke the ATH and the following bull run lasted 2.4 years and returned 600%+. 2020 - Price formed "U" at/below previous ATH. Slow Stochastic hit overbought then formed "U". Price then broke the ATH. The 2020 NVDA chart + indicators share many...
Interesting correlation between Tether market cap and BTC price action. So far in 2020, Tether market cap pumps have acted as a precursor to big BTC rallies. Tether market cap pumped on: 1/6/20: BTC rose 43.06% 4/1/20: BTC rose 56.9% Average 2020 BTC move following a Tether market cap pump = 49.98% We just saw another Tether market cap pump on 5/14/2020. If the...
On the left: We have a 5 wave move up and are finishing our ABC correction. 2009-2020 bull run fib retracements in black. Statistical probability of finding a bottom at specific zone, labeled in blue. We found a bottom on march 23rd in the 60% chance zone. On the right: Zooming into the correction The correction appears to be a Elliott Wave regular flat...
Nvidia is forming a cup and handle pattern on the weekly and daily chart. Daily cup and handle: Above Weekly cup and handle:
printing a 3-3-5 Elliott Wave correction. -30% from highs. this may be one of the best long term buy opportunities.
Decreasing demand + increasing supply as the world transitions away from fossil fuels. Corona virus is decreasing demand for airlines/cruise ships/travel companies and therefore accelerating the decline in demand for crude oil. The decline in crude oil is inevitable. Long term short.
Bitcoin Monthly Slow Stoch Analysis: Bitcoin 1st peak: 1M slow stoch bearish divergence (2013) Bitcoin 2nd peak: 1M slow stoch wedge breakdown (2017) Bitcoin 1st bottom: 1M slow stoch oversold (2015) Bitcoin 2nd bottom: 1M slow stoch oversold (2018) Bitcoin is printing a 1M bullish slow stoch cross (4 more days until the monthly candle close) Bitcoin halving...
Bitcoin forming a bull flag. Elliott Waves say new all time high coming. Buy every dip.
Strong buy signal showing up on $GBTC. Price touched the 21 week MA and looking for a bounce. Elliott Wave: entering wave 3. T1: $33 T2: $50s T3: $60s
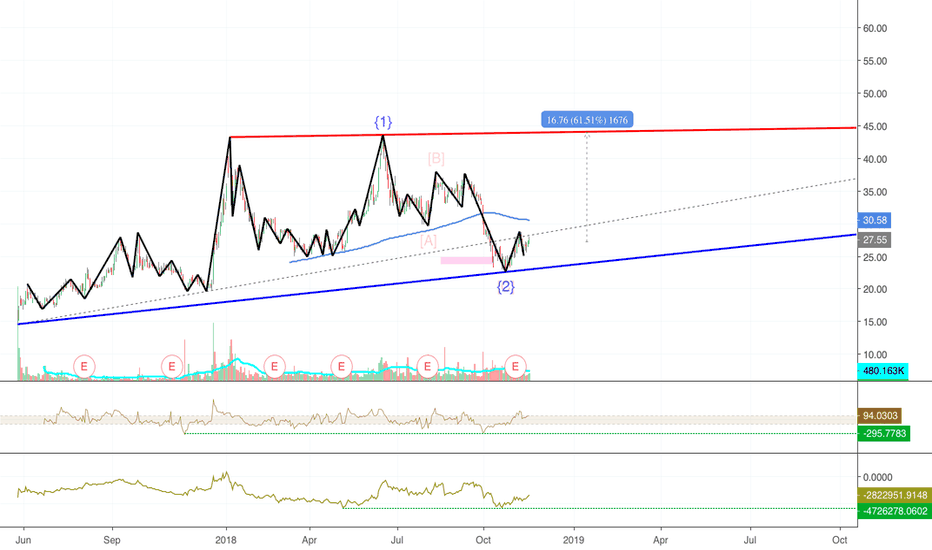
Wave #3 targets do not fit on screen. Should see mid/longer-term sideways action in this triangle ($25-$45 Range) until the eventual breakout. 60% move would bring us to the top of the consolidation pattern. A breakout of this pattern will bring in massive gain. Breakout Targets: T1 $60, T2: $100. T3: $125
Here's my guide I'm using for $BCH for the next 6-7 months. Catalysts Cashscript Bitcoin Cash City November network upgrade April 2020 halving Expected peak: 45 days before the halving (end of February) T1: $974.31 T2: $1,418.84 T3: $1,863.37 T4: $2,138.09 Bitcoin Cash 2019 growth is impressive. I believe Bitcoin Cash is the most overlooked coin in...
Wave 1 completed. Wave 2 cannot drop below $45 or chart is invalidated. Wave 3 targets below. T1: $175 T2: $250 T3: $350 *In case this is an ABC, I added wave C targets. Wave C targets should act as short term resistances and I'm expecting price to break through these.* 1D RSI oversold
BCH finding support at the 200 day MA and 2019 trend line. BCH 1D RSI oversold. BCH 1D bullish slow stoch cross. Target $550 note: may go higher
In part 1, I analyzed the market caps of Bitcoin Cash 2019 to Ripple 2017 In part 3, I'm analyzing the price action of Bitcoin Cash 2019 to Ripple 2017 BCHBTC 2019 = XRPUSD 2017 1. Same pattern: sell off into M pattern 2. Identical 200D EMA 3. Identical 200D EMA breakout and breakdown 4. Identical 4 touch support found BCHBTC 2019 = XRPUSD 2017 Next move: a...
Bitcoin cash has been trading this triangle since the December 2018 low. I am looking for a high volume breakout with conviction to confirm pattern otherwise I will be trading my targets on my previous chart linked below. Ascending triangle breakout target: $800s Elliot Wave targets: $520-$960 (boxes on chart)
Coinbase: When Wave 3 is less than 1.62, the 5th Wave overextends itself. From research, the ratio of Wave 5 will be based on the entire length from the beginning of Wave 1 to the top of Wave 3. Extended Wave 5 = either 0.62 x length (beginning of Wave 1 to top of Wave 3) or = length of (beginning of Wave 1 to top of Wave 3) or = 1.62 x length of (beginning of...


