w00fs
Look I don't relly know shit, but I feel like I have learnt a few things these past couple months, and that is that entering a long position now would not be a great idea, unless it took out the ATH and kept going that would be safe, or if it hit some lower supports that would be good time to go long as well, until then try to avoid FOMO and if anything go Short,...
If it holds support on that grey line then it looks like it would form a wedge with the point of it occuring between 4 to 11pm on Oct 1 , could hone it in more if I wanted....but cbf
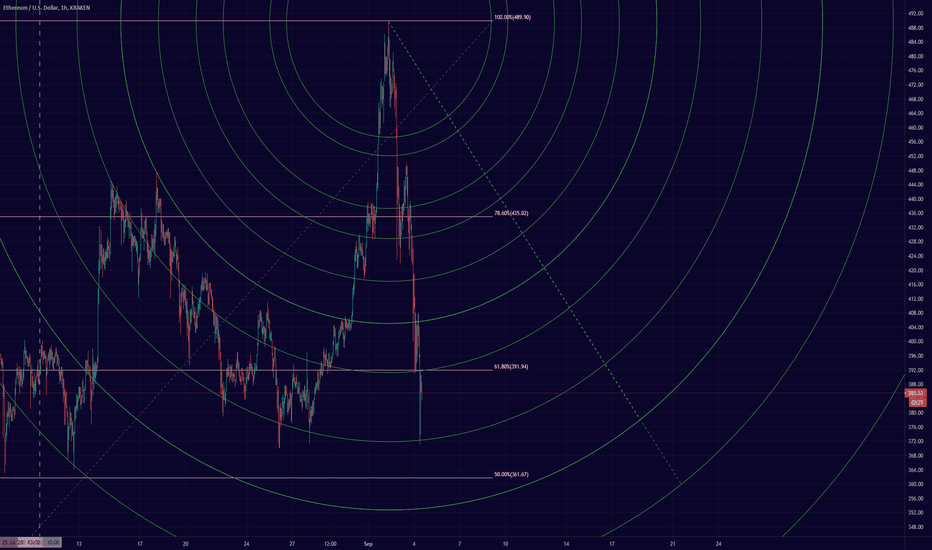
Expecting it to drop to the 50% retracement level, the minute chart shows it wanting to go down. Quantify Crypto has it at 36.5 which is the lower end of Neutral, but with BTC the way it is I think it's fairly safe to say it is still very much bearish.
Focusing more on ETH right now but this chart is picking up the BTC resistance points, Quantify Crypto still has it sitting at 3.0 which is extremely bearish so would expect it to drop to the next one at least
Current support lines I'm using. Worried that if NASDAQ does correct the effects will flow to btc..although it hasnt gone up with it soooo
Between that wedge and it's score on quantifycrypto.com I thought it would be good to hold a little bit of this, have set an alert to check it's score if it touches that lower support
Haven't spent much time charting this (or anything) today, it is sunday afer all, but noticed this straight away and at time of writing it is struggling at the the exact intersection of that arc at $11620 so thought it was worthy of publishing.
Stayed tuned for my upcoming release 'SXP: Why Do You Hate Me', in all good record stores soon. but also this:
Kind of hard to decide what arc to actually go off because nothing looks super perfect but this I would rate this as 'pretty good'. Just wait and see I suppose, personally I reduced my position a bit just so I wasn't over leveraged. Really need to get my coding skills up to scratch so I can actually play around with the blockchain tech instead of charting coins !!
No great insights into it, just thought this chart was interesting, really hoping it doesn't keep being a c*nt because if it goes to 10400 on Sept 4 that's my position goooooone. ((ok maybe that does count as an insight, but it's not one I like))
LEND looking like it's coming to ahead, breakout from the wedge in about 3 to 4 hours, although if it doesn't crack at the edge of that arc I'd expect it to do so 5pm tomorrow (UTC+10). Although I'm still learning and playing around so I'm not saying it with a lot of certainty, but I'll be chuffed if I'm right! The arcs without a background are the expected upper...
Could have a winner with this chart, it resisted at that first line and has now poked through, lets see if it closes above
I feel pretty confident in the support levels drawn, probably more so if it breaks upwards - provided it breaks in the next couple hours. Another possibility is this and that probably looks better for if it drops. Won't really know until it happens and can see which one it decides to follow. LEND is also doing something similar right now, might chart it properly...
It's a graph like this which is most promising to trade with Futures! Clear support, and a 3% difference, so good to trade over a couple hours, but requires alot of attention because if it breaks up or down you don't want to be too slow to react (this trend started at midnight for me so I couldn't do anything fancy with it, but I have a long in place anyway :D )
Gah I was too impatient yesterday, should've backed myself! I noticed that all the alts retraced 50% from their highs when they had a major correction, so I had a short running on DOT and a couple others, but canned most of them too early. DOT and THETA were probably the best looking for a short yesterday. Kind of wondering if it'll test the 50% retracement if...


