I am BEARISH BONDS NOW The chart posted is the 1yr Tbill rate we seem to have a LOW in place This should be clear over the next 10 TD
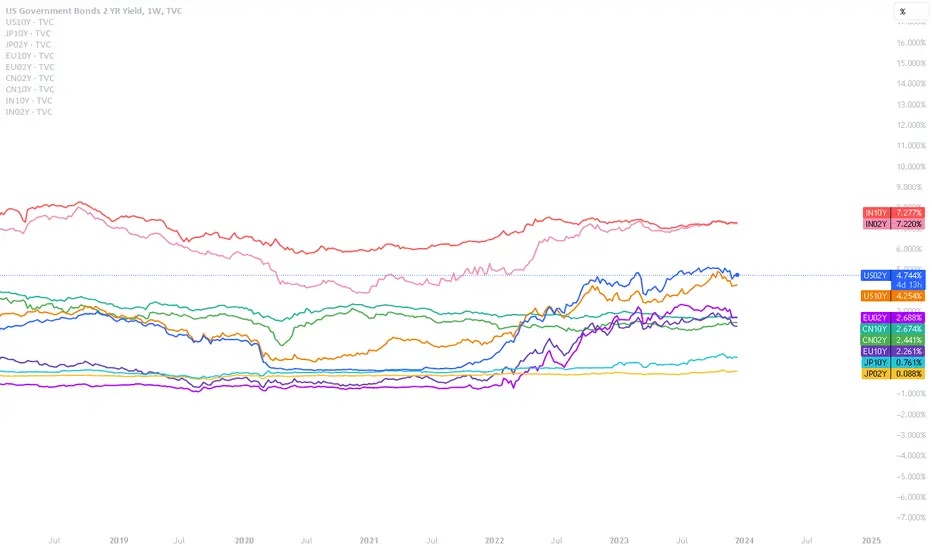
Government bonds

US Dollar Index vs 10Y-03M Yield curve (LEADING Indicator)The real U.S yield curve (Blue) suggests that the U.S. Dollar (Yellow) may weaken over the next 12 months.
The main beneficially will be Japanese YEN who haven't moved monetary policy for over 42 years. Currency pairs are relative to move so I see the Yen appreciating, followed by the EUR.

Most important chart to check BEFORE any other market!After 4 years of upward movement and reaching the ceiling of 5% yeilds.
Considering the momentum of the current downward trend from the 5% resistance, as long as the wave counting is considered correct and not violated, all financial markets, especially bitcoin, gold, and the US stock market for about the next year (2024) may be ascending
IF the bonds break the 5% resistance, the whole scenario is cancelled
Keep in mind that the amount of money printed and available to large investors to enter the financial markets is much more, and this can have much more extreme movements with it.
But beyond these cases, finding suitable entry points for each market is a completely separate and important issue that must be examined separately.
Neither gold nor Bitcoin are good places to buy now.

US10Y Bond SHORTBased on my analysis the US10Y Bonds has been in a bearish direction. Price broke the bullish uptrend towards this last quarter of 2023. I predict that it can go lower than 4%. I don't see it going back up close to 5% anytime soon. The Feds meeting this week will most likely have it go higher just to finish out the retrace between 4.2% and 4.3%. We are also in the biggest bear market for bonds in history.

Jay just turned off the musicSo I think we all understand that the ship has changed course. Fed comments yesterday caused some real margin calls. Lots of folks on the wrong side of that one. Lay either of these charts against the S&P and I think its plain to see we are ready for a pullback soon.

US10Y ~ Bullish Downtrend Reversal (2H)TVC:US10Y chart mapping/analysis.
US10yr bond yields finding bullish reversal off lower range of descending parallel channel (white) - further momentum pending upcoming 10yr auction + US economic data.
Trading scenarios into EOY:
Bullish reaction to macro economic news = continued momentum to break above descending trend-line (white dashed) towards 38.2% resistance zone.
Bullish extension target(s) = re-test upper range of descending parallel channel (white).
Bearish reaction to macro economic news = reversal back below 50% Fib / 4.10% psychological support level / lower range of descending parallel channel (white) / ascending trend-line (green dotted) confluence zone.
Bearish extension target(s) = Golden Pocket zone / 4% psychological support level / 78.6% Fib.

US10Y vs. SPX ~ Inverse Correlation/Ratio Indicator (Dec 2023)TVC:US10Y versus SP:SPX inverse correlation analysis.
Work in progress indicator for anticipating market trend switches.
Notes:
Emerging correlation identified within US10Y/SPX ratio.
Spikes in ratio (orange vertical line, dotted) aka bond yield ROC/volatility = higher probability of risk-off sentiment (ie big tech & growth stock rotation).
Correlation only valid when market is "hyper-sensitive" to bond market fluctuations, especially during recent US Fed undertaking rate hike cycle.
Should be used in conjunction with other confluence factors to provide conviction in swing/position trades.

Bund StepsA simple representation of potential support and resistance zones (larger rectangles) projected in time, meaning once the price is past their time zone, the price levels might not hold the same amount of relevance. Looking for price action with potential candlestick patterns for reversals (pivot points), also looking for candlestick shadows at the shapes.
Small rectangles pose just as milestones or guiding elements for potential price tendencies. Icons are usually potential price predictions/projections in time but a hit is not required.
Considering the overall picture the main scenario might suggest resistance zone at the red rectangle, and support level at the blue, with overall tendency pointing upwards through the orange rectangles toward the Target Icon. A short at the red might be too bold for the swing trader even though the recent general move was downwards, from 133 to 127. The blue rectangle is also quite low, and there is the possibility of having a pivot point above it, without it ever being touched.
This is a continuation of the previous Matrix project on this market. (Linked Idea)

BRR pattern points to a true Santa rally for bonds. A rare chart pattern second in predictive power to only the famous head and shoulders is the Bump and Run Reversal (BRR) technical pattern.
school.stockcharts.com
If it is so powerful, why is it so unheard of?
1) They are rare. But a recent BRR of very high consequence is the 2022 DXY chart.
2) They usually only occur on high time frames as they measure manias and blow off tops, or in the inverse, manic selling followed by a return to normal.
3) They are hard to chart
4) They give predictive power in terms of time, not in terms of a "measured move" of price, but in the other dimension time.
This chart shows a clear BRR reversal, 55 days in the manic up pattern, the "bump". 55 Days in the return to trend or "run". Which would create a 10 year US Treasury bond rally and likely a rally in risk on assets. Which lands us, perfectly, at yields dropping until Monday December 25th 2023.
Merry Christmas Traders!

2Y Yields LowerTVC:US02Y
2Y Yields heading lower.
Sometime over the next 12-18ish months, I believe we'll see 2Y yields fall to 200-275 bps.
Headline inflation numbers are lower and dropping.
The Fed has effectively pulled a rabbit out of a hat in the act of raising interest rates by ~500+ bps, while avoiding the obliteration of the economy. (thus far)
If the economy does falter in the coming months; the Fed will lower rates.
(No further explanation needed)
Despite the endless repetition of "higher for longer" from Fed officials; I believe that the Fed will lower rates even if the economy and markets remain strong.
The establishment powers in the political & financial world's that the Fed straddles both crave the same thing... Cheap Debt.
In addition to this, there are over $34+ Trillion reasons to lower rates as soon as possible.
Not to mention, the upcoming election...
The market is anticipating lower yields as well.
We're seeing the market preemptively increase exposure to interest rate sensitive assets.
(i.e. - tech stocks, indices, cryptos, beaten down govt bonds, etc.)
On a technical basis, the weekly chart of 2Y Yields is showing substantial bearish divergence.
Weekly RSI shows a bearish RSI Swing Rejection (March '23 and October '23 highs)
The 50% & 61.8% Fib levels give us a target of 200-275 bps.
The median line set suggests that yields could arrive at the target area sometime between May '24 - May '25.
Conclusion: Short Yields.
Fat_Fat

Treasury Yields flash bottom signs, early for some + DXY leadingJUST SAYING.......
NOT implying that the party is over BUT heed some signs by treasury.
1Yr #yield is fighting to close above the 10day Mov Avg (RED).
2 Yr has a possible 3rd day trading above the RED Mov Avg.
10Yr fighting to get above the recent trend it broke & Moving Avg's.
US #Dollar has been fighting & looks to be gaining momentum. We'll see how this does over next few days to get barometer.
TVC:DXY TVC:TNX

US 10Y TREASURY: FOMC meeting aheadThe yields on the US Treasuries continued to slow down during the course of the previous week. However, a strong US jobs data posted on Friday, made an impact on 10Y yields to revert a bit toward the higher grounds. Although the US equities were supported by the same news, investors in the Treasury bonds still hold a dose of reserve when it comes to the future economic conditions. Namely, as job data remains strong, there is a fear that the Fed might tighten further in order to sustain their 2% inflation goal.
The 10Y Treasuries started the previous week around 4.29% yield. As the week progressed, yields reached the lowest weekly level at 4.10%. However, at Friday`s trading session, they reverted a bit back, ending the week at 4.23%. Regardless of this small reversal, the markets are still generally oriented toward the downside. The market is still pending testing the 4.0% level, which might occur during the following week or two. At the same time, charts are pointing that some short reversal might lead yields shortly toward the 4.3%, less likely 4.4% level, before they make a final reversal toward the level of 4.0%.

Why is US 10Y yield Coming own fast?Is market moving to safe asset, the US dollar. Is market moving to safe asset, the US dollar. Is market moving to safe asset, the US dollar. Is market moving to safe asset, the US dollar. Is market moving to safe asset, the US dollar.
US Debt to GDP vs. 10 Year Treasury Note YieldSimply showing trend changes in long term inflation / interest rates.

Never disregard those weekly & monthly closeSTHOSE LONG TERM TRENDS ARE IMPORTANT.
Remember how the 10 & 30 Yr #yield BROKE daily trends?
Well, they are both still in play, for TVC:TNX it is in better shape.
Let's see how they close.
30 Yr struggling a bit more to recover that close under the trend.
#mortgage rates have also fallen decently.

BondsUS10Y breaking support. Good entry on bond etf's. Only picking up a small amount to get in the door. ZROZ, EDV, and TLT.

UK Bond Next StepsThe rectangles are potential zones of support/resistance. They also indicate potential tendencies of the sentiment of the market through the pairs of similar color and their relative position (going up or going down). Icons are relative price predictions in time, similar to targets that can be hit. Around the marked time stamps potential pivot points or exceptional events can occur.
This is a project similar to previous ones (Matrix Style) and is also looking at candlestick patterns near the shapes, rebounds or bounces with candlestick shadows, or small coincidences in the price action relative to the elements in the snapshot. This is for the swing trading enthusiasts that seek to maximize gain and minimize risk. For better understanding the general context and approach, the linked idea with previous results can be analyzed.
Always trade with a plan, manage risk, asses all probabilities, and may the force of profits be with you!

EU 30Y Bond Yield to extend further into 2008 high in 2024Economic
Policy needs to remain restrictive or should tighten further, until clear signs of easing inflationary conditions are available.
Technicals
Favor: Strong yearly candle
Favor: Strong M BiMS
Favor: M BiMS after ATL
Favor: Multiple BSL Levels higher
Currently at 10Y High
Expectation
Downside Retracement Targets (careful Short Term)
1 - 2.057% (Y SIBI Inverted) - 95% Certainty
2 - 1.625% (Target (already traded to)) - 75% Certainty
3 - 1.330% (MT Recent Upswing based on Y H to L) - 65% Certainty
4 - 1.149% (MT Recent Upswing based on Y Bodies) - 55% Certainty
5 - 1% (Beginning of Grind upwards) - 25% Certainty
Upside Targets (After Downside)
1 - 3.160% - Y 2023 High - 95% Certainty
2 - 4.915% - 85% Certainty
3 - 5.738% ( Fib 1.618 Extension) - 65% Certainty
4 - 6.258% (23Y High) - 35% Certainty


US10Y Is this the end of Bond Yields' 3.5 year run?The U.S. Government Bonds 10 YR Yield (US10Y) is pulling-back towards the 1W MA50 (blue trend-line) and bottom of the Rising Wedge. The pattern is getting too tight and the squeeze will inevitably result in a break-out and new trend/ pattern.
If the Rising Wedge breaks downwards, it will mean the end of the yield's +3.5 year bullish run and will have a high impact both on stocks and Gold. In fact there are high probabilities of that happening as a similar Rising Wedge broke to the downside at the end of 2018.
If that gets materialized, then the first attempt should be on the 3.300% Support 1 level, before the 1W MA200 (orange trend-line) gets closer for the test of its long-term Support status.
-------------------------------------------------------------------------------
** Please LIKE 👍, FOLLOW ✅, SHARE 🙌 and COMMENT ✍ if you enjoy this idea! Also share your ideas and charts in the comments section below! This is best way to keep it relevant, support us, keep the content here free and allow the idea to reach as many people as possible. **
-------------------------------------------------------------------------------
💸💸💸💸💸💸
👇 👇 👇 👇 👇 👇

US10 Y forecastIf you believe the all important 10Y yield telegraphs the markets, then pay attention to this chart...I am fairly certain this path will materialize...mid to late 2024 we should see a signifant drop in yields...which should pump markets...and push inflation down. This of course is timed perfectly for the 2024 U.S. presidential elections...coincidence? LOL!

US 10Y TREASURY: Powell and market on opposite sidesFed Chair Powell is speaking, but the market is not listening. Powell was speaking on Friday at Spelman College in Atlanta, noting once again that the current policy might not be restrictive enough, meaning that further rate hikes are possible in case that inflation remains persistent. However, a strong economic output of 5.2% for Q3 and inflation figures which are clearly oriented toward the downside, made the market react quite opposite to Powell`s notes. Almost all assets, including Bitcoin gained during the previous week. Treasury bonds strongly gained during the week, pushing the yields lower.
The 10Y Treasury yields continued with their down trend, starting the week around 4.4% level and ending it at 4.197%. This is more than a clear indication that the market is currently strongly set on rate cuts in the coming period. In case that market perceives that the rate cuts might be higher in 2024, then the 10Y Treasury yields might easily reach the level of 4.0% by the end of this year. Still, for the week ahead, it could be expected that the level of 4.2% is to be tested, with a decreased probability for a reversal toward 4.4% level.
