Bullish AF on $BEER - Solana NetworkThe volume looks good. Perhaps we will consolidate a bit but I have a feeling we will parabolically shoot upward from here.
Crypto market

SHIBUSD Hidden Bullish Divergence on the 4H ChartHidden bullish divergence exists for SHIBA INU on the 4 hour chart. This is indicated by a higher low on the price chart while the RSI shows a lower low. This setup typically results in an increase in price. Of course, there are no guarantees, but I have observed this to be the case most of the time. If the price does move higher and the RSI crosses above the 50 line, the price could get back to the resistance level a around .00002940.
SHIBA INU is still in a bull flag formation on the weekly chart. A significant break above .00002940 resistance could drive the price to the .00003200 to .00003500 range. It should be fun to watch.

Buy LINK Sell FIAT... LINK about to make a big move!!!I only have the basic tradingview account
But while using the free trial feature on 'coinigy'
I made a discovery?!?!?!
Poloniex
Chainlink / USDT pair
4hr or Daily or weekly chart
April 14th date
What do you see?
Be objective
Too easy
R:R 3:1
S/L 12.64
T/P $36+
Enjoy

$pepe formed a massive divergence and gonna be nuked-70% is coming fast
The divergence is forming on a weekly chart.
Can pump more before crash but not much.
Would be a nice opportunity to grab Pepe there!

bnbusdt daily signalHello, we came with the analysis of the currency bnb, as you can see, the currency bnb is in a very good situation, if it can break upwards, it can grow very well, even breaking its historical ceiling.

BTCUSD massive short signals appearbtcusd is trading at the price of67634 today, new month and new week has got triggered some of the strongest sell signals , could this be 32k incomming ,or we could stay in this accumulation zone untill beginning of the bussiness week

€€€€ PEOPLEUSDT FLYING CATCH IT ~~~~~#PEOPLEUSDT
(UPDATE)
Hey dear members hope you all are enjoying our ideas and analysis. Now we are here to discuss about PEOPLE
PEOPLE is breaking the bullish pennant with good volume. We can see gain here upto 50%+ soon.

JENNER: $0.0075 | going all the way a new category is born
a category unclassified yet adaptable
it can be a meme a movement a statement a philosophy
or whatever either neither its all good spreading the good news of freedom
be it financial societal or madness
Gate io secured the float
Htx as stabilizer for allocation
the rest of new DEX coming on board should tale this to TRUMP or PEPE levels

PEWUSDT Trading opportunityPEWUSDT is exhibiting a rounding bottom formation, with the price having already broken above the setup neckline and moving towards the final target. The price has completed potential waves 1-4 and is now in the final leg of the wave to complete the current cycle.
Our trading plans involves buying within the designated buyback zone and focusing on the immediate target indicated on the chart.
Should this level be breached, we may see the price extend towards the final setup target.

Reminder on MATICUSDThe large triangle is forming similar to the one prior to the 2021 breakout
I expect MATICUSD to melt faces post this triangle breakout
I have posted a chart like this before but it becomes more relevant everyday
BULLISH

With for not koinI expect such a move from Not Koin,
NatCoin's RSI has gone up a lot, which indicates its correction


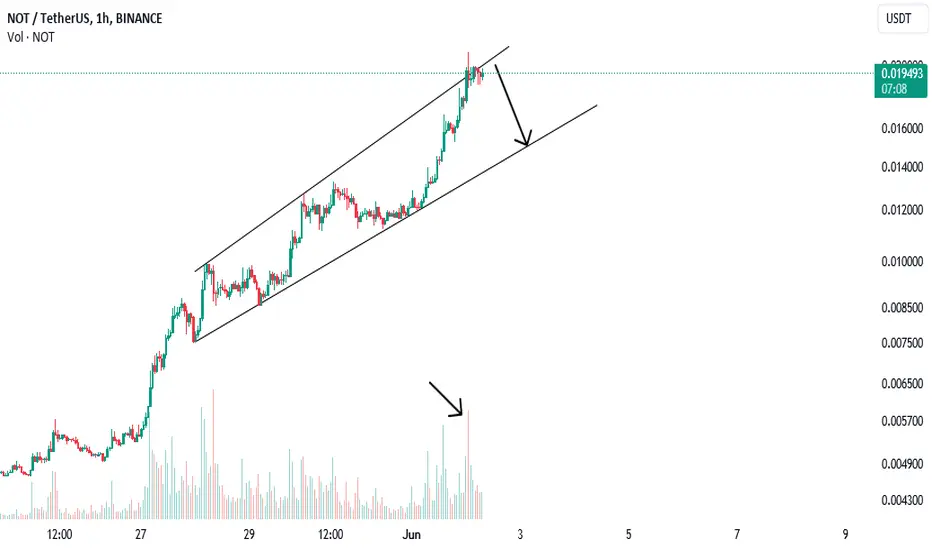
NOTCOIN📊Analysis by AhmadArz: notcoin
In this technical analysis chart for the new token NOT/USDT, the price movement is clearly outlined. Currently, the token is priced around $0.007919 📉 and is trending upwards within the blue channel 🔵📈.
Key resistance levels are identified at $0.008822, $0.009911, and $0.011448 🔒. The analyst suggests waiting for the price to break above the $0.0114 level to anticipate another potential pump 🚀.
Additionally, a crucial support zone is marked between approximately $0.004800 and $0.005100 🛡️. If the price reaches this area, it could be considered a good buying opportunity 📈💰.
Overall, if the price can break through the mentioned resistance levels, there is potential for further increases. However, if it falls below the ascending channel and enters the lower support zone, caution is advised ⚠️.
🔗"Uncover new opportunities in the world of cryptocurrencies with AhmadArz.
💡Join us on TradingView and expand your investment knowledge with our five years of experience in financial markets."
🚀Please boost and💬 comment to share your thoughts with us!

Potential for a shadow and subsequent increase towards 69/70KCurrently, the price is approaching the support of the upward trend. There is a liquidity zone at the $65,800 level, indicating a potential shadow and a subsequent price increase towards $69,000/$70,000.
If the current support is broken, there is a likelihood of the price moving towards $64,000/$62,000. Observing these levels can provide insights into potential market movements. As long as the price remains in an upward trend, monitoring pullbacks (price retracements) could be beneficial for understanding market dynamics.

#ETH has a chance to form a bearish head and shoulders📊#ETH has a chance to form a bearish head and shoulders📉
🧠We have been consolidating within the target zone after achieving our daily long target. From a structural point of view, we have the opportunity to build a bearish head and shoulders structure. A break below the uptrend support line 1 increases the probability of a bearish head and shoulders. After breaking below inflection point 1, a bearish head and shoulders is established.✔️
🔥If this bearish structure holds true, then the short target area we will first focus on is around 3321-3365🎯
Don’t forget risk management💯
✔️Trade safe✔️
🤜If you like my analysis, please like 💖and share it
👋follow me. Learn about further structural evolution💕
BINANCE:ETHUSDT.P

LINKUSDT: Trend in 4H time framePlease pay special attention to the accurate trends, channels, colored levels and red level as SL.
Be careful
BEST
MT

#BTC rising triangle failure, alert to medium-term fall risk.📊#BTC rising triangle failure, alert to medium-term fall risk.⚠️
🧠From a structural point of view, we fell below the bull defense point, so the big double top bearish structure was established. If we fall according to this structure, there is a high probability that we will enter a deep callback stage, so please be wary of being bullish!
➡️We are currently near the phased support zone, so it is best to wait patiently for a rebound to appear before looking for shorting opportunities.☕️
Don’t forget risk management💯
✔️Trade safe✔️
🤜If you like my analysis, please like 💖and share it
👋follow me. Learn about further structural evolution💕
BINANCE:BTCUSDT.P

Binance Coin Price Pattern Set for Breakout is $900 Inevitable?The native coin of the crypto currency exchange Binance ( CRYPTOCAP:BNB ) price has been in a close consolidation phase for nearly 13 weeks. With each passing daily candlestick close, CRYPTOCAP:BNB gets squeezed more, suggesting a steady decline in volatility. These types of continuous consolidation in price actions are usually followed by a massive breakout, and that’s what awaits $BNB.
Binance Native Coin CRYPTOCAP:BNB price Sets for Breakout
Binance Coin price spike up 63% between March 6 and 16, setting up a local top at $646. This impressive uptrend, which only took CRYPTOCAP:BNB ten days to go from $394 to $646, was followed by a consolidative phase that exists as of Saturday.
Despite the price action from March 6 to June 1 shows the formation of a bullish continuation pattern known as a "Bullish Pennant". The aforementioned 63% rally is the flag pole, and the sideways movement that produced lower highs and higher lows is the pennant.
The forecast for this setup is determined by adding the flag pole's height to the breakout point. In Binance Coin’s case, assuming the breakout occurs at $616, the flag pole’s height shows that the Bullish Pennant target for BNB is $900. This ambitious target is roughly 45% away from the all-time high of $692.90.
However, if the market outlook worsens, sending Bitcoin ( CRYPTOCAP:BTC ) price down to $60,000, then it could disrupt the Binance Coin ( CRYPTOCAP:BNB ) price movement, leading to a bearish breakout. This move would invalidate the bullish pennant pattern. In such a case, CRYPTOCAP:BNB could slide 9% and retest the $526 support level. A daily candlestick close that flips this support into a resistance level, would validate the potential start of a downtrend.

SHORTBNB couldnt break this level may be after toch QMR weekly could break this level but every thing depends on BTC market for this time trend is short

BITCOIN - TIME TO BUY?$2.5 Billion In Bitcoin Withdrawn From Centralized Exchanges – A Bullish Signal?
Investor confidence in the crypto market is rising, and Bitcoin is reaping the benefits. Large-scale investors are accumulating BTC despite its recent price fluctuations.
In May, Bitcoin's price failed to stay above the critical $70,000 mark, even though it briefly touched this level twice in the last two weeks. However, recent on-chain data shows growing faith in Bitcoin.
Is BTC Ready for a Price Rally?
Prominent crypto analyst Ali Martinez highlighted a significant outflow of Bitcoin from centralized exchanges in a recent post on the X platform. This observation is based on the CryptoQuant Exchange Reserve metric, which tracks the amount of a specific cryptocurrency held in centralized exchange wallets.
An increase in this metric indicates more deposits than withdrawals of Bitcoin into exchanges, whereas a decrease implies more withdrawals than deposits.
Martinez reported that over 37,000 BTC, worth approximately $2.53 billion, have been withdrawn from exchanges in the past three days. This significant outflow signals a shift in sentiment and suggests that investors are increasingly opting to hold Bitcoin in self-custodial wallets for the long term.
While the exact reasons for this massive outflow are unclear, the movement of funds away from exchanges points to increased investor confidence in Bitcoin's future. This shift could lead to a supply crunch, a situation where demand exceeds supply, potentially driving up Bitcoin's price.
Bitcoin Price Overview
As of now, Bitcoin is priced around $67,489, showing a 1.5% decline in the past 24 hours. Despite this, the ongoing reduction of BTC on exchanges might set the stage for a bullish rally, especially if the supply crunch materializes.

XEN: $0.000 00 2355 | For the Good of Humanity indeedorganically sexy across chains where devs and prebious founders of projects
are at awe..
price is jst a distraction
when this sinks in to the rest of the space it may be too late to get volume
as price shall be gapping up like SANDBOK & ETHEREUM back in the day
Xenomics may just be the new business model moving forward the next halvings of the space

Good analysis and advice may make you moneyBTCUSD is going down
first target around area
65300 : 65700
second target around area
62100 : 62600
