$TSLA WHAT DID I SAY NOW 5% UPGave yall this yesterday
DO NOT SLEEP ON THE POWER OF INSIDE BAR BREAKOUTS
LIKE for the next multi bagger!
TSLA trade ideas

$TSLA Right at Resistance.NASDAQ:TSLA I had an alert set on the Area of Resistance Line on this chart. It triggered this morning and I have taken a ½ size position in anticipation of that becoming support. I do not know if it will play out that way so I have a stop under the 50 DMA (red) which would a 4% position risk. Should it move up and over the resistance area I will look to add. All TBD.
The chart I am using is the All-In-One LevelUp tool available here on TV. Check it out.
Ideas, not investing / trading advice. Comments always welcome. Thanks for looking.

Tesla(TSLA)Everybody familiar with head. shoulders, knees and toes???...
Didn't close below 200 did we?
Either way we still bullish on tesla.
Bias stays the same.

⚠️Tesla is not bullish now ⚠️☝️The main purpose of my resources is free, actionable education for anyone who wants to learn trading and improve mental and technical trading skills. Learn from hundreds of videos and the real story of a particular trader, with all the mistakes and pain on the way to consistency. I'm always glad to discuss and answer questions. 🙌
☝️ALL videos here are for sharing my experience purposes only, not financial advice, NOT A SIGNAL. YOUR TRADES ARE YOUR COMPLETE RESPONSIBILITY. Everything here should be treated as a simulated, educational environment.

TSLA BUYERS are back BUYING... Ascend next.TSLA is firming up a new base after hovering at the 61.8 FIB this past few days -- proving this level as a strong order block support on daily data.
Accumulation / net buying has started pouring in. Ascending higher lows has been registered.
Expect some significant price movement from here on, with a long bias.
Initial targets are the blue boxes.
Spotted at 162.0
TAYOR.
safeguard capital, always.

Tesla's kangaroo still hopping. 20/May/24TSLA kangaroo still boxing/ hopping inside the ring (triangle) since end of 2021. Strong support if there was a pullback toward 186 +/-. Which is confluence zone of 1) POC of Volume Profile (red horizontal line) 2) 233 weekly EMA (white MA Line) 3) Pitchfork lower channel (blue).

Tesla is ready to take offLook at this beautiful RSI!
It just broke out and retested the support line.
Perfect pattern before takeoff.
How high will TSLA go? $280 or more?

Tsla is forming an inverse head and sholders and goldern cross tsla is heading towards 250 as its forming a golder cross and an inverse head and sholders

$TSLA RARE INSIDE WEEK CLOSE
My Plan:
Calls > 179.65
Puts < 169.92
Price is COILING and is setting up for a MASSIVE BREAKOUT
I plan to FULLY Automate these trades with my options auto trick guide
LIKE IF UR IN!

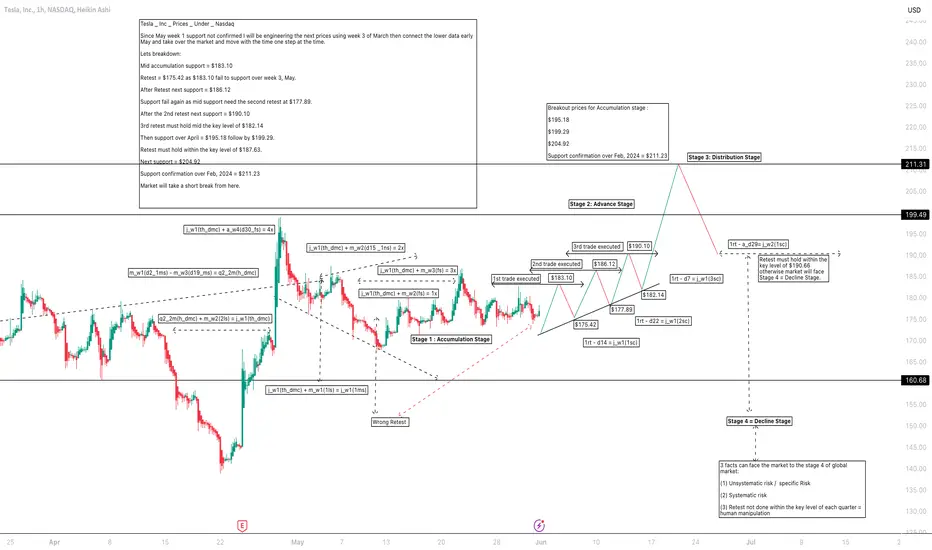
Tesla _ Inc _ Prices _ Under _ Nasdaq Tesla _ Inc _ Prices _ Under _ Nasdaq
Since May week 1 support not confirmed I will be engineering the next prices using week 3 of March then connect the lower data early May and take over the market and move with the time one step at the time.
Lets breakdown:
Mid accumulation support = $183.10
Retest = $175.42 as $183.10 fail to support over week 3, May.
After Retest next support = $186.12
Support fail again as mid support need the second retest at $177.89.
After the 2nd retest next support = $190.10
3rd retest must hold mid the key level of $182.14
Then support over April = $195.18 follow by $199.29.
Retest must hold within the key level of $187.63.
Next support = $204.92
Support confirmation over Feb, 2024 = $211.23
Market will take a short break from here.
Elon Musk Faces $7.5B Insider Trading Allegation From Tesla SharTesla ( NASDAQ:TSLA ) CEO Elon Musk has been accused of insider trading after selling shares worth over $7.5 billion in the last two months of 2022. The lawsuit, filed by shareholder Michael Perry in the Delaware Chancery Court, claims that Musk sold a total of over $7.5 billion worth of Tesla ( NASDAQ:TSLA ) shares in late 2022 before the disclosure of disappointing fourth-quarter production and delivery numbers. Perry alleges that Musk, using his access to real-time data, was aware of the lower-than-expected numbers when he sold shares worth $3.95 billion in November 2022 and $3.58 billion in December 2022. Tesla's stock ( NASDAQ:TSLA ) fell to $108.10 on January 3, down from the $123.18 it closed on December 30, and the lawsuit pegged Musk's "insider profits" for the aforementioned share sales at about $3 billion. The lawsuit also accuses then-Tesla directors of breach of fiduciary duty of loyalty for allowing Musk's sales and is seeking a directive from the court that all profits obtained from these share sales be returned.
The lawsuit is the latest of legal hurdles for the EV giant, as Musk's 2018 pay package, worth $56 billion at the time of award, was rescinded by a Delaware court earlier this year. Tesla's board is trying to have it reinstated by a shareholder vote again in June.
Tesla stock ( NASDAQ:TSLA ) closed Friday's trading session down 0.4% with a Relative Strength Index (RSI) of 52.21 which is moderate. Tesla is in a consolidation zone for the past 3 weeks.

TSLA 15 MIN CHARTDescending triangle
hnside it 13.71 $
break down target 159.45
break up add 13.71 to point of up penetraion

TSLA basing on its volume profile for a trade LONGTSLA on the highly reliable weekly chart is at the bottom of its volume profile in the lower
part of the high volume area. The TTM Squeeze Indicator ( TTM = Trade the Market John Carter)
has printed a signal for four weeks. The RSI faster and slower lines are near to the 50 level.
The mean relative volatility has steadily decreased and this is in an increasing squeeze state.
This is a setup for a patient trader to take a position in a swing trade. I am looking for a trade
into the upper part of the high volume area and so to the 240-280 range. I will get some shares
as well as a few call options for November (ITM). TSLA will be subjected to a number of
variables making the trade a bit risky including the Musk compensation battle, the China
economy, competition with Chinese EVs in Europe, federal rate actions and the presidential
elections as well as the evolution of self-driving. It is TSLA's volatility that makes it a great
trade. My entry signal here is a TTM indicator going black to white.

TSLA : Trend AnalysisKey Points : NASDAQ:TSLA
* Sideways Trend may be continued.
* The price may be stayed between Resistance and support .
Resistance - 186.39
Support - 168.28
N.B:
I am skilled in day and swing trading. Otherwise, I am skilled in technical analysis such as trend, chart pattern, trade set up, entry and target set up, resistance, support, etc.

TSLA-TRADING-RANGETESLA is trading in range between support and resistance if price broke support 1 price may go bearish and if price break R1 price may test R2 and retest R!


TSLA CHANNELS First break up passed the target
Second channel has 12.77 inside either plus if breaks up or minus if went down


TSLA: Tight consolidation before next movementsTSLA: Tight consolidation:
-Quasimodo pattern.
-Candle pattern support.
-Demand zone support.
-Volume support.
.
More free plans at FB group: US STOCKS- WALL STREET DREAM

TSLA to $230?Well well well, isn’t this interesting?
TSLA is printing the same exact pattern it just printed.
Look at the fibs.
Swing low to high makes the 1 and 0…
- bounce of the 0.2, then the 0.3
- retrace to 0.5
- back up to the 0.2
- crash to the 0.7
- hit the 0.5 again from the bottom
- then tap the 0.6 before taking off back towards the 0.3 and 0.2
It happened on the big fib on the left…and it happened again on the smaller fib on the right.
If this pattern continues, TSLA is just bouncing off the 0.6, meaning next target would be between the 0.3 and 0.2

$TSLA Contrarian Bounce Against the Market Grain.$TSLA:1D
Price breaks out of downtrend at +3SD (190.79).
Potential ‘gap-fill’ up to 206.
Bullish price to RSI divergence. (yellow lines)
Pearson’s R^2 is extremely high and I don’t believe this level of trend strength can be maintained at these levels of elevation for a very extended period of time.
Significant inverse correlation to relevant index ETF ( NASDAQ:QQQ ) makes NASDAQ:TSLA a theoretically contrarian trade for me assuming I have a bearish sentiment on broader tech sector as represented by $QQQ. Given how beaten up the stock has been I believe it could rise against a falling tech sector, at some point over the next 90 days.
First target is 198 level, second target is filling the gap up to 206 and the third and final ‘reach target’ would be the 0.5 retrace at 222.60. I would be happy with 2/3 of these being completed.
If the trade went against me, I see the worst case, downside, scenario as a further spill to the 1.382 (147.56) with a drop to the mid 160’s as more likely in the event of a downturn. My thesis is long but outlining the downside scenario is an important part of managing risk for me.
Happy trading.

Tesla down to 150 USD,, then either continue to 122 USD or UPTesla clear bearish, to 150 USD within one to 2 weeks

Elliott Wave Analysis on Tesla (TSLA) Suggests A Double CorrectiShort Term Elliott Wave in Tesla (TSLA) suggests the rally from 4.22.2024 low is in progress as an impulse. Up from 4.22.2024 low, wave (1) ended at 198.90 as the 45 minutes chart below shows. Wave (2) pullback is currently in progress. The internal subdivision of wave (2) takes the form of a double three Elliott Wave structure. Down from wave (2), wave (i) ended at 188.35 and wave (ii) ended at 194.54. The stock extended lower in wave (iii) towards 178.03 and wave (iv) ended at 185.26. Final leg wave (v) ended at 176.02 which completed wave ((a)). Rally in wave ((b)) ended at 187.56 as a double three.
Wave ((c)) lower is in progress as 5 waves and ended at 167.50. This completed wave W in higher degree. Wave X rally takes the form of a double three Elliott Wave structure. Up from wave W, wave ((w)) ended at 181.8 and pullback in wave ((x)) ended at 171.43. Wave ((y)) higher ended at 187.42 which completed wave X. The stock has turned lower in wave Y. Down from wave X, wave (i) ended at 178.1 and wave (ii) ended at 182.8. Near term, as far as pivot at 198.9 high stays intact, expect the stock to extend lower.
