#AIRBUS Double top.Will the next version of Lockdowns be even more stringent and for longer???
#AIR has a potential DT formation
we have to wait and see
.... I wouldn't go booking next years summer holidays just yet!
AIR trade ideas

AIRBUS READY FOR TAKEOFF - 65% PROFITAIRBUS (AIR) - 4hr/Frankfurt
Hello and welcome to this update,
this one is about Airbus, which looks GOOD in my opinion.
-All-time high was 140, which we dropped from, which is a 65% drop.
-RSI looking good, bullish divergence confirmed.
-Volume is solid- declining at the bottom (or temporary bottom) is a good sign and could mean, the selloff came to an end (for now).
-Reversal of 65% to 79€ (Resistance from 2nd January 2019) from 48€ is absolutely in range.
-Contesting all-time high in the future is possible as well since Airbus is next to Boeing the biggest aircraft and flight producer in the market.
-Longterm, this is a steal in my opinion.
Since we are in "reporting Season", end of April there will be the quarterly report of Airbus, which could stagnate, due to the corona crisis and the circumstances, which many companies suffer from. Aviation Business could be under pressure, though for the longterm, this will be fine in my opinion.
Have a nice day, thank you for tuning in, I appreciate it a lot!
Your german-quality-trader

Buy when price breaks 150Overall market is positive. Stock will benefit from increased government spending in defence industry. Stock is set to break out and gain momentum once 150 is taken out.

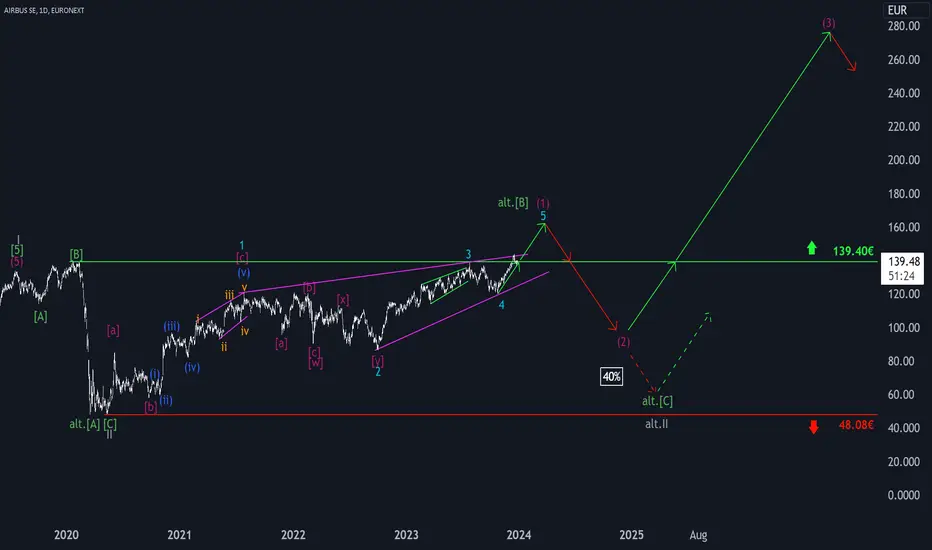
Airbus: Turbulence! 🌪️ 🛫Airbus shares continue to struggle at the resistance level of €139.40. In our primary assumption, the price should soon leave this level behind and complete the magenta-colored (1) with the top of the turquoise wave 5, before it goes down again significantly in the same color wave (2). If this downward journey is prolonged to the immediate vicinity of the support at €48.08, a new low of the gray old.II can be expected, shifted to the right. Primarily, however, we believe that the stock is already on the upswing of gray III, whose five-part magenta substructure should break out to its impulsive (3) after the low of (2) and set new all-time highs in the process.
[S-016] AirbusTrading idea number S-016 | Airbus stock could raise to 141 area.
Airbus prices have been moving within a bullish channel since the beginning of the year. In recent sessons the latter have bounced ahead of pivot support S1, within the support line of the bullish channel. Following this move we expect a new short bullish phase toward the resistance trend line of the bullish channel once the pivot point at 132.28 is breached.
📈 Long Entry at 130
💰 Take Profit at 141
💸 Stop Loss at 125


long position on AIRMy strategy is based on price action with the reading of certain indicators that I like while respecting all the values that define the stock maket

This Mix of Tools May Make You More Fearless When Trading AIREven with relatively high volatility, the use of the two Gann Fans and Fibonacci along with MACD indicator - which I normally don't like to use - based on Heikin Ashi log-scaled chart proves to be quite powerful to capture the behavior of AIR price.
On the daily chart, the area between 11.52-106.42 is the target after that AIR breaks below the ascending channel. Also, the previous swing area between 102.32-101.68 is the next bearish target if a further breakdown would occur.
On the flip side, a break above the upper 3/1 and the lower support line of the channel may set the area between 121.20 and the upper 4/1 as the next bullish targets.
I would appreciate any opinion concerning this analysis :)


AIRBUS still bullish to expect
Hi viewers, AIR technically watched here expecting new bullish push in next periods
TP1:123
TP2:126
TP2:129

EADSY Support off 20, Long PosExpect another support bounce off SMA 20 in next week.
Good opportunity for long position to ~34 resistance.
Depending on support, stop loss either on 29 support or near ~29.68 (just below SMA 20).
SMA20 passed above SMA 50, support 3 times against SMA 20.
Bullish engulfing.

Breakout for Airbus SEPossible break through. Week looks like a wedge. Day view not so much. Almost a flag.
Overall trend looks nice with 50SMA passing 200 SMA.
MACD is ripe for swinging up. Lots of support on 50SMA, tested twice in past week.
RSI is okay. could be better but HHs with HLs makes it look good.

Airbus being a good market sell?Airbus - Intraday - We look to Sell at 111.86 (stop at 117.22)
Price action continued to range between key support & resistance (90 - 112) and we expect this to continue.
Expect trading to remain mixed and volatile.
We are trading at overbought extremes.
A higher correction is expected.
Offers ample risk/reward to sell at the market.
The previous high is located at 111.04.
Our profit targets will be 98.48 and 94.48
Resistance: 112.00 / 116.00 / 119.00
Support: 105.50 / 102.50 / 100.00
Disclaimer – Saxo Bank Group.
Please be reminded – you alone are responsible for your trading – both gains and losses. There is a very high degree of risk involved in trading. The technical analysis , like any and all indicators, strategies, columns, articles and other features accessible on/though this site (including those from Signal Centre) are for informational purposes only and should not be construed as investment advice by you. Such technical analysis are believed to be obtained from sources believed to be reliable, but not warrant their respective completeness or accuracy, or warrant any results from the use of the information. Your use of the technical analysis , as would also your use of any and all mentioned indicators, strategies, columns, articles and all other features, is entirely at your own risk and it is your sole responsibility to evaluate the accuracy, completeness and usefulness (including suitability) of the information. You should assess the risk of any trade with your financial adviser and make your own independent decision(s) regarding any tradable products which may be the subject matter of the technical analysis or any of the said indicators, strategies, columns, articles and all other features.
Please also be reminded that if despite the above, any of the said technical analysis (or any of the said indicators, strategies, columns, articles and other features accessible on/through this site) is found to be advisory or a recommendation; and not merely informational in nature, the same is in any event provided with the intention of being for general circulation and availability only. As such it is not intended to and does not form part of any offer or recommendation directed at you specifically, or have any regard to the investment objectives, financial situation or needs of yourself or any other specific person. Before committing to a trade or investment therefore, please seek advice from a financial or other professional adviser regarding the suitability of the product for you and (where available) read the relevant product offer/description documents, including the risk disclosures. If you do not wish to seek such financial advice, please still exercise your mind and consider carefully whether the product is suitable for you because you alone remain responsible for your trading – both gains and losses.

Airbus to stop flying?Airbus - 30d expiry - We look to Sell at 110.96 (stop at 116.02)
Price action continued to range between key support & resistance (90 - 112) and we expect this to continue.
Expect trading to remain mixed and volatile.
Early optimism is likely to lead to gains although extended attempts higher are expected to fail.
We look for a temporary move higher.
Preferred trade is to sell into rallies.
The previous high is located at 111.04.
Our profit targets will be 98.16 and 93.16
Resistance: 112.00 / 116.00 / 119.00
Support: 105.50 / 102.50 / 100.00
Disclaimer – Saxo Bank Group.
Please be reminded – you alone are responsible for your trading – both gains and losses. There is a very high degree of risk involved in trading. The technical analysis , like any and all indicators, strategies, columns, articles and other features accessible on/though this site (including those from Signal Centre) are for informational purposes only and should not be construed as investment advice by you. Such technical analysis are believed to be obtained from sources believed to be reliable, but not warrant their respective completeness or accuracy, or warrant any results from the use of the information. Your use of the technical analysis , as would also your use of any and all mentioned indicators, strategies, columns, articles and all other features, is entirely at your own risk and it is your sole responsibility to evaluate the accuracy, completeness and usefulness (including suitability) of the information. You should assess the risk of any trade with your financial adviser and make your own independent decision(s) regarding any tradable products which may be the subject matter of the technical analysis or any of the said indicators, strategies, columns, articles and all other features.
Please also be reminded that if despite the above, any of the said technical analysis (or any of the said indicators, strategies, columns, articles and other features accessible on/through this site) is found to be advisory or a recommendation; and not merely informational in nature, the same is in any event provided with the intention of being for general circulation and availability only. As such it is not intended to and does not form part of any offer or recommendation directed at you specifically, or have any regard to the investment objectives, financial situation or needs of yourself or any other specific person. Before committing to a trade or investment therefore, please seek advice from a financial or other professional adviser regarding the suitability of the product for you and (where available) read the relevant product offer/description documents, including the risk disclosures. If you do not wish to seek such financial advice, please still exercise your mind and consider carefully whether the product is suitable for you because you alone remain responsible for your trading – both gains and losses.

Airbus forming Inverted head and shoulders.Airbus - Intraday - We look to Buy at 91.05 (stop at 87.57)
89.00 has been pivotal.
Bespoke support is located at 91.00.
A bullish reverse Head and Shoulders is forming.
We look to buy dips.
Prices have reacted from 87.00.
Our profit targets will be 99.77 and 103.77
Resistance: 95.00 / 98.00 / 100.00
Support: 91.00 / 89.00 / 86.50
Disclaimer – Saxo Bank Group.
Please be reminded – you alone are responsible for your trading – both gains and losses. There is a very high degree of risk involved in trading. The technical analysis , like any and all indicators, strategies, columns, articles and other features accessible on/though this site (including those from Signal Centre) are for informational purposes only and should not be construed as investment advice by you. Such technical analysis are believed to be obtained from sources believed to be reliable, but not warrant their respective completeness or accuracy, or warrant any results from the use of the information. Your use of the technical analysis , as would also your use of any and all mentioned indicators, strategies, columns, articles and all other features, is entirely at your own risk and it is your sole responsibility to evaluate the accuracy, completeness and usefulness (including suitability) of the information. You should assess the risk of any trade with your financial adviser and make your own independent decision(s) regarding any tradable products which may be the subject matter of the technical analysis or any of the said indicators, strategies, columns, articles and all other features.
Please also be reminded that if despite the above, any of the said technical analysis (or any of the said indicators, strategies, columns, articles and other features accessible on/through this site) is found to be advisory or a recommendation; and not merely informational in nature, the same is in any event provided with the intention of being for general circulation and availability only. As such it is not intended to and does not form part of any offer or recommendation directed at you specifically, or have any regard to the investment objectives, financial situation or needs of yourself or any other specific person. Before committing to a trade or investment therefore, please seek advice from a financial or other professional adviser regarding the suitability of the product for you and (where available) read the relevant product offer/description documents, including the risk disclosures. If you do not wish to seek such financial advice, please still exercise your mind and consider carefully whether the product is suitable for you because you alone remain responsible for your trading – both gains and losses.

Airbus slowly approaching crucial support.Airbus - Intraday - We look to Buy at 90.51 (stop at 88.38)
Weekly pivot is at 88.96.
Weekly pivot is at 88.91.
Bespoke support is located at 90.00.
Dips continue to attract buyers.
We look to buy dips.
We look for a temporary move lower.
Our profit targets will be 96.66 and 97.56
Resistance: 95.00 / 97.00 / 100.00
Support: 90.00 / 89.00 / 88.00
Disclaimer – Saxo Bank Group. Please be reminded – you alone are responsible for your trading – both gains and losses. There is a very high degree of risk involved in trading. The technical analysis , like any and all indicators, strategies, columns, articles and other features accessible on/though this site (including those from Signal Centre) are for informational purposes only and should not be construed as investment advice by you. Such technical analysis are believed to be obtained from sources believed to be reliable, but not warrant their respective completeness or accuracy, or warrant any results from the use of the information. Your use of the technical analysis , as would also your use of any and all mentioned indicators, strategies, columns, articles and all other features, is entirely at your own risk and it is your sole responsibility to evaluate the accuracy, completeness and usefulness (including suitability) of the information. You should assess the risk of any trade with your financial adviser and make your own independent decision(s) regarding any tradable products which may be the subject matter of the technical analysis or any of the said indicators, strategies, columns, articles and all other features.
Please also be reminded that if despite the above, any of the said technical analysis (or any of the said indicators, strategies, columns, articles and other features accessible on/through this site) is found to be advisory or a recommendation; and not merely informational in nature, the same is in any event provided with the intention of being for general circulation and availability only. As such it is not intended to and does not form part of any offer or recommendation directed at you specifically, or have any regard to the investment objectives, financial situation or needs of yourself or any other specific person. Before committing to a trade or investment therefore, please seek advice from a financial or other professional adviser regarding the suitability of the product for you and (where available) read the relevant product offer/description documents, including the risk disclosures. If you do not wish to seek such financial advice, please still exercise your mind and consider carefully whether the product is suitable for you because you alone remain responsible for your trading – both gains and losses.

Airbus slowly approaching crucial resistance.Airbus - Intraday - We look to Sell at 110.91 (stop at 113.51)
112.00 continues to hold back the bulls.
Daily signals are mildly bearish.
Early optimism is likely to lead to gains although extended attempts higher are expected to fail.
Bespoke resistance is located at 112.00.
Resistance could prove difficult to breakdown.
The previous swing high is located at 111.04.
Our profit targets will be 104.31 and 102.31
Resistance: 102.00 / 107.00 / 112.00
Support: 99.00 / 94.00 / 90.00
Daily chart
Disclaimer – Saxo Bank Group. Please be reminded – you alone are responsible for your trading – both gains and losses.
There is a very high degree of risk involved in trading. The technical analysis, like any and all indicators, strategies, columns, articles and other features accessible on/though this site (including those from Signal Centre) are for informational purposes only and should not be construed as investment advice by you. Such technical analysis are believed to be obtained from sources believed to be reliable, but not warrant their respective completeness or accuracy, or warrant any results from the use of the information. Your use of the technical analysis, as would also your use of any and all mentioned indicators, strategies, columns, articles and all other features, is entirely at your own risk and it is your sole responsibility to evaluate the accuracy, completeness and usefulness (including suitability) of the information. You should assess the risk of any trade with your financial adviser and make your own independent decision(s) regarding any tradable products which may be the subject matter of the technical analysis or any of the said indicators, strategies, columns, articles and all other features.
Please also be reminded that if despite the above, any of the said technical analysis (or any of the said indicators, strategies, columns, articles and other features accessible on/through this site) is found to be advisory or a recommendation; and not merely informational in nature, the same is in any event provided with the intention of being for general circulation and availability only. As such it is not intended to and does not form part of any offer or recommendation directed at you specifically, or have any regard to the investment objectives, financial situation or needs of yourself or any other specific person. Before committing to a trade or investment therefore, please seek advice from a financial or other professional adviser regarding the suitability of the product for you and (where available) read the relevant product offer/description documents, including the risk disclosures. If you do not wish to seek such financial advice, please still exercise your mind and consider carefully whether the product is suitable for you because you alone remain responsible for your trading – both gains and losses.

Trading Idea - #AirbusMy trading idea for Airbus - Buy/LONG
Target: EUR 116.00 (+11.6% gain)
Despite the delivery bottlenecks, Airbus has shown a solid business performance in the second quarter. So with the upcoming quarterly report on 27 July, there could be a positive outlook.
Experts expect solid free cash flow and unchanged targets for the year.
The EUR 90.00 mark successfully provided support at the beginning of July. The price has bounced off this and continues to climb from high to high.

Airbus (AIR.pa) bullish scenario:The technical figure Falling Wedge can be found in the daily chart in the French company Airbus SE (AIR.pa). Airbus SE is a European multinational aerospace corporation. Airbus designs, manufactures and sells civil and military aerospace products worldwide and manufactures aircraft in Europe and various countries outside Europe. The company has three divisions: Commercial Aircraft (Airbus S.A.S.), Defence and Space, and Helicopters, the third being the largest in its industry in terms of revenues and turbine helicopter deliveries. As of 2019, Airbus is the world's largest airliner manufacturer. The Falling Wedge has broken through the resistance line on 08/07/2022, if the price holds above this level, you can have a possible bullish price movement with a forecast for the next nine days towards 99.80 EUR. Your stop-loss order, according to experts, should be placed at 88.91 EUR if you decide to enter this position.
Qatar Airways has indicated that a provisional agreement to buy up to 50 Boeing 737 MAX jets has lapsed, Boeing's rival Airbus said in a court document released on Thursday.
The deal, signed in Washington in January, is part of a series of inter-locking agreements caught up in a London court dispute between Airbus and the Gulf carrier over a larger jet.
Airbus requested a copy of the Boeing 737 MAX agreement after the airline brought it up as part of its bid for compensation for damage to the A350, now worth $1.4 billion.
Risk Disclosure: Trading Foreign Exchange (Forex) and Contracts of Difference (CFD's) carries a high level of risk. By registering and signing up, any client affirms their understanding of their own personal accountability for all transactions performed within their account and recognizes the risks associated with trading on such markets and on such sites. Furthermore, one understands that the company carries zero influence over transactions, markets, and trading signals, therefore, cannot be held liable nor guarantee any profits or losses.

Light at the end of the tunnel for AirbusRead latest article here
If this current support can hold, we can expect the breakout of the temporary bearish trend to end and the price action to hit 120 where it attempted several times to break higher at this resistance level but failed.

Airbus SE (AIR.pa) bullish scenario:The technical figure Triangle can be found in the French company Airbus SE (AIR.pa) at daily chart. Airbus SE is a European multinational aerospace corporation. Airbus designs, manufactures and sells civil and military aerospace products worldwide and manufactures aircraft in Europe and various countries outside Europe. The company has three divisions: Commercial Aircraft (Airbus S.A.S.), Defence and Space, and Helicopters, the third being the largest in its industry in terms of revenues and turbine helicopter deliveries. As of 2019, Airbus is the world's largest airliner manufacturer. The Triangle has broken through the resistance line on 06/05/2022, if the price holds above this level you can have a possible bullish price movement with a forecast for the next 17 days towards 117.08 EUR. Your stop loss order according to experts should be placed at 100.56 EUR if you decide to enter this position.
Shares in Airbus SA, +6.28% rose Thursday after the company posted first-quarter earnings above market expectations and said it would boost future production rates for its A320.
The European plane maker reported adjusted earnings before interest and taxes–a key profitability metric–of 1.26 billion euros ($1.34 billion) for the quarter, up from EUR694 million a year earlier. The figure beat analysts’ forecasts of EUR719 million. Net profit jumped to EUR1.22 billion, beating analysts’ views of EUR460 million.
Risk Disclosure: Trading Foreign Exchange (Forex) and Contracts of Difference (CFD's) carries a high level of risk. By registering and signing up, any client affirms their understanding of their own personal accountability for all transactions performed within their account and recognizes the risks associated with trading on such markets and on such sites. Furthermore, one understands that the company carries zero influence over transactions, markets, and trading signals, therefore, cannot be held liable nor guarantee any profits or losses.

Airbus: All AboardAirbus - Short Term - We look to Sell at 108.46 (stop at 113.02)
Preferred trade is to sell into rallies. Previous support at 107.00 now becomes resistance. 20 1day EMA is at 111.00. Expect trading to remain mixed and volatile. Further downside is expected although we prefer to set shorts at our bespoke resistance levels at 107.00, resulting in improved risk/reward.
Our profit targets will be 95.82 and 93.62
Resistance: 107.00 / 115.00 / 120.00
Support: 95.00 / 90.00 / 85.00
Disclaimer – Saxo Bank Group. Please be reminded – you alone are responsible for your trading – both gains and losses. There is a very high degree of risk involved in trading. The technical analysis, like any and all indicators, strategies, columns, articles and other features accessible on/though this site (including those from Signal Centre) are for informational purposes only and should not be construed as investment advice by you. Such technical analysis are believed to be obtained from sources believed to be reliable, but not warrant their respective completeness or accuracy, or warrant any results from the use of the information. Your use of the technical analysis, as would also your use of any and all mentioned indicators, strategies, columns, articles and all other features, is entirely at your own risk and it is your sole responsibility to evaluate the accuracy, completeness and usefulness (including suitability) of the information. You should assess the risk of any trade with your financial adviser and make your own independent decision(s) regarding any tradable products which may be the subject matter of the technical analysis or any of the said indicators, strategies, columns, articles and all other features.
Please also be reminded that if despite the above, any of the said technical analysis (or any of the said indicators, strategies, columns, articles and other features accessible on/through this site) is found to be advisory or a recommendation; and not merely informational in nature, the same is in any event provided with the intention of being for general circulation and availability only. As such it is not intended to and does not form part of any offer or recommendation directed at you specifically, or have any regard to the investment objectives, financial situation or needs of yourself or any other specific person. Before committing to a trade or investment therefore, please seek advice from a financial or other professional adviser regarding the suitability of the product for you and (where available) read the relevant product offer/description documents, including the risk disclosures. If you do not wish to seek such financial advice, please still exercise your mind and consider carefully whether the product is suitable for you because you alone remain responsible for your trading – both gains and losses.
