The End & The BeginningThis will be our final public post
The collapse of modern society and capitalism has begun
We must focus on preparation
May you all be safe
Market indices

📈 Bearish Harmonics Pattern In The Making | DJI Peaked, Again!Hello my fellow traders and news people, I would like to show you this because it is a nice bit of information and can be quite revealing; it can help us connect many dots.
The DJI is poised to produce a correction based on normal cyclic market action.
Based on the classic fluctuations wee see of p

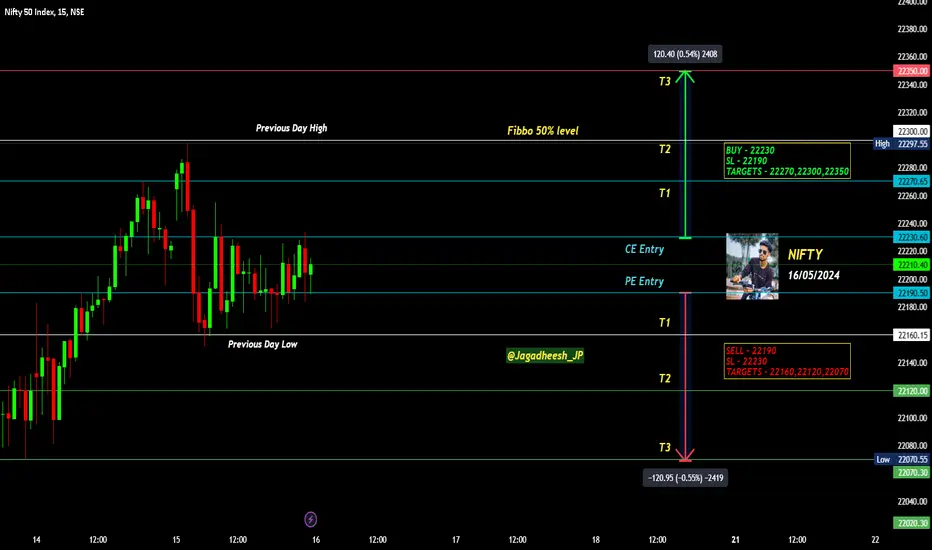
NIFTY INTRADAY LEVELS FOR 16 MAY 2024BUY ABOVE - 22230
SL - 22190
TARGETS - 22270,22300,22350
SELL BELOW - 22190
SL - 22230
TARGETS - 22160,22120,22070
NO TRADE ZONE - 22190 to 22230
Previous Day High - 22300
Previous Day Low - 22160
Based on price action major support & resistance's are here, the red lines acts as resistances, t

This is and has been my wave count as a TOP115% short now The posted best reflects my view within the wave structure . as The VIX has entered the 12.74/12.4 For months I been calling for two targetin the based on 2000 peak and the 2007 peaks they were 5261 gann 2000 peak of 1555,5 and 2007 peak 5331 I am net long puts in qqq and spy till I see otherwi

Dollar could be bullish again from this level and channel lowThe dollar has been dropping down to the Order block and the bottom of the ascending channel. This order block had quite a strong departure so I think we will get a reaction here for more confirmation close and retest of the previous week's low.
Always follow these rules
- Accumulation / Manipulat

US100 - Broken All Time High | Bull Trap?Nasdaq has broken its all time high of 18500 on march 24. It is currently trading above it but does
momentum supports new high?
As far as volume is concern. There is bearish divergence on volumes. Volumes are on lower sides on this breakout raises eyes on bull trap.
We have another harmonic patte

DXY Index is Ready to Pump by 🌄Morning Candlestick Pattern🌄🏃♂️DXY Index is moving near the 🟢 Support zone($104.27-$103.90) 🟢, and 200_SMA(Daily) and 100_SMA(Daily) , and the lower line of the ascending channel .
💡Also, the Morning Candlestick Pattern is clearly visible.
🌊According to the theory of Elliott waves , it seems that the DXY Index has

S&P500 Ultimate 20-year cheat-sheet! See when to sell!The S&P500 index (SPX) is having another very strong bullish month, following the red 1M candle of April, which was the first after 5 straight months of profit. Many might be wondering why a deeper correction didn't come at this stage and the answer is simply that it's not yet the time for it.
We p

US100 POSSIBLE FALSE BREAKOUT US100 might have created a false break on current resistance if the pair pull back within this zone it will open up room for sell positions in the days ahead

See all popular ideas