The market is taking a breakLooks like the market is going to make another visit to the uptrend line from October 2023. Be ready for a bumpy ride in the next couple of weeks. Save some cash for the right moment to buy or short something. We are still on a bull market.
SPY trade ideas

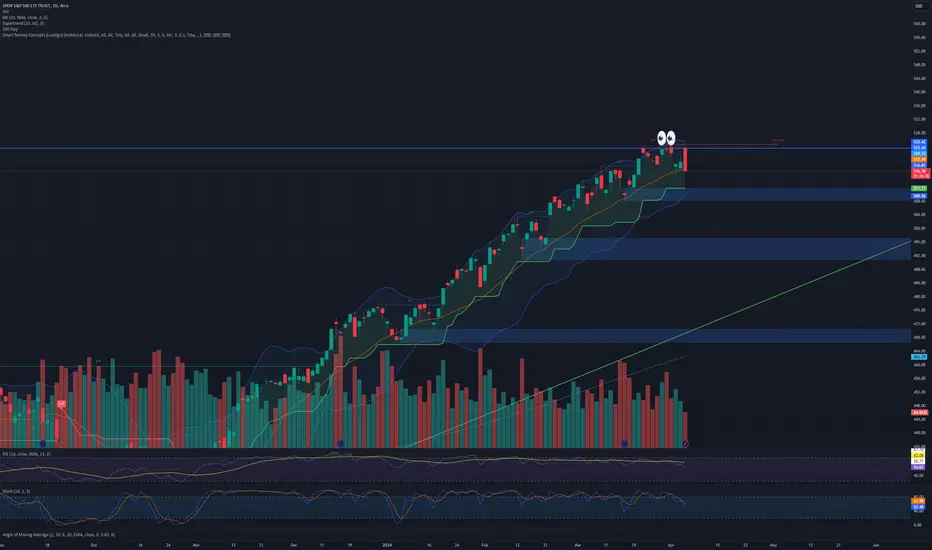
SPY levels - Time to be patient Let's quickly review some levels in SPY.
I can see potential support at 525 as a base flip level.
523 also looks like support - here are 21 EMA + the flag bottom + gap fill.
The obvious resistance here is 532-533.
One key thing I want to mention: the market is now ranging, and it's important to be patient and give it some time to form clearer price action and confirm the next momentum.

SPY Short 3-8% Correction I Don't Think So Goo Long Bull RunThe correction??? In my opinion and chart theory suggest its time to go long and find the proper to stocks to be in
Subscribe for update stock pick and the best sectors to be in so your not left behind!!
as for todays daily chart set up I suggest calls at least a week out as chart indicates
Goodluck traders like and subscribe
as for members that listened
and got in Baba ,3m, Pltr, & Tesla congratulations
I woke up this morning up 10k took profit!! not that many industries where u make 10k over the weekend

SPY evening star setupFor those of you who understand candlestick patterns, this is not news to you.
The weekly SPY is setting up an evening star formation. It's a bearish setup on a weekly chart. More importantly, it should be noted as a false breakout (if we close near current levels)

$SPY May 24, 2024AMEX:SPY May 24, 2024
15 Minutes.
AMEX:SPY opened gap up.
Close was bad. as it closed near low of bar.
Having expected 534 on upside, short opportunity came easily.
We have 2 issues.
AMEX:SPY made ATH. But close in daily and week so far is bad. Near low of bar.
So, if today we have a closure near end of bar in week. Next week we will have downtrend.
So now buy is confirmed only above 533.5 levels.
Till then we keep shorting. For the moment.
For the day any retrace to 529.5 for the fall 531.49 to 524.73 will give opportunity to short.
We are having 517 as 21 EMA in daily.
Thats the target I will short next week.

SPY: Week of April 13Hey everyone,
Going into next week, it seems like we my start with selling first.
Going into Monday probability is particularly bearish.
Based on the assessment of the week it actually seems like we can expect dramatic moves in both directions, so if we head down first, I would expect the CPI catalyst to move us back up. Vice versa if we start bullish. Though, based on the numbers, its looking like we're starting bearish.
The most bearish data is DIA (DOW).
The data from SPY indicates something I call a matching move, which means, equal move down, equal move up. Not bearish in the long term but bearish initially which will be matched by the bullish rebound (again, assuming we start bearish).
Larger picture remains bullish. I don't feel like I need to keep stressing that, but just in case, there is your reminder :p.
Initial TP for SPY is a retrace of 518. If we hold that, I would anticipate continuation of sideways behaviour around that level then up. If we break it, then look for the secondary and tertiary low targets in the chart above.
Max low would be the red box in the chart IMO and based on the data.
Those are my thoughts!
Safe trades!

$SPY May 23, 2024AMEX:SPY May 23, 2024
15 Minutes.
Once more day. 531 became a tough nut to crack. As expected once 529 broke we have a low near 527.5 levels.
For the last rise from 499.55 to 531.56 23.6% retracement is 524 levels.
in 15 minutes for the rise from 520.56 to 531.56 61.8% retracement is 525 levels.
Today as expected in 15 minutes AMEX:SPY too support at 200 averages.
For the day if we take the last fall 531.56 to 527.6 530.8 to 531 will be a level to short SL 532.5 to 533.
My target for upside is still 534 provided 532 is taken out convincingly.
For the day my bias is towards 524- 525 once 527.4 is born on downside.

$SPY - It can get ugly unless...If AMEX:SPY fails to bounce from here and breaks below $522 - $520 area, things will get ugly real quick!
The members of the Fed are becoming sports commentators, narrating every move in the macro data and causing havoc in the market.
Potential downside targets:
$515
$498
$475

$SPY Triple Top...AMEX:SPY getting spicy here, looks like a triple top for now headed into a lot of world news, ie Iran/Israel/Biden ... I think we've been overdue for a correction, this is a VERY solid base to start a downtrend and fill some gaps before heading back up for Trump Presidency... Buy the rumor stuff...
No positions, will look for continuation tomorrow...
- Prof
Market(s) move the world around Events occur around the chart(s) and never vice versa.
Its aways all about WHEN to move the market

This will be the last rally SPY.SPY holding that 520 like god. They gonna rally test highs 533 it past that then we go 550 maybe. After that we should head down this time longer deeper. watch daily stoch turn up see how far it goes before turning. Why sell off
1. Rates are going higher u hear Bernstein saying inflation down 60% and 2% looks good target. WTF that why I play charts
2. Banks baby in trouble especially regionals other banks will fall also why debt man banks broke why they rally stock buy backs u understand that correct not productivity money to buy OWN shares back
3. Housing look XHB PHM housing about drop
4. IWM IWM has not yet and will not get to old highs that is bad bad.
5 breadth in market terrible
6 Watch fund managers sell into this rally get clients out.
so lets see next week we have SMH QQQ selling off to why inflation high rates
1 more high rates why banks dropping defaults not lending Jamie diamond announce no stock buy back may 23 look we dropped hard no stock buy back to expensive. National debt crazy. Lets see how next week goes. I am long SPXL 127.85
Thanks taking time read. Comments welcome.

SPY turns bearish After pulling away from the upper Bollinger band earlier this week, the MACD has indicated that this Bullshit are about to be taken to the woodshed. Selling calls is easy money IMHO.

Ichimoku Watch: SPDR S&P 500 ETF Trust Engaging with SupportDesigned to track the performance of the S&P 500 market index, the SPDR S&P 500 ETF Trust (current AUM is US$529,081.40 million) is engaging with an interesting area of support on the 4h chart after gapping lower on Wednesday. This follows an all-time high forged last week at $534.00.
SPDR Testing Support
The uptrend in this market at the moment is obvious, and traders, therefore, will be seeking locations for dip-buying opportunities.
The Ichimoku Cloud’s upper limit was tested yesterday, currently between $525 and $529 (the difference between the Leading Span A and Leading Span B), and could be enough to encourage buying. This is also the first time the Cloud has been tested since the Leading Span A crossed above the Leading Span B at the beginning of May.
Within the Cloud, there is also a 100% projection ratio at $522.00, which, for many harmonic traders, will be recognised as a potential AB=CD support level. Further to this, a trendline support (from the low of $493.86) is close to this level.
Adding to the above analysis, the Conversion Line appears poised to cross back above the Base Line, which, given the uptrend, would be observed as a bullish signal.
Price Direction Favouring Bulls
The trend in this market and the current support structure suggest that it remains a buyers’ market. Within the Ichimoku Cloud, the AB=CD support and trendline support could provide a floor to which dip-buyers may be drawn.
However, should the Conversion Line cross back above the Base Line prior to testing the above support area, we could see dip-buyers enter this market earlier to challenge all-time highs.

SPY is gonna crater - NVDA was the sign like Cisco and Enron!Besides the TTM squeeze being fired off - I've seen some hedgies go to cash, PLUS I'm seeing huge dark pool buying for 2x and 3x BEARISH SPY ETF's. I bought some $11 SPXS puts for .07 a piece as a hedge. There was a ton of OI in those calls...
Links to dark pool buying in the comments.


$SPY May 22, 2024AMEX:SPY May 22, 2024
15 Minutes.
Oscillator divergence getting sorted out.
At the moment sell below 529.7 and buy above 531.75.
If NASDAQ:SPT crosses 531.75 with bar having close near top, we can buy for 534 range.
And if it closes below 529 with bar close near low of bar i will short for 527.5 levels which also is possible 200 average during the day.
For the day consider the rise 529.07 to 531.51.
AMEX:SPY need to hold 530for a target 533.5 to 534 if 531.75 is crossed.
At the moment AMEX:SPY is struggling around 531.5 three times.
One negative issue I have is, the stochastics had a black bar on top and it retraced say below 25 without creating a black bar at bottom. But once it has crossed 75 there is no black bar on top. So, momentum seems to have lost. Have marked in chart.
So, I will wait for first 15 minutes after open and take a call.

SPY (S&P500 ETF) - Weekly - Potential Resistance Price TestSPY (S&P500 ETF) has been in an uptrend since 2023 and is approaching its all-time-high price resistance again.
$523.07 is the current all-time-high price resistance.
$497.83 is the current support level price, and also the 0.236 fibonacci level.
Bullish Scenario: If SPY price breaks out above $523.07, the next resistance price targets could be: $537, $550, $563, $575.
Bearish Scenario: If SPY price reversse back down, a potential lower-low in the price could be set over time. Support price levels could be: $508, $497, $489, $476, $466.
Note: corporate earnings, FOMC interest rate changes, government legislation, breaking news, and global events could override technical chart patterns.
Date created: 05/10/2024

Spy Ascending TraiangleTo day we may push pass 531.11 - 531.57
There is a trend line that started on the 17th that now has two touches of support to the upside.

SPX repeating patternSPX seems to be repeating a previously occured pattern, let's see how this plays out !

Elliott Wave Analysis on S&P 500 ETF (SPY) Calling for More UpsiShort Term Elliott Wave in S&P 500 ETF (SPY) suggests the rally from 4.20.2024 low is in progress as an impulse. Up from 4.20.2024 low, wave ((i)) ended at 510.75 and dips in wave ((ii)) ended at 499.49. The ETF has extended higher in wave ((iii)) with internal subdivision as another impulse in lesser degree. Up from wave ((ii)), wave i ended at 508.19 and dips in wave ii ended at 499.55. Wave iii ended at 518.57, wave iv ended at 514.98, and wave v ended at 522.63 which completed wave (i).
Wave (ii) pullback has ended at 518.18 which subdivides into a double three Elliott Wave structure. The ETF then extended higher inw ave (iii) towards 531.52 and pullback in wave (iv) ended at 527.32. Final leg wave (v) is in progress and can see a few more highs before ending wave (v) of ((iii)). Afterwards, it should pullback in wave ((iv)) to correct cycle from 5.1.2024 low before it resumes higher. Near term, as far as pivot at 499.73 low stays intact, expect dips to find support in 3, 7, 11 swing for further upside.

SPY 1H Inside BarEasy plan. A break of either the green level for calls or red level for puts. Range defined in-between.

SPY to 519SPY is currently in an uptrend, and failure to break and stay above 531 will lead to a double top, which will likely see the stock come back to the 519 level.

Yea, its a bull flag or whatever...Its clearly setting up for ATH and a push higher if everything goes accordingly.
What I am looking for is the DXY to push above 105 again and the VIX to start pumping, if these dont happen tomorrow after earnings then we are set up to rally until July - October.
I can see a pump until election time playing out, volatility is about to pick up big time within the next 6 months.
