SPX vs US2Y and US10Y Spread. The lagging recession indicator.As seen here we can expect pivots once we have a divergence appearing at the spread, usually the indices lag and follow only once it starts free falling. Something to watch, another great indicator.
Government bonds

How to position for yield curve un-inversions!It has been some time since we delved into the intricate world of interest rates and their prospective trajectories. With the yield curve experiencing significant movement in recent weeks, it's high time we reassess our stance. Following a staggering 500 basis points increase, we now find ourselves potentially nearer to the end of the rate hike cycle than ever before. The recent hawkish pause announced in the last meeting has left market participants on tenterhooks, pondering the future course of action in the ongoing battle against inflation.
Given the downward trend in inflation and the possibility of at least one more rate hike, 'real' yields have ascended beyond the 0% level, as depicted in the chart above. Since the 2010s, real yields have consistently struggled to surpass the 1.2% level. However, the recent lower inflation prints place the 'real' yield at a new decade high of 1.25%. So, how does the yield curve inversion behave during periods of real yields? Interestingly, in three of the past four instances, the curve 'un-inverted' once real yields exceeded 0.
Of greater significance is the yield curve's response after the Fed cuts rates. Since 1989, this has been a key signal of the yield curve un-inversion. Given this event's proximity and the current 2Y-10Y yield curve, we contemplate the optimal strategy to capitalize on this likely un-inversion.
One approach is to examine all possible inversion combinations between the 2, 5, 10, and 30-year yields. All these combinations present an inverted curve, except for the 10Y-30Y segment.
Upon dissecting the analysis to focus solely on 2-year inversions, we observe the following:
The 2-year inversion is generally the steepest, with the 2Y-10Y ranking as the most inverted segment of the yield curve. All inversions anchored with the 2Y are at their all-time highs, plunging us into uncharted waters.
In contrast, the 5-year and 10-year yields exhibit more subdued movements. Their inversions have yet to reach all-time highs, and the overall range of movement is relatively restrained.
Therefore, to maximize returns on the un-inversion move, one could position to short either the most inverted section of the curve, the 2Y-10Y, or the 2Y-30Y, which typically experiences the largest movement upon un-inversion.
Handily, CME has the Micro Treasury Yield Futures, quoted in yield terms, which allows us to express this view in a straightforward manner allaying the complications with DV01 calculation. By creating a short yield spread position, we are not merely speculating on the direction of individual yields but rather on the relative movement between them. Trading the yield spread instead of just an outright position in a single part of the curve also protects us from parallel shifts in the yield curve, especially in volatile times like these. This strategy takes advantage of the yield curve dynamics, particularly the inversion trend we've been observing. We create the short yield spread position by taking a short position in the Micro 2-Yr Yield Futures and a long position in the Micro 10-Yr Yield Futures or Micro 30-Yr Yield Futures to express the curve un-inversion view, with 1 basis point move equal to 10 USD.
The charts above were generated using CME’s Real-Time data available on TradingView. Inspirante Trading Solutions is subscribed to both TradingView Premium and CME Real-time Market Data which allows us to identify trading set-ups in real-time and express our market opinions. If you have futures in your trading portfolio, you can check out on CME Group data plans available that suit your trading needs www.tradingview.com
Disclaimer:
The contents in this Idea are intended for information purpose only and do not constitute investment recommendation or advice. Nor are they used to promote any specific products or services. They serve as an integral part of a case study to demonstrate fundamental concepts in risk management under given market scenarios. A full version of the disclaimer is available in our profile description.
Reference:
www.cmegroup.com
www.cmegroup.com
www.cmegroup.com

US 10Y TREASURY: staying elevated The resilience of the US economy is evident in the latest posted economic figures. Both business and consumer sentiment is improving, while inflation, expressed through PCE continues to slow down. Still, the pending issue is what the FOMC will do at their meetings till the end of this year. As per Fed`s Chair Powell comments, two more rate increases should be expected. Whether that will actually occur, is to be seen till the end of this year, still, possibility of “soft landing” holds.
The 10Y Treasury ended Friday`s trading by reaching a level of 3.89%. It seems that the market is anticipating further rate hikes which might stay for a longer period of time at higher levels. With this move, a new chapter on charts was opened, in which terms, a road toward the 4% is now open. This level might be tested in the coming period. As for the week ahead, 10Y yields will open at level of 3.90%. It could not be noted at this moment whether yields will go higher from this level. In case of a short reversal, 3.8% will be tested, with lower probability that yields might return to the 3.6% level.

SG10Y Govt Bond and SPY relationship Part VII - Where the bear?And so we have a clear break out of the SG10Y again.
And based on previous inverse co-relationship, the US equities should be retracing in a down cycle.
The thing is that for now, at least in the short interim, the US equities appear bullish and is likely to stretch further upwards.
This co-relationship is either being tested or has been broken.
For now, the opinion is with the former... and it might be telling of the incoming magnitude when the equities flip back down - hard(er).
Observe and be ready...

Notes for the futureSideways anomaly but I just want to be prepared in case it pops. Sooner or later it has to but it won't change my mind. This market is a time machine for anyone pretending to be a god. Funny how god and dog are so similar. This puppy might make us ask who let the dogs out? Because it doesn't want to move at all.

US10Y for shits and gigglesLet's see if it's accurate in the future since right now it looks like the mad market continues.

Ten year yield testing this channelThe US treasury bond ten year yield has been in a down trend channel for the last 9 months in the context of an uptrend that started in 2020. This could be a bull flag. The price now is at the top resistance line of that channel. A breakout could indicate higher inflation and interest rate expectations.

Bond Yield Inversion vs. SPXThis is nothing new, really. People who have been in markets long enough know that when short term bond yields (3 month and 2 year, for example) come up to meet and invert to a higher yield than longer term bonds (like the 10 year, 30 year etc) that it often precedes a large market sell off as well as a recession that affects most everyone, not just stock prices.
On this graph, I maybe got a little carried away. I have the 1 month, 3 month, 1 year, 2 year, 10 year and 30 year as well as the actual Fed Funds rate with SPX in the background.
This goes back to the mid 1990s, you can see the dotcom boom, you see the yields invert, SPX tops and then takes near 3 years to finally find bottom before reversing course.
Unfortunately for long only stock holders, the treasury yields started to climb with stocks as well until they inverted in 2007 once more. Stocks started to come down, and, well, then 2008 happened...
You can see that in general, the fed funds and the shorter term yields find a plateau at their top, tend to stay there for awhile (sometimes for a whole year), then as they start to come back down, the stock market tends to be near its highs, and then the stock market starts to come down.
Big money tends to see higher treasury yields as a safer haven for their money than stocks at this point. If you have the ability to hold the treasury to expiration, you're guaranteed to get 100% of the money back plus whatever the yield % was at time of purchase as interest paid to you by the government.
Furthermore, there is an inverse relationship between bond yield percentage going up, and the value of bonds on the open market. As yields go up, the value of bonds goes down. Vice versa, as yields start to retract, bond values go up. So, there is high incentive to start buying a lot of bonds as the rates plateau near the top. Maybe some of these large hedges start to sell some equities as a hedge and buy more bonds as we get to that point. Rebalance their portfolio to be more bond-heavy.
Higher short term yields, higher fed funds rate also generally mean that the cost to borrow money for anyone is higher. Higher interest rates means more money out of the pocket of anyone borrowing to pay interest. Bonds themselves are just government debt.
The stock market is generally forward looking, so it's often making moves in response to moves in the bond market before main street really starts to feel the effects of the tightening in a meaningful sense. As time has gone on, it seems the market is reacting earlier and earlier to rate hike cycles.
Take 2018 for example, the yields didn't really invert until they all were already on their way back down. 2018 had volmeggedon to deal with to start the year, then came back, set a new high, then had a very rough second half of the year as bond yields plateaued. But, as the market saw that this small rate hike cycle didn't do any meaningful harm to the economy and started retracting, stocks took off again:
Then COVID happened, yields plummet, cost to borrow was as cheap as it ever has been, the government pumped money everywhere to try and prevent a complete collapse of everything, stocks were off to the races harder than ever before after finding bottom just a few weeks into the pandemic.
But, mentioning the market kind-of getting ahead of itself again, we had all of 2022, as it became apparent that inflation was now raging and bigger rate hikes than we've seen since the Great Financial Crisis would be necessary, the stock market sold off despite the economy still showing very solid recovery out of the pandemic.
But now, treasury yields are still climbing, but so are stocks. Treasuries hit a little hiccup in March as a couple regional banks were found to be overlevered in treasuries that had too low of a yield, and as more people began withdrawing money and those banks needed liquidity, they had to sell those treasuries at a loss. If they didn't have to come up with that liquidity and were able to allow those treasuries to mature, they make that small percent of interest for holding them. But because they were forced to sell them as treasury values were at a low because they had inadequate liquidity to cover deposits being withdrawn.
But, now maybe surprisingly, despite some of the troubles and the market sell off for most of 2022, we're now not all that far off of CBOE:SPX 's highs from the end of 2021, start of 2022. But, we still don't know what the full effect of the current high interest rates are going to be. It's possible the old mechanism where when we finally reach the top for interest rates, right as we get the precipice of rates starting to fall, equities top out and start to sell off shortly thereafter again. For how big and how long? Who knows.
Despite the recent 'skip' from the federal reserve, opting to not hike at the June meeting, the 3 month yield, which typically is what most closely matches/leads what the fed is going to hike to, has in recent days made it look increasingly likely that we see at least a quarter point hike for July. The market probably won't like that news, maybe we get a few red days, but if economy data coming in still looks solid and inflation is showing a slow, steady reduction, it may not be long before the market decides to go back up again. We might even go past the 2021/early 2022 highs this year.
But, eventually, we'll find the top for yields, and I have a feeling a bigger correction for stocks will loom at that point. For right now, seems like a bad idea to go against the bulls. But, keep an eye out for when we finally reach the top in treasury yields, look in particular for the 3 month, fed funds and the 2 year to go sideways. Once all 3 start to go down, pay closer attention to economic data coming in. Also take a look at www.tradingview.com for evidence of lower highs off the lowest point for the current cycle. You see the combination of the two, we may be in for a big correction. Again.

We did not just consolidate this long for a small move.I am not certain how quick or slow we move up here, but I would imagine 8% terminal rate, give or take.
This is going to severely harm the economy, and help the strength of the dollar, and also secure it as reserve currency.

us 10yr looks like it breaking out from the cup and handle patteTVC:US10Y looks like it breaking out from the cup and handle pattern and could be on its way back to 4.1%

The 2-yr finally broke through resistance todayThe TVC:US02Y finally broke through key resistance today, and now has a chance I think to go back to 5.1%.

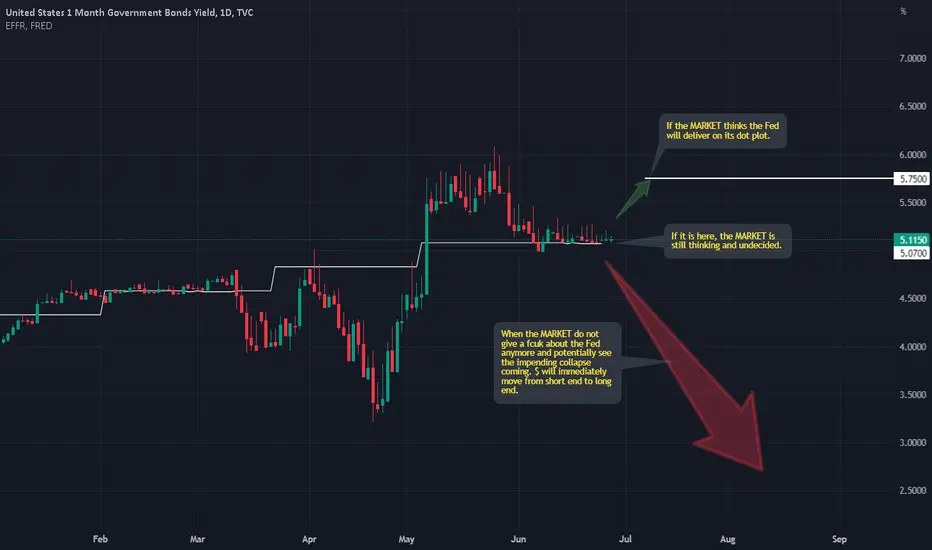
US01MY : An important chartThis chart is actually quite important. I take a look at it all the time.
It would be quite interesting when it starts to fall, ever so slightly at first, just below the EFFR.
We also need to understand which arrow is the BIGGER one. The green or the RED. This can easily answer which is the bigger POTENTIAL :)
Good luck.
P/S : DO not just believe what I say. Use your common sense.
If we look at the chart of most FX pairs, try not to look at the price action. Instead, look at the movement in volume. What I can see is that the MARKET is checking out if there are anymore BUYERs of risky assets. We can see it is running out of buyers, i.e. suckers. What lies ahead is easy to figure out.
GB10Y vs GBP/USD #gilts #gbp #recessionThe 10 Year gilt vs the GBP.
Fractal taken from 2007 just before the 2008 recession.
interest rates are expecting to keep raising! why this chart indicates they are coming to the end of the tightening cycle!
as mentioned before I'm expecting more strength in the pound due to weakness in the dollar.
Expecting the BOE to pause rate hikes next meeting after the aggressive 50 bpts increase.
GBP strength would relieve pressure from BOE and we should see inflation drop. possible we see more banking contagion and possible further hike's if inflation doesn't drop fast enough.
but how long can they tighten for? before revenue loss exceeds Debt. credit will be way more expensive, mortgage demand drops. - this would cause a pull back in the housing market, this is when I would expect the fed to crash rates, to support crashing market's and the BOE to follow suite.
going off this chart 2007 fractal - by April 2024 we should see GBY10 back down too 2%.
which mean's the fed must of cut real rates by then in order to see BOE follow their policy.
bad for pension's as real inflation will be much higher than 2%.
but would create much more liquidity for market's and cheaper debt for growth. more revenue to the service the mountain of debt, in order to strengthen GDP.

US 10Y TREASURY: pending 3.6% levelFed Chair Powell was speaking in front of the US Senate during the previous week, and confirmed what was previously said, that the Fed would most probably hit the rates for two more times till the end of this year. Market expectations are that the rates would be increased by additional 50 bps, which means two times 25 bps hikes. The 10Y US benchmark yields were moving around 3.8% at the beginning of the week, but ended the week around 3.68%. Still, Friday's trading close was at a level of 3.73%. The market continues to perceive an inverted yield curve, meaning that the rates would certainly have to go down. Charts are also perceiving some further relaxation in 10Y yields.
Charts continue to point to the level of 3.6% as the next target of 10Y yields. This level might be tested in the coming week or two. On the opposite side, at this moment there is no indication that the yields might go higher from 3.8% and there is a low probability that this level might be tested for one more time in the coming week.

10y and 2y yield curves inverted--market crash when?The blue line is the inverted yield curve 10y-2y. Two other times where it got to low levels preceded the 2001 and 2008 crashes. But the orange circles mark where the crashes actually began and the markets fell, several months later after the inverted yields bottomed. The bottoms last five to eight months each before the inverted yields started to resolve and move up again. But it was 6-8 months later when the crashes began. If this holds true for today, our bottoming process is just getting started so we could be six months from the inverted yield curve moving up. Then it could take six more months before a crash begins.

German government bonds forming a triangle in my opinion it has chance for another wave up
make sure the triangle confirms first

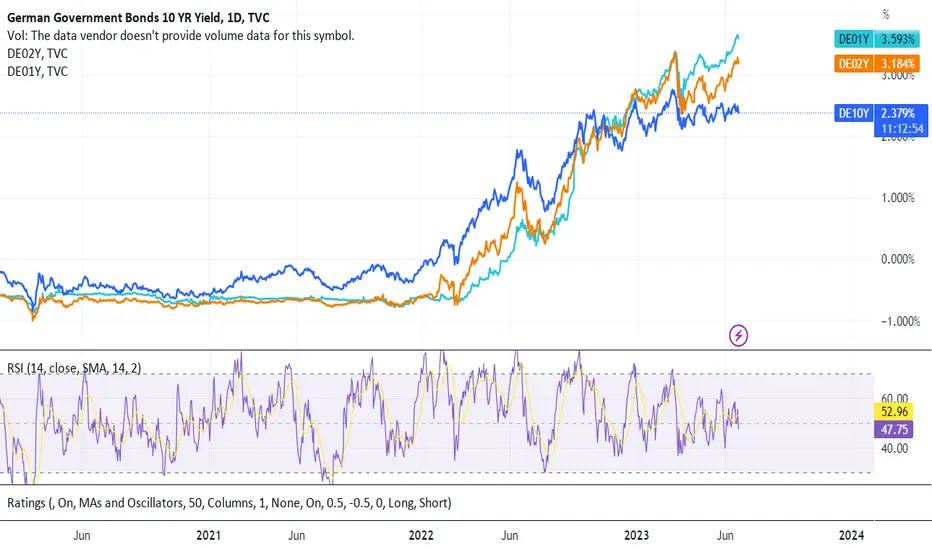
German Bond Yields DE10Y, DE02Y, DE01YThe German 10Y notes began to move higher slowly since early 2021, and rapidly in 2022 like we all know of. The ECB deposit facility as of 21.06.23 is 3.5% and main refinancing operations is 4%. Like most of us know, the bond market is a major leading indicator of the future rates, and the DE02Y and DE10Y indicate lower rates ahead in the coming months, hinting that we're at the top of interest rates hiking cycle by the ECB. Lets watch how things fold out ;)
GB10Y - UK pensions at risk? update. #BOE #recession"The Bank of England has hiked interest rates to 5 per cent in a further blow to homeowners struggling with spiralling mortgage costs.
The rise, up from 4.5 per cent, is the sharpest increase since February – surprising economists who had been expecting a smaller increase of 0.25 percentage points – and sends interest rates to their highest level in 15 years!
The move is set to deepen the mortgage crisis as borrowing costs rose for the 13th time in a row in an effort to curb inflation."
*Fractal taken from 2007 high for the GB10Y - Gilt/Bond, reaching similar level's before reversing back down. I would expect the same to happen going forward. inflation is way above current interest rates, with the BOE stuck between banking crisis or a recession. I believe we'll see both! - Banking crisis, potential bail out's - expanding the currency supply further which will create more inflation! Pension's will continue too loose value, as bank of England will not be able to raise rates high enough to match inflation.
"It comes as the rate of inflation remains unexpectedly stubborn – frozen at 8.7 per cent in May. Analysts had expected the Consumer Prices Index, which peaked at 11.1 per cent in October last year, to fall back to 8.4 per cent."
What does this mean for the value of the pound? I'm actually expecting more strength in the GBP - purely from the weakness of the dollar. I would expect the fed to continue to pause now that inflation is finally dropping. FedNow expected to launch on the 1st of July, this will enable faster payment's and a surplus of dollars entering the markets if needed. again weaken's the purchasing power of the DXY - by adding more supply to the currency.

Bonds down on the short term? Dear Ziilllaatraders,
We should expect a short term sell.
Greetings,
Ziilllaatrades


Why did I know that bond yields were going to fall?To obtain this information, we need to look at four things:
-Fed Rates: The Federal Reserve's interest rates decisions can have a significant impact on financial markets and the overall economy.
-US5Y (US 5-year Treasury bonds): Yields on US 5-year Treasury bonds are an important measure to assess market expectations for short-term interest rates and investor sentiment regarding the economy.
-US10Y (US 10-year Treasury bonds): Yields on US 10-year Treasury bonds are also a key benchmark to evaluate investor expectations for medium-term interest rates and market risk perception.
-US30Y (US 30-year Treasury bonds): Yields on US 30-year Treasury bonds provide insight into investors' long-term expectations for interest rates and confidence in long-term economic stability.
Monitoring these indicators can provide valuable information about the direction of interest rates, market sentiment, and the overall health of the economy.
If we observe these three together, we can see that the maximum point marked with a red rectangle, the US5Y, is the only one that violated that high. This suggests that the movement in the US5Y was a manipulation (liquidity pool), as none of the other bonds violated the high. Also, the DXY (US Dollar Index) did not violate it and has already created a lower low. This indicates that we can expect the completion of this move in the DXY and a more aggressive decline in bonds.

The downward channel in gold remains intact.The market's current reluctance to accept a 3.65% rate and the potential for further dollar support can act as resistance for gold, confirming the bearish scenario.
A break of the 1954 dollar pivot could serve as a suitable confirmation for the continuation of the downward trend.

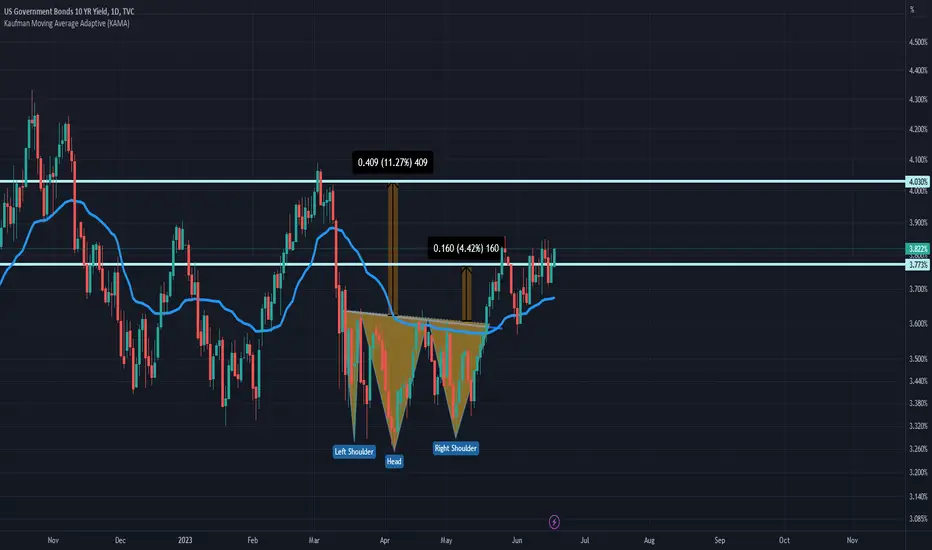
US10Y // REVERSE SHOULDER HEAD SHOULDER FORMATIONAlthough there is an inverted shoulder head shoulder formation on the chart, the targets are drawn according to Fibonacci.