LONG SDS target 30In my opinion with no cut rates for 2024, stock markets should drop 10-15% from current levels. So the best play will be long SDS.
Regards,
SDS trade ideas

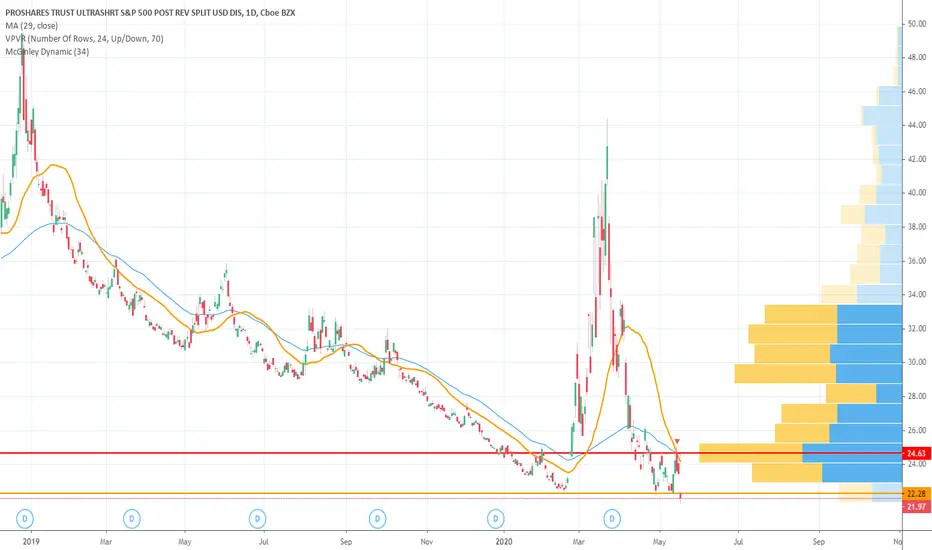
$SDS Double BottomAMEX:SDS is showing a Double Bottom pattern, making it an excellent hedge against any long positions you might hold. It is recommended for swing trading purposes and not as a long-term investment strategy.

BUY LIMIT SDSLook at the top of the 3810-3900 previous inflection point for the S&P 500 index.
The important support will continue at 3702 during the period this week.
The next important support level is 3509,Which is a 50% retracement of the full height from the 2020 pandemic lows.
- The last VIX high at 35.05, the close below 32.05 is a buy signal for the indices,
(The analysis fails if the index breaks the bottom of the price 2312.4)
my best wishes

SDS SPX Short S&P500 Is The US market crash coming ?Is The US market crash coming ?
We have 3 types of “crashes”
Correction <15% downward movement in a major indicy
Bear Market <20% downward movement in a major indicy
Black Swan event, something very unexpected that tanks the market, think 1987, 1929, challenger disaster, 911 and so on.
The fourth type is the 1919, 1929, 1999 and 2008 scenario that people generally refer to as a “crash” 2022 a new one ?
Sincereley L.E.D In Spain 14/05/2022


looks like it will take 80% infection rate to kick this market in the teeth...it will happen as long as they have raliies with out masks and mall and restaurants with people jostling and mingling etc
once we hit 100k cases per day... watch out below...

the gap at top could get filled before the descent into abysswe will see...trump trying to paper up the cracks until election...
Follow
Follow
Follow

will SDS go to its high again...i hope soi need to get into the markets if this peaks...
FOLLOW
FOLLOW
FOLLOW

Closed Long Calls on SDS bought at 500 Hull for 40% gainClosed Long Calls on SDS bought at 500 Hull for 40% gain


Expecting Another Up Gap WeekendGet it while the gettin's good before after hours trading is closed because SPXU, SDS, TZA and any other ETF's you can think of that short the market will likely up gap over the weekend just like they have the past 2 weeks. Especially in light of China's response to the US...."We aren't interested in negotiating right now."
This is not financial advice - it's my own current strategy - good luck with your trades!

I'm Long and That's The Short Of ItWhen we see the market open on a news induced low like today, SDS is a good ETF day trade to keep in mind. What you are doing in essence is shorting the S&P 500 as a hedge against your daily losses (I'm doing GREAT today).
It's also a great one to hold as a hedge against a recession if you a long term investor; it's recent creation and history is interesting and is a good read. When the housing bubble popped, at the height of the recession in 2008 it reached upwards of $2,000.00
There are others that are great to hold entering recessions and times where you might want to hedge against interest rates as well. You might want to look into the Direxion Daily 20+ Yr Bear 3X (TMV), the ProShares Short 20+Year Trsry (TBF), and the ProShares UltraShort 20+ Year Trsy (TBT).
Good luck out there!

How to Short The S&P 500When the S&P 500 is diving on news like this morning, sell bad trades and buy SDS to short it. This is how you make money in bad situation.

Possible result of no trade agreement & global slowdownJust noticed this. Could be something to keep an eye on.
I'm net short on the DJI & S&P right now.

Short the S&P 500!Wave 4 correction appears to be complete.
Got a little help from Todd Gordon, Elliott wave analyst/trader.
Check him out!

Shorting the S&P like a bossGetting ready for the floor to fall out from under our extended bull market.
This is gonna be a great place to chill and gain from the losses in the S&P 500 index.
I expect the S&P could lose up to 20-30%, which would also put us over the needed 20% for a bear market to ensue.
ABC correction is beginning here after this wave 5.
Buying in @ $40-41

SDS S&PLooking to have found a possible bottom or top depending on how you view this. SDS looks to capatilize on a bearish market. Seems a safe hedge given current S&P conditions.


Trading Psychology 2 How Strong is your Trading Mentality?How strong is your Trader Mentality?
Signs of an "Amateur Mindset"
If you identify with any of these characteristics while trading, you are suffering from an Amateur Mindset. These are normal when first learning how to trade, and even common in advanced traders who have not yet mastered their trading psychology. Very succesful traders may still occasionally experience some of these symptoms while increasing positions, but as far as day to day, do not.
Hesitation to enter positions meeting edge criteria
Fail to exit trades not performing to expectations
Feelings of fear (missing out, failure, success, leaving money on the table, etc.)
Upset/mad when prices go against you or happy / relief when prices go your way
The market is too painful to watch (pain avoidance)
Market actions led by emotions / feelings / stress
Forms and applies rigid rules for entry / exiting market
Afraid to make mistakes / upset after mistakes
Signs of a "Probability mindset" or Professional Trader
Enters or exits trades without hesitation
Does not experience internal conflict while entering, or managing trades
Willing to take a loss (accepts his risk)
Flows with the market seemingly effortlessly
Not attached to outcome of any trade
Emotions / stress do not lead to market actions
Enters / exits however necessary
Accepts mistakes and moves on
Interestingly, it is easy to separate a professional trader from an amateur, not based on profits or losses, or the amount of ticks he makes a day; but based on his actions in the market. By observing how a trader interacts and engages with the market it is obvious if his actions were led by emotions or intuitively based on what the market told him to do at the time. Professionals flow with the market, and do not fight or resist it in any way. As a result money seems to flow effortlessly into their accounts, and their equity curve is that of a healthy bull trend. Amateurs are constantly fighting the market and themselves, with actions led by what they think, perceive as a threat, or the false belief that they know what is going to happen next. The outcome is a slowly depreciating account balance, and an equity curve that is flat or in a bear trend. The later is a sign of trading errors made by the trader and not that of an edge being executed properly.
Continued...

SDS Stochastics Oversold At The 20SDS Waiting For New Color To Confirm Direction
Color Blue
Number 4
