SPX repeating patternSPX seems to be repeating a previously occured pattern, let's see how this plays out !
SPY trade ideas

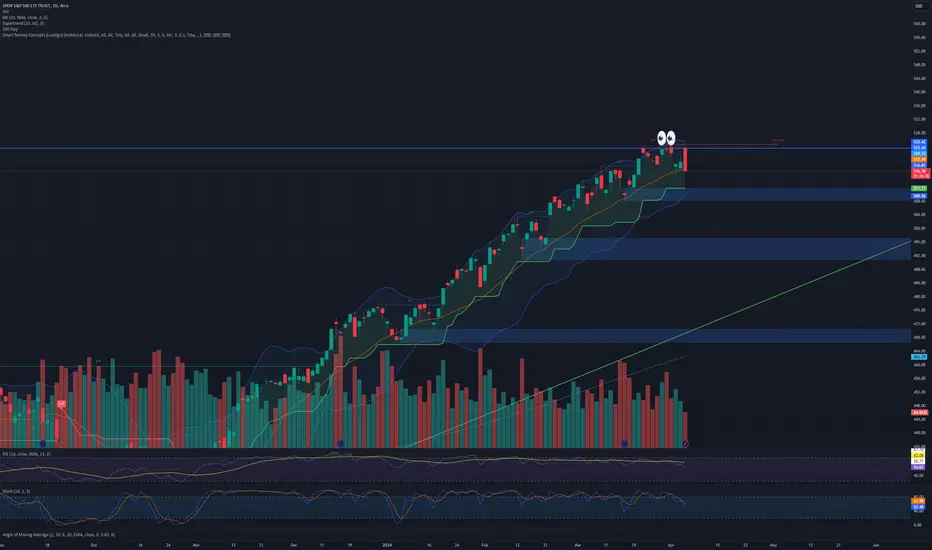
$SPY Triple Top...AMEX:SPY getting spicy here, looks like a triple top for now headed into a lot of world news, ie Iran/Israel/Biden ... I think we've been overdue for a correction, this is a VERY solid base to start a downtrend and fill some gaps before heading back up for Trump Presidency... Buy the rumor stuff...
No positions, will look for continuation tomorrow...
- Prof
Market(s) move the world around Events occur around the chart(s) and never vice versa.
Its aways all about WHEN to move the market

Spy is hotLooks like AMEX:SPY can hover here and trade higher from these levels. RSI is hot and momentum is carrying this uptrend. Low volume = sellers not in sight. NASDAQ:NVDA earnings might push it to close above $531.50 by Wednesday. A down day with high volume will be the beginning of a pullback.

SPY (S&P500 ETF) - Weekly - Potential Resistance Price TestSPY (S&P500 ETF) has been in an uptrend since 2023 and is approaching its all-time-high price resistance again.
$523.07 is the current all-time-high price resistance.
$497.83 is the current support level price, and also the 0.236 fibonacci level.
Bullish Scenario: If SPY price breaks out above $523.07, the next resistance price targets could be: $537, $550, $563, $575.
Bearish Scenario: If SPY price reversse back down, a potential lower-low in the price could be set over time. Support price levels could be: $508, $497, $489, $476, $466.
Note: corporate earnings, FOMC interest rate changes, government legislation, breaking news, and global events could override technical chart patterns.
Date created: 05/10/2024


Yea, its a bull flag or whatever...Its clearly setting up for ATH and a push higher if everything goes accordingly.
What I am looking for is the DXY to push above 105 again and the VIX to start pumping, if these dont happen tomorrow after earnings then we are set up to rally until July - October.
I can see a pump until election time playing out, volatility is about to pick up big time within the next 6 months.

$SPY May 21, 2024AMEX:SPY May 21, 2024
15 Minutes
For the rise 525.18 to 531.52 4SPY earlier had retraced to 527.33.
Being 61.8% retracement usually it will make double top.
On that basis AMEX:SPY hit 531.56 today.
It retraced to 529.17.
Therefore 527.33 can be treated as HL.
Now that number should hold for uptrend.
Hence if we consider the rise from 527.33 to 531.56 AMEX:SPY need to hold 528.5 - 529 levels to continue the trend.
But we have oscillator divergence.
Hence holding 527 is important else we have a target 526-524, 524 being 23.6% retracement for the move 499.55 to 531.56.
Hence for the day
If 527 is broken i have a target 526 which is 200 averages in 15 minutes.
And if 531.75 is broken with good close on bar then target is 534.
I expect a one-sided move today based on open.

SPY 1H Inside BarEasy plan. A break of either the green level for calls or red level for puts. Range defined in-between.

#SPY Analysis, Key Levels & Targets for DAY Traders #SPY Analysis, Key Levels & Targets for DAY Traders
Today’s Trading Range is a little bit stinky, in my opinion. Implied move from options is small. Volume yesterday was extra stinky low. 37M when everything settled and 11M around 12:30ET…
I don’t like low volume trading so even though I will be trading a little bit what I’m really looking for is VOLUME….
Outside of that - The 35EMA has held us up since FOMC, so that’s the other level I’ll be looking for today.
Complete walkthrough in last nights video. GL today, y’all….

Spy 🐻🚩Bear flag showing here on spy and a few other indexes/ sector.
This bear flag would be consider a handle for a inverted cup and handle.
Smaller time frame looks like this spy
And heres NQ
We are headed back to bear flag support around 500.. from there we could either finish one more bounce higher 511-514 before finishing the leg down to 480
The bear flag starts below 500, first target is 495 gap close..
The Inverted cup start below 495... short it and every pop to 480
Vix 2hour - bullish wedge
DXY 4hour - bullflag

SPY to 519SPY is currently in an uptrend, and failure to break and stay above 531 will lead to a double top, which will likely see the stock come back to the 519 level.

Does SPY bottom this week?SPY 5/24 Levels
As AMEX:SPY continues to climb and climb the bull rally has no sign of ending. We are expected to have slight weakness this week although seasonals are indicating this week is the bottom. The weekly levels are :
Market Makers Hedged - Upside $536.50 Downside $521.50
Markets Expectation - Upside $535.13 Downside $524.40
Liquidity Levels - Lay at the market expectations
Pivot - Yellow Box

SPY What Next? SELL!
My dear subscribers,
SPY looks like it will make a good move, and here are the details:
The market is trading on 529.43 pivot level.
Bias - Bearish
Technical Indicators: Both Super Trend & Pivot HL indicate a highly probable Bearish
continuation.
Target - 519.19
About Used Indicators:
The average true range ATR plays an important role in 'Supertrend' as the indicator uses ATR to calculate its value. The ATR indicator signals the degree of price volatility.
———————————
WISH YOU ALL LUCK

SPY S&P500 etf Bearish DivergenceIf you haven't already purchased SPY after the 2023 forecast: forecast:https://www.tradingview.com/chart/idea/l6U1M9dJ/
then it's important to be aware that there's a significant bearish divergence in the RSI of SPY, the S&P 500 ETF, which initiated at $469.
Anticipating a technical retracement to $495, given its prolonged period of being overbought!

Top hunting the illusive dropStill looking for the spot I am will to short. I see we still could be a week away.
Each day i will post what I see and if a trade develops than we find it together.
I have no idea of these threads having any value to anyone, so comments or feed back woud be great.

✅SPY GROWTH AHEAD|LONG🚀
✅SPY broke the key
Horizontal level of 524$
Which reinforces our
Bullish bias and I think
That we will see
A further move up
LONG🚀
✅Like and subscribe to never miss a new idea!✅

bull trap Stocks Fall Back on Concern Interest Rates to StayBull Trap: Stocks Fall Back on Concern Interest Rates to Stay Higher for Longer
A bull trap occurs when a stock shows a false signal of reversal during a downtrend, luring investors into thinking the price will continue to rise, only for it to resume its decline. Recently, many investors have experienced bull traps, driven by the ongoing concern that interest rates will remain elevated for a longer period.
The Setup of the Bull Trap
During a period of market volatility, certain stocks showed promising upward movements, leading to a sense of optimism among traders. These movements suggested that the market had bottomed out and was ready for a rally. However, this optimism was short-lived as the broader economic indicators continued to signal potential headwinds.
Interest Rates and Market Sentiment
The primary factor contributing to the bull trap scenario has been the persistent concern that central banks will keep interest rates higher for an extended period. This policy stance is intended to combat inflation, but it also puts pressure on borrowing costs for businesses and consumers, leading to a cautious outlook on economic growth.
Investor Reactions
Investors, initially buoyed by the upward price action, began to buy into the market, thinking that the worst was over. This buying activity pushed prices up temporarily, creating the illusion of a market recovery. However, as the reality of higher interest rates set in, the market sentiment shifted back to bearishness, trapping those who had bought in during the false rally.
Lessons from the Bull Trap
Stay Informed: Keep up with macroeconomic indicators and central bank policies.
Technical Analysis: Use technical analysis tools to identify potential bull traps.
Diversification: Diversify your investments to mitigate the impact of market volatility.
Risk Management: Implement stop-loss orders to protect your investments from significant downturns.
Conclusion
Bull traps serve as a reminder of the importance of thorough analysis and cautious investing. The recent market conditions, influenced by concerns over prolonged higher interest rates, highlight the need for investors to remain vigilant and avoid getting caught in false signals. By understanding the factors at play and implementing sound investment strategies, investors can better navigate the complexities of the market.

$SPY Forecast For Years To Comeplease dont take my opinion as financial advice i'm just a 17 year old with some speculations.
with that being said let me explain myself.
With the fed pausing still i believe we will keep rallying till we see our first cut once we get that first cut it'll be the market top.
The fed has been sitting on their hands for way too long and with inflation sneaking back up i dont see it getting better until its too late. stuff will start breaking soon and it'll just put us more and more into a downward spiral.
going into 2025 we will be in a bear market and throughout 2025 we will be trying to fight a spike of inflation which will scare the market and bring us down to 2022 highs and if shit hits the fan we will continue to see downside going into 2026. the battle against inflation isnt a quick fix and this will take time (a couple years)
we will eventually recover but it wont be till we see the fed's inflation goal of 2% for a couple months of consistency that'll be our green light for ATH.
I will be scaling into end of year shorts starting at $550, $560, and final $570 im not missing this opportunity with the stock market this overbought knowing that the dot plot forecasts higher inflation to come next year. Taking profits on the way down as more data comes out.
Thank you for your time and i will be open to hearing others opinion.

SPY: Bears Will Push
It is essential that we apply multitimeframe technical analysis and there is no better example of why that is the case than the current SPY chart which, if analyzed properly, clearly points in the downward direction.
❤️ Please, support our work with like & comment! ❤️


Time to short the marketWere back at the top in this distribution phase if you miss this top there will be one more, but were only gunna maybe see one more pump before a big bear market.

Clear blue SPYsMy play on words... lol. I'm thinking with NVDA earnings next week we could go even higher. The last time SPY flew extra high was on NVDA earnings last quarter. Back to the chart, staying above the mid point of the channel is key. This weekly parallel channel provides the levels for the daily too.
