GOLD DAILY CHART MID/LONG RANGE ROUTE MAPHey Everyone,
Please see our updated daily chart structure.
Currently we are seeing price test support at 2309 with a candle break below opening gap to 2259 but we will need to see ema5 lock below 2309 to further confirm this gap otherwise a failure to lock below will follow with a reactional bounce here to 2355
We have marked the charts with the weighted levels and will use them to track the movement up and down confirmed with ema5 cross and lock confirmation.
We will use our smaller timeframe analysis and trading plans to navigate the range in true level to level fashion.
Our long term bias is Bullish and therefore we will continue to use our smaller timeframes to buy dips using our algo generated levels and setups.
Buying dips allows us to safely manage any swings rather then chasing the bull from the top
Please don't forget to like, comment and follow to support us, we really appreciate it!
MR GOLD
XAUUSD TOP AUTHOR
GOLD trade ideas

THE KOG REPORT - Update End of day update from us here at KOG:
In the KOG Report we said we would be looking for one of the support level to hold and we would like to long into the levels above. We got a nice trade earlier from the lower support level and then we took another long on the second confirmation giving us a blinding start to the week in Camelot. Well done if you followed!
So, what now?
We have support now at the 2306-8 region which if defended should give us completion of the move into the 2320 and above that 2325 region for the coming session. We're in long at the moment protected at break even holding runners, so we will need to wait for a clean confirmation of a turnaround, otherwise we will continue into the order region which was highlighted on the KOG Report.
For now, a great start to the week! We're going to reduce lots sizes and tighten the risk now as we have FOMC and CPi approaching this week. We're expecting some choppy and ranging price action tomorrow and we're not giving anything back unless it's clean.
Let's stick with the plan.
As always, trade safe.
KOG

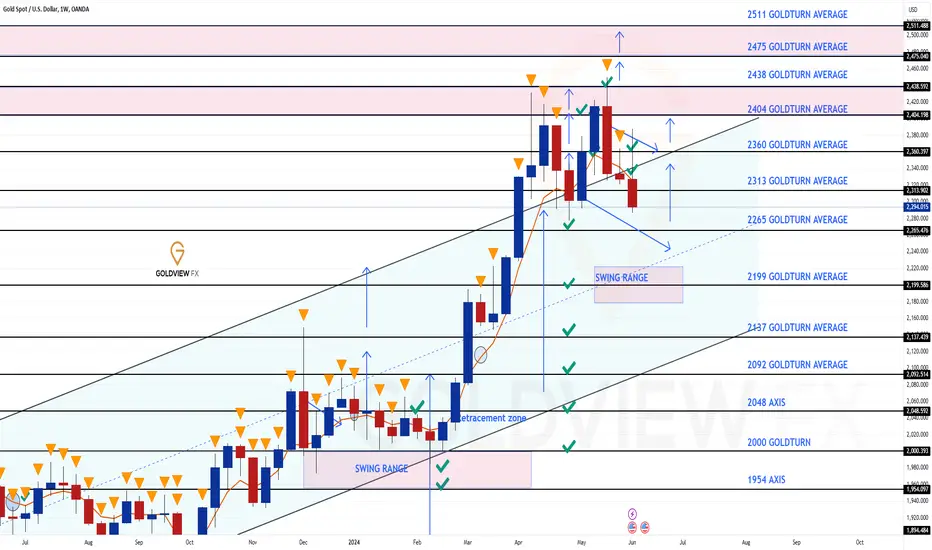
GOLD WEEKLY CHART MID/LONG RANGE ROUTE MAPHey Everyone,
This is an update on our weekly chart idea that we have been tracking and trading successfully over the last few months and currently still being respected.
So far we were able to track the entre move up and down twice with level to level tracking and our long term swing range zones have also provided the bounces each time.
CURRENT UPDATE
We are now seeing price break back in the channel with ema5 opening the 2265, as a potential correctional area also inline with the channel half line. We need to keep this in mind when buying dips and managing risk and range to handle swings.
The levels within the channel will provide the bounces inline with our plans to buy dips, level to level using our smaller time-frames.
Buying dips allows us to safely manage any swings rather then chasing the bull from the top
Please don't forget to like, comment and follow to support us, we really appreciate it!
MR GOLD
XAUUSD TOP AUTHOR
Gold Price Update: Holding Steady but Facing ResistanceAs of now, the price of gold remains steady, hovering around the 2313 USD mark.
Technical analysis indicates that gold is in the midst of a recovery and is approaching the resistance level at 2320 USD, aligning with the 0.618 Fibonacci retracement level. Additionally, since gold is still trading below the EMA 34 and EMA 89, the sellers currently have the upper hand in the market.

GOLD → ECB rate and NFP in the US. What to expect?FX:XAUUSD is supposedly ending the correction wave on the background of fundamentally weaker dollar. ECB rate and US news (Initial Jobless Claims & NonFarm Payrolls) ahead
The European Central Bank is expected to cut interest rates for the first time since March 2016 at the end of its June policy meeting later today.
Meanwhile, markets now have a better chance of an imminent Fed rate cut amid signs of a slowing US economy. Ongoing geopolitical tensions in the Middle East, continue to act as a safe-haven price for gold. Also, everyone is interested in the NFP (as one of the first signs of the Fed's readiness to loosen the policy), which will be published on Friday.
Technically, gold is forming a false break of MA-50 on D1, and breaking trend resistance on H1. All eyes are on the near-term support at 2354-2350
Resistance levels: 2374, 2405
Support levels: 2354, 2350. 2328
Possible support retest (false breakdown or intermediate struggle), which may lead to strengthening of the price. On the background of news, volatility may increase.
Regards R. Linda!

GOLD is expected to have a STRONG UPWARD TREND in the future. Looking at the fourth trading session, yesterday, gold prices experienced a slight decline, but buying pressure surged as soon as the ADP Nonfarm Payrolls data was released during the U.S. session, proving quite robust.
In the morning session today, gold prices continued to rise, breaking through the accumulation area of the past few days.
The wave of risk aversion intensified further following the strong ADP data released last night, exerting a significant impact.
If gold prices surpass the strong resistance level of 2,365, the trend is likely to continue upward. After surpassing the 2365 level, the technical buying side is expected to be stronger than the selling side.
Do you have any other opinions to share? Please share with us, let us know!

Gold shows signs of recoveryDear traders! Gold is falling exactly as Ryder expected last week after not being able to overcome the resistance level of 2,300 USD as expected. From a personal perspective, Ryder is still optimistic about supporting the 2277 USD area (coinciding with the time of testing BB's support level from a technical perspective from TradingView). If this level breaks, the precious metal price could be pushed down to $2,220 while a hold would result in a recovery back targeting the BB band resistance cap at $2,335.
This week the market is interested in some notable information such as the consumer price index (CPI) in May, announcements on monetary policy of the US Federal Reserve (Fed), and data on unemployment benefits. American industry and the monetary policy of the Bank of Japan.

THE KOG REPORT - NFP THE KOG REPORT – NFP
This is our view for NFP, please do your own research and analysis to make an informed decision on the markets. It is not recommended you try to trade the event if you have less than 6 months trading experience and have a trusted risk strategy in place. The markets are extremely volatile, and these events can cause aggressive swings in price.
Please note, this NFP looks like it’s going to slip a lot of traders up, so please be careful if you’re going to trade it, otherwise, like us, stay out of the market and come back to it on Monday where we will find better, cleaner opportunities. We’ve done well in Camelot, we’re not going to risk anything on this NFP, not even a 0.01lot.
So, we have an early session move downside into the support region 2330-35 with extension into the 2325 price point, which if held here could give us bounce up into the order region above 2345-50 which is where ideally we will want to see the price pre-event. We’ve plotted the extreme levels on the chart and the potential move, the extreme support level sitting at 2305-10 which, if they do take the price down into, we feel the RIP upside will come from to at least the 2330 price point.
We would say below the 2355-60 region we’re looking lower, and that price point will need to hold for us to see a continuation of the move. The structure needs to form however!
On the flip, breaking above the 2355 region we could see this attempt the 2400-2405 price point before we even think about shorting it.
It’s one or the other for us, it either comes down into extreme level and we’ll look for a set up after the event, or, it goes up into extreme level and we’ll look for a set up. In the middle, we’re not interested in trying to catch the moves today.
Please do support us by hitting the like button, leaving a comment, and giving us a follow. We’ve been doing this for a long time now providing traders with in-depth free analysis on Gold, so your likes and comments are very much appreciated.
As always, trade safe.
KOG

GOLD ROUTE MAP UPDATEHey Everyone,
2326 HIT - BOOOOOM!!!
Yesterday after completing 2296 and 2306 we confirmed a cross and lock opening gap to 2326 Goldturn. This target was hit today as called out yesterday.
We are now seeing ema5 cross and lock above 2326 opening 2349. We have FOMC today so taking caution and any rejection before the target will be looking for support above 2309 to re-attempt the open gap above or a break below 2309 will open the range below again.
We will keep the above in mind when taking buys from dips. Our updated levels and weighted levels will allow us to track the movement down and then catch bounces up.
We will continue to buy dips using our support levels taking 30 to 40 pips. As stated before each of our level structures give 20 to 40 pip bounces, which is enough for a nice entry and exit. If you back test the levels we share every week in the past 24 months, you can see how effectively they were used to trade with or against short/mid term swings and trends.
BULLISH TARGETS
2296 - DONE
2309 - DONE
EMA5 CROSS AND LOCK ABOVE 2309 WILL OPEN THE FOLLOWING BULLISH TARGET
2326 - DONE
BEARISH TARGETS
2286
EMA5 CROSS AND LOCK BELOW 2286 WILL OPEN THE RETRACEMENT RANGE
2274 - 2259
EMA5 CROSS AND LOCK BELOW 2259 WILL OPEN THE SWING RANGE
2274 - 2259
SWING RANGE
2240 - 2219
As always, we will keep you all updated with regular updates throughout the week and how we manage the active ideas and setups. Please don't forget to like, comment and follow to support us, we really appreciate it!
Mr Gold
GoldViewFX

Update the latest gold price today: Increase again?Hello Everyone! Let's Talk About Gold Prices Today!
Currently, gold is trading around $2,296, showing little movement since last Friday's close. Let's dive into what's happening with gold and what we might expect going forward.
Support from Recent Levels:
Gold is holding steady, receiving support from key levels as highlighted on the charts. This indicates that these levels are crucial for maintaining stability in the near term.
Trendline Observations:
From my analysis, a descending trendline has formed from two recent peaks, signaling a bearish trend in the short to medium term. However, I also anticipate that gold might need to adjust its course and potentially retest this trendline. The expected range for this retest is around $2,350 - $2,055.
What Do You Think?
If gold follows this pattern, we might see opportunities for both buying and selling depending on how it interacts with the trendline. What’s your take on this analysis? How do you see gold moving in the upcoming days?

Gold selling strategy today!Dear traders!
It's time to sell gold.
A quick test of the 2307 support level and a return to the key resistance level of 2320-2323 would be a good entry point for gold.
Sell target targets 2300 USD for a big strike.
2% rule for account management!
Good luck

Gold Forecast? BUY Trend PreferredThe global gold price has seen a slight increase of 0.09% over the past 24 hours, equivalent to a rise of 2.02 USD/Ounce.
Gold prices have edged up despite the US dollar's recovery, as investors remain eagerly awaiting key inflation data from the US and the outcome of the Federal Reserve's policy meeting.
The H1 chart shows signs of a Bullish pattern gradually forming, as it continues to establish higher highs and higher lows.
According to Jessica, prioritizing buying along the trend is still advisable, however, caution is warranted as gold may break the bullish pattern entirely and continue the downward trend.
What are your thoughts on this forecast?

GOLD → Causes of the fall. Can gold fall even lower? 2265?FX:XAUUSD is making a new low and there are a number of reasons for that. The price after Friday's sell-offs is returning in the bearish trend boundaries, which determines the medium-term prospects for us
On D1, price is still in a global sideways range and support (global liquidity zone) is still untested. So why did gold fall? The market was negatively affected by the strengthening of the dollar, due to the positive NonFarm Payrolls for the US market, which generally forms a medium-term mood for the markets. Traders also moved to the bearish train on the background of news related to the suspension of global gold purchases by the Central Bank of China.
Technically, the continuation of the downtrend on H1 is most likely. On D1, a takeover is forming and Friday's close is practically at the minimum values (The movement, theoretically, is not over yet), but before that the market may test the lower boundary of the consolidation (the nearest resistance).
Resistance levels: 2315, 2325
Support levels: 2291, 2267
I expect local strengthening before the subsequent fall. Traders may try to buy back some of the decline (liquidity gathering) before further testing support with a view to breakout.
Regards R. Linda!

What Will Happen to Gold Prices After China's Surprise Decision?Hello everyone! Let's predict the trend of global gold price!
Currently, gold is trading around $2,320 USD/ounce. If the price stays above the support level of $2,300 USD/ounce, it could rise to the resistance level of $2,350 USD/ounce. However, if it fails to break through this resistance, gold prices may decline.
Key Influencing Factors:
Economic Policy from China: Halting gold reserve purchases.
USD Fluctuations: A stronger USD exerts downward pressure on gold prices.
What do you think about this prediction? Will gold prices continue to rise or face a correction? Share your thoughts and let's discuss!

XAUUSD | GOLDSPOT | New perspective | follow-up detailsIn this video, we delve into the upcoming Federal Reserve meeting and its potential impact on the price of Gold. The decisions made during this meeting could significantly influence the market. Gold recently experienced its lowest finish in about a month, influenced by stronger-than-expected monthly U.S. jobs data and reports of China's central bank pausing its bullion purchases.
China, a major driver of the gold rally, might not be done buying gold, but the current pause could signal short-term profit-taking activities. Additionally, the latest US Nonfarm Payrolls report for May revealed an increase in workforce numbers, albeit with an uptick in the Unemployment Rate and a slight rise in Average Hourly Earnings. These factors could lead the Federal Reserve to delay its decision to cut interest rates, which is negative for Gold as it raises the opportunity cost of holding a non-yielding asset.
As market participants await next week's US inflation data and the Federal Reserve’s monetary policy meeting, the US Consumer Price Index (CPI) is expected to remain steady, but a reacceleration could trigger further losses for the gold.
Join me as we dissect the latest market dynamics and explore potential strategies for positioning ourselves for the upcoming price movement
XAUUSD Technical Overview:
In this video, we take a detailed look at the XAUUSD chart, combining both technical and fundamental perspectives.
Our attention is still fixed on the key level at $2,325 for the upcoming week, historically significant and poised to steer trading dynamics. A sustained momentum above this mark could fuel further buying interest, potentially paving the way for fresh highs. Conversely, a bearish tilt below $2,325 might signal a resurgence of bearish sentiment.
Join me as we break down these factors and explore potential trading opportunities in the gold market. Don't forget to like, subscribe, and hit the notification bell to stay updated with my latest analysis and insights.
#GoldMarket #GoldInvestment #GeopoliticalImpact #InterestRates #AsianDemand #GoldETFs #MarketAnalysis #Investing #TradingTips📺🔔💼
Disclaimer Notice:
Trading in the foreign exchange market and other instruments carries high risk and may not be suitable for all investors. The content provided here is for educational purposes only. Evaluate your financial situation and consult with a financial advisor before making any investment decisions. Past performance is not indicative of future results.

Gold price today: Stable waiting for signalDear traders! After suffering the strongest sell-off in nearly four years due to stronger-than-expected US employment data, world gold prices remained stable at the beginning of the week, while investors awaited the monetary policy meeting. currency of the US Federal Reserve (Fed) this week to further clarify the future policy direction of the US Central Bank.
The gold market will be very exciting this week as it enters a waiting mode for important events and data, including the June policy meeting, the Fed Chairman's speech and the price index report. consumption.
Currently, the market is almost certain that the Fed will not make any changes at this policy meeting. However, statements from Fed Chairman Jerome Powell and changes in economic forecasts from policymakers may impact the direction of gold. Further information awaited by the market is US inflation data, expected to be published on Wednesday.
Conclusion about gold and the trend: if bears hold strong resistance at 2328 USD and 2050 USD or the US Central Bank's interest rate forecast shows the possibility of delaying interest rate cuts, the gold market may witnessed another strong sell-off, pushing prices down further.

Gold price today: Pay attention to data from CPIHey there, amazing friends! What do you think the next trend for gold will be?
On today's chart, a close look at the 4-hour timeframe with the Bollinger Bands indicator shows that gold is trading within a narrowing band. This suggests a potential upcoming shift in volatility.
For today, I anticipate that gold will fluctuate between the resistance at $2347 and the support at $2292.
Keep a close watch on these levels to find optimal buy or sell points. Also, stay tuned for the upcoming CPI news at the end of the day, as it could cause significant price movements.
What are your thoughts? Let's discuss!

Gold pulls back to key structureDear traders! Gold's return to a key support structure follows an update to a high of $2,387.
=)2332 USD would be a good entry point to buy on the next bull run!
This is also the previous resistance structure.
If the price forms a Bullish Pin Bar
After touching 2332 USD, the opportunity will be better, because the general fundamentals of the market are still positive.

XAU/USD : Possible of Growth ? Let's See ! By analyzing the #gold chart in the 2-hour time frame, we can see that the price has finally dropped below the $2,300 level and reached the demand zone at $2,288. As you can see, the initial reaction to this level has been positive. Only if the price stabilizes above the $2,277 to $2,288 range can we expect further short-term growth in gold. With the significant drop in gold, a large FVG (Fair Value Gap) and LV (Liquidity Void) have been created, which I expect will be filled in the medium term. The expected return of this analysis is a minimum of 40 to 100 pips, and in the best-case scenario, up to 700 pips.
Please support me with your likes and comments to motivate me to share more analysis with you and share your opinion about the possible trend of this chart with me !
Best Regards , Arman Shaban

Will the upward trend continue?Today, international gold prices are trading around $2,330 USD/ounce, up slightly from the previous session. This price increase is mainly due to expectations for US inflation reports and current geopolitical tensions.
If inflation data is higher than expected, gold demand could increase due to concerns about prolonged inflation.
A strong US dollar could put downward pressure on gold prices, but inflation stability and FED policies will be key factors.
What do you think about this prediction? Will gold prices continue to rise or will there be an adjustment? Please share your thoughts and join the discussion!

Lingrid | GOLD correction and UPWARD CONTINUATIONThe price perfectly fulfilled my last idea. It hit the target. OANDA:XAUUSD has made a pullback to the support level, currently testing the previous daily low and key level at 2350. I believe the market may consolidate within the 2400-2350 range, and potentially continuing the current trend as it has broken out of the range zone. The price is rolling back to retest the pattern, and I expect a retest of the recent resistance zone if the market bounces off the support level. If the market breaks and closes below the support level, it would likely be a return back into the range zone. My goal is the resistance zone around 2378.
Traders, if you liked this idea or if you have your own opinion about it, write in the comments. I will be glad 👩💻

Gold prices consolidate below the $2,300 markDear traders! In general, at the beginning of the second day's trading session, gold recovered slightly to the resistance level of 2,300 USD. However, it seems that buyers still lack the motivation to push through this area and create a potential sideways area for selling.
In the news: The US dollar rebounded early Monday, as markets increased bets on a delay in Fed interest rate cuts based on US Consumer Price Index (CPI) data Wednesday's Fed policy announcements.
Meanwhile, in the absence of top US economic data on Monday, all eyes will be on risk sentiment and US Dollar momentum to provide fresh trading impetus to Gold prices.
Regarding the outlook: From the 1-hour chart, the near-term trend favoring the bears will be more certain if gold cannot maintain the increase above 2,300 USD. And if the decline continues, it is expected that this decrease will reach the 2,270 USD mark. And you. Do you expect a wave of gold price declines?

Gold pulls back to key structureDear traders!
Gold's return to structural importance
Double bottom formation
Find and buy
2352 would be a good entry point to buy
in the next price increase!
It is also the previous resistance structure.
If the price forms a Bullish Pin Bar
After touching 2352, the chance will be better
