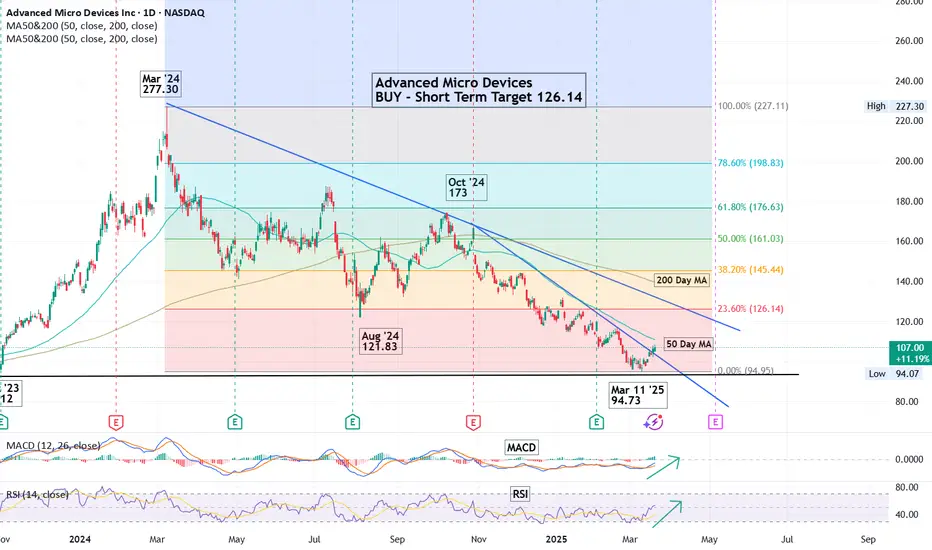
Trendline: Downtrend, connect lower highs and draw a line.
Fibonacci Retracements: High to Low for the period will show where the potential resistance
levels are.
Support Levels: Price held support from previous levels.
For Educational Purposes Only. Not a recommendation to buy or sell.
Fibonacci Retracements: High to Low for the period will show where the potential resistance
levels are.
Support Levels: Price held support from previous levels.
For Educational Purposes Only. Not a recommendation to buy or sell.
Disclaimer
The information and publications are not meant to be, and do not constitute, financial, investment, trading, or other types of advice or recommendations supplied or endorsed by TradingView. Read more in the Terms of Use.
Disclaimer
The information and publications are not meant to be, and do not constitute, financial, investment, trading, or other types of advice or recommendations supplied or endorsed by TradingView. Read more in the Terms of Use.