Bullish continuation in play?Aussie (AUD/USD) has bounced off the pivot, which has been identified as a pullback support and could potentially rise to the 1st resistance.
Pivot: 0.7086
1st Support: 0.6996
1st Resistance: 0.7234
Disclaimer:
The opinions given above constitute general market commentary and do not constitute t

The best trades require research, then commitment.
Get started for free$0 forever, no credit card needed

Scott "Kidd" PoteetPolaris Dawn astronaut

Where the world does markets
Join 100 million traders and investors taking the future into their own hands.

This Bitcoin Bounce Could Have LegsI have been monitoring bitcoin's potential for a bounce these past couple of weeks, and I believe it could be ready to follow through higher. That said, my core bias remains bearish, so I suspect this bounce is more of a retracement than a full recovery.
MS.

GOLD - The hunt for liquidity before the trend continues FX:XAUUSD is consolidating near $5,250 after four days of growth. A false breakout of key resistance is forming a correction, but the market structure remains bullish.
The opening of the Chinese and Japanese markets has added liquidity to the market.
Tariff uncertainty: the Trump administratio

Don’t chase yen, the BoJ still looks independent (hopefully)It has been reported that Japan Prime Minister Sanae Takaichi raised reservations about further interest rate hikes in a meeting with Bank of Japan Governor Kazuo Ueda last week.
The headline gave USD/JPY a lift, with the pair climbing into the 155.80 to 156.2 area.
This move might be a little

US 100 Index – Preparing for the Impact of AI Bellwether Nvidia’As if traders of the US 100 index haven’t already got enough to worry about with the recent upheaval surrounding global trade, related to Friday’s US Supreme Court decision to rule President Trump’s reciprocal tariffs as illegal, which was quickly followed by the White House’s use of other powers to

IBM stock remains weak below $230It has been a challenging stretch for IBM stock after it posted one of its worst declines in years during yesterday’s session, falling more than 12%. The renewed selling pressure intensified after Anthropic introduced a new tool called “Claude Code,” capable of automating systems written in COBOL, a

XAU/USD | Explodes to $5250 – OTE Rejection, Next Leg Loading?By analyzing the #Gold chart on the 2-hour timeframe, we can see that price surged aggressively today and reached the $5250 level, driven by the market reaction to Trump’s 15% tariff announcement. The move was impulsive and expansionary, confirming strong bullish momentum during the session.
Howeve

Salesforce Is Down Some 50% in 13 Months. Here's Its Chart.Salesforce NYSE:CRM has seen its value nearly cut in half in the past 12 months, with the AI-focused software firm's stock hitting a nearly three-year low this week ahead of earnings. Let's see what CRM's chart and fundamental analysis can tell us.
Salesforce's Fundamental Analysis
Led by bill

BTCUSDT is correcting before falling Liquidation phase, no bulls in the market, no buyer volume. A pullback is forming, during which Bitcoin may gather liquidity and test resistance before declining.
Downward trend. Areas that may be of interest to MM: 66,450 - 67,250 - 68,200. A false breakout and the formation of a reversal pattern

XAU/USD Analysis: Gold Surging Toward New HeightsThe Gold 4H chart exhibits a strongly bullish structure with no major signs of exhaustion. After a healthy correction phase in early February, the precious metal has initiated a powerful rally, supported by a perfectly respected long-term ascending trendline. Currently, the price has broken out of a

See all editors' picks ideas
Market Structure Dashboard | Flux ChartsGENERAL OVERVIEW
Market Structure Dashboard is a multi-timeframe market structure analysis indicator. It combines EMA trend detection, swing high/low tracking, market structure labels, Order Block detection, Fair Value Gap detection, liquidity sweep detection, volume analysis, volatility analysis,
Pine Script® indicator

Smart NR2-NR20 and Inside Bar (Zeiierman)█ Overview
Smart NR2–NR20 + Inside Bar (Zeiierman) is a compression + breakout scanner that searches for the tightest Narrow Range (NR) condition across NR2…NR20, plus optional Inside Bar detection. When a valid compression forms, it draws a box around the setup, projects the high/low levels for
Pine Script® indicator

TASC 2026.03 One Percent A Week█ OVERVIEW
This script implements "A High-Probability Weekly Trading Strategy For TQQQ" as dictated in the March 2026 edition of the TASC Traders' Tips , "Trading Snapbacks In A Leveraged ETF”. In this article the author creates a mean reversion strategy intended for systematic and discretionary
Pine Script® strategy

Smart Trader, Concentric Candles & Aristotelian Cycloids
Smart Trader, Episode 05
Concentric Candles & Aristotelian Cycloids
by Ata Sabanci
The Spark — How a 2,000-Year-Old Paradox Found the Charts
━━━━━━━━━━━━━━━━━━━━━━━━━━━━━━━━━━━━━━
It started with a film about Aristotle's Wheel
Paradox — a problem that puzzled mathematicians
for two mille
Pine Script® indicator

MovingAveragesLibrary "MovingAverages"
A collection of O(1) numerically stable moving averages that support anchors and fractional lengths up to 100k bars.
Pine Script has a robust set of moving averages suitable for a majority of cases, making these alternatives useful only if you need anchoring, fractional
Pine Script® library

Clusters Volume Profile [LuxAlgo]The Clusters Volume Profile indicator utilizes K-Means clustering to categorize historical price action into distinct groups and generates individual volume profiles for each detected cluster. This tool provides a unique perspective on volume distribution by isolating price behaviors based on prox
Pine Script® indicator

Central Bank Liquidity Gap IndicatorThis indicator measures the gap between global liquidity growth and stock market growth to identify potential buying opportunities.
Liquidity drives markets. When central banks print money, that liquidity eventually flows into stocks and other assets. If we spot when liquidity growth is outpacing
Pine Script® indicator

Peak Trading Activity Graphs [LuxAlgo]The Peak Trading Activity Graphs displays four graphs that allow traders to see at a glance the times of the highest and lowest volume and volatility for any month, day of the month, day of the week, or hour of the day. By default, it plots the median values of the selected data for each period. T
Pine Script® indicator

Smart Trader, Episode 03, by Ata Sabanci, Candles and TradelinesA volume-based multi-block analysis system designed for educational purposes. This indicator helps traders understand their current market situation through aggregated block analysis, volumetric calculations, trend detection, and an AI-style narrative engine.
━━━━━━━━━━━━━━━━━━━━━━━━━━━━━━━━━━━━━━━
Pine Script® indicator

Asset Drift ModelThis Asset Drift Model is a statistical tool designed to detect whether an asset exhibits a systematic directional tendency in its historical returns. Unlike traditional momentum indicators that react to price movements, this indicator performs a formal hypothesis test to determine if the observed d
Pine Script® indicator

See all indicators and strategies
Community trends
FJET - Trend Shift Confirmed? Bulls Reclaim StructureMomentum doesn’t shift overnight. It fades, compresses, and then flips. And that flip just happened on FJET.⚠️
📊 Technical Breakdown
AMEX:FJET has officially shifted its structure once again.
After weeks of lower highs and bearish pressure, price has now:
• Broken above the falling red trend

Salesforce Is Down Some 50% in 13 Months. Here's Its Chart.Salesforce NYSE:CRM has seen its value nearly cut in half in the past 12 months, with the AI-focused software firm's stock hitting a nearly three-year low this week ahead of earnings. Let's see what CRM's chart and fundamental analysis can tell us.
Salesforce's Fundamental Analysis
Led by bill
IBM stock remains weak below $230It has been a challenging stretch for IBM stock after it posted one of its worst declines in years during yesterday’s session, falling more than 12%. The renewed selling pressure intensified after Anthropic introduced a new tool called “Claude Code,” capable of automating systems written in COBOL, a
NVDA: Last Call For PUTSI will probably get in trouble for this by TV, but hope you all can benefit before it gets taken down.
NVDA is at the top of Wave B and will likely selloff again after earnings. NVDA has sold off 3 of the last 4 earnings and with the 4hr RSI so high going into close, it is likely to selloff after

CRWV: $99 | could be as sexy as Amazon's AWS perhaps the only specialized and focused Cloud Computing and Data Indra provider in the Ai space which is s built around the NVIDIA ecosystem.
thinkiing this could be the next Trillion Company
where the next leg of AI evolution is to be specialist
instead of being a General Service Provider
Stra

MSTR - the current risk/reward deserves attention!!!I’ll be honest, I’m not a big fan of this stock structurally.
But the current risk/reward deserves attention.
Let’s be clear about one thing: MicroStrategy (MSTR) is basically Bitcoin on steroids. If you believe Bitcoin is going to collapse, there’s no reason to read further. This setup only works i

Overly Punished TTD with Huge UpsideThe Trade Desk (TTD) shows mixed signals on fundamental valuation. Its price-to-book ratio (P/B) is about 4.7, which is higher than the market average, suggesting it’s not cheap relative to book value. However, the forward price-to-earnings ratio (P/E) has dropped to ~12.8, indicating earnings growt

Netflix - Heading for new all time highs!🚀Netflix ( NASDAQ:NFLX ) just created its bottom:
🔎Analysis summary:
Netflix clearly remains in an underlying bullish market. And with the recent expected correction of about -50%, Netflix is now back at support. This could turn into a textbook all time high break and retest. We just have to

PYPL - Potential Gap Closure to $52: Analysis / Trade Ideas
I have been monitoring PYPL since his Last earnings, following its decline after a disappointing earnings report and guidance. This created a fair value gap (FVG) in the $48-$52 range, stemming from the inefficiency around the February 5-7 price action.
Recent developments, including rumors of a

NXT: Solar Leader – Breakout & Clean RetestNextracker ( NASDAQ:NXT ) is a highly profitable leader in the solar sector, manufacturing the mechanical trackers that move solar panels to follow the sun.
Technically, the stock is giving us a picture-perfect setup: a clean Breakout followed by a Retest. It pushed through a major resistance level

See all stocks ideas
Feb 25
DOLEDole plc
Actual
0.14
USD
Estimate
0.13
USD
Feb 25
YOUClear Secure, Inc.
Actual
0.31
USD
Estimate
0.30
USD
Feb 25
LOWLowe's Companies, Inc.
Actual
1.98
USD
Estimate
1.94
USD
Feb 25
OCOwens Corning Inc
Actual
1.10
USD
Estimate
1.36
USD
Feb 25
LIVNLivaNova PLC
Actual
0.86
USD
Estimate
0.82
USD
Feb 25
TPHTri Pointe Homes, Inc.
Actual
0.70
USD
Estimate
0.78
USD
Feb 25
LFSTLifeStance Health Group, Inc.
Actual
0.01
USD
Estimate
−0.00
USD
Feb 25
TBLATaboola.com Ltd.
Actual
0.17
USD
Estimate
0.11
USD
See more events
Community trends
Bitcoin Daily CLS - Modle 2Hi friends, new range created. As always we are looking for the manipulation in to the key level around the range. Don't forget confirmation switch from manipulation phase to the distribution phase to make the setup valid. Stay patient and enter only after change in order flow. If price reaches 50%

Bitcoin 20X long with 1,336% profits potential —Time sensitiveWhat one does, the rest follows.
Bitcoin, Crypto, Ethereum, Cardano, XRP, Dogecoin, Binance Coin and the rest of the market are preparing for a major advance. This is confirmed because today we are seeing the establishment, production and confirmation of a higher low.
This is the most astonishing,

Bitcoin - Bounce before a further drop?Bitcoin is currently trading around $64,400 after a sharp rejection from higher levels. The 4-hour structure shows a strong impulsive move downward, followed by a short-term reaction from local support. After breaking through a key bearish imbalance, price is now attempting a corrective bounce. The

HERE IS BITCOIN POSSIBLE BULLISH MOVEMENTHello traders how are you ?
Here's my BITCOIN idea what do you think about it? what's come in your mind about BTC today? And what you think about that share your thoughts on it thank you
Key Points
Bitcoin
📍 Support & Target
🟥 Support Zone: $61,200 - $59,600
🟩 1 TARGET $68,500
🟩 2 TARGET $

BTCUSDT Buyers Defend Support - Corrective Bounce Toward 65KHello traders! Here’s my technical outlook on BTCUSDT (4H) based on the current chart structure. Bitcoin previously traded within a clear consolidation range near the highs, where price moved sideways as buyers and sellers reached temporary balance. This range eventually resolved to the downside, tr

BTCUSDT is correcting before falling Liquidation phase, no bulls in the market, no buyer volume. A pullback is forming, during which Bitcoin may gather liquidity and test resistance before declining.
Downward trend. Areas that may be of interest to MM: 66,450 - 67,250 - 68,200. A false breakout and the formation of a reversal pattern
BITCOIN Alligator Cross historically starting the Bottom ProcessBitcoin (BTCUSD) has formed its first Bearish Cross on the Alligator indicator, with the green trend-line (Lips) crossing below the red trend-line (Teeth). Historically this has always coincided with the start of the Bear Cycle's bottoming process.
Note that this doesn't mean that BTC has hit the b

BTCUSDT: Rebounds From Support Inside Descending Channel To 67KHello everyone, here is my breakdown of the current BTCUSDT setup.
Market Analysis
BTCUSDT has been trading inside a well-defined descending channel, reflecting a broader corrective phase after the previous impulsive move lower. Throughout this structure, sellers maintained control by consistentl

Bitcoin Just Pulled a “Fake Breakdown” | Watch What Happens NextAs I expected in the previous idea , Bitcoin( BINANCE:BTCUSDT ) hit my first target; however, with the start of the new week, it began to decline again. Now, the question is: Can Bitcoin break the heavy support zone ($78,260-$64,850 or not? Stay with me.
Bitcoin is currently moving near the lower a

TRX/USDT: Bullish Trend ContinuationHi!
TRON is showing a very clean structural recovery and is currently trading at $0.2863. After breaking a long-term descending trendline, the price has successfully "engulfed" previous resistance, signaling that the bulls are back in control.
The Setup:
TRX is now trending steadily within an asce

See all crypto ideas
SetupsFX_|XAUUSD(GOLD): Gold is heading towards $6000?Dear traders,
Gold has corrected after reaching a monthly high. It dropped below $5100 and then reversed nicely. Currently, we have trend line liquidity and the price needs to break through before we can expect higher highs. To reach $5500, the price must cross a strong resistance zone. Once it

GOLD - The hunt for liquidity before the trend continues FX:XAUUSD is consolidating near $5,250 after four days of growth. A false breakout of key resistance is forming a correction, but the market structure remains bullish.
The opening of the Chinese and Japanese markets has added liquidity to the market.
Tariff uncertainty: the Trump administratio
Gold Price Analysis – Key Resistance, Support Levels, and PotentThis chart highlights critical resistance and support levels for gold. The Key Resistance Level at 5,298.756 may lead to price rejection or breakout, while Minor Resistance at 5,121.800 could indicate potential pullback or consolidation. The Support Zone at 4,960.901 is crucial for a potential bounc

Gold Remains Bullish as Geopolitical Tensions RiseGold Remains Bullish as Geopolitical Tensions Rise
As reported earlier today by The New York Times:
Iran has refused to accept Trump’s demands regarding its nuclear program and weapons.
Trump said the top US general believed military action against Iran could be easily won.
Once Trump wakes up,

XAU/USD | Explodes to $5250 – OTE Rejection, Next Leg Loading?By analyzing the #Gold chart on the 2-hour timeframe, we can see that price surged aggressively today and reached the $5250 level, driven by the market reaction to Trump’s 15% tariff announcement. The move was impulsive and expansionary, confirming strong bullish momentum during the session.
Howeve
Gold After Sharp Drop: Correction or Reversal Signal?Hello everyone,
In the latest international session, gold experienced a notably sharp decline after reaching a short-term peak. Spot gold fell back to around $5,144/oz, down more than $100 from the prior high near $5,250, while April futures also eased to roughly $5,162. This move stands out, espe

Gold Maintains Bullish Structure Toward 5300 ResistanceHello traders! Here’s my technical outlook on XAUUSD (3H) based on the current chart structure. Gold previously traded inside a rising channel, where price respected dynamic support and resistance while forming a sequence of higher highs and higher lows. This structure reflected steady bullish contr

Silver - This bullrun is officially over!☠️Silver ( OANDA:XAGUSD ) will create a reversal soon:
🔎Analysis summary:
Silver has been rallying more than +500% in the past three years. But looking at higher timeframe structure, all of this was totally expected. With the recent resistance trendline retest though, Silver is officially sta

GOLD Price Update – Clean & Clear ExplanationGold is currently trading within a corrective phase after a strong bullish rally that pushed price toward the 5,230–5,250 resistance zone. Following the sharp rejection from the highs, the market formed a lower high and began consolidating beneath the 5,180 resistance area, signalling weakening bull

GOLD consolidating, in both directions PatternGold is currently consolidating, with price moving in both directions and not yet committing to a clear trend. Investors appear to be waiting for stronger direction as developments unfold.
In the Asian session, gold opened slightly higher, likely due to position adjustments amid ongoing tension bet

See all futures ideas
EURUSD: Holding Above Support, Targeting 1.1840 ResistanceHello everyone, here is my breakdown of the current EURUSD setup.
Market Analysis
EURUSD has been trading within a broader corrective structure after failing to sustain bullish momentum near the previous highs. Following the impulsive upside move, price was rejected from a key Resistance Zone, wh

EURUSDHello Traders! 👋
What are your thoughts on EURUSD?
After the recent bullish rally and rejection from the psychological 1.20 level, EURUSD has entered a corrective phase.
Price has now pulled back to the previously broken descending trendline and the former resistance zone, which is currently acti

EURUSD Short: Testing Critical Support Within Bearish StructureHello traders! Here’s my technical outlook on EURUSD (4H) based on the current market structure. EURUSD is trading within a broader corrective bearish phase after rejecting the pivot high that marked the end of the previous bullish expansion. Following that rejection, price failed to sustain upward

SetupsFX_| AUDNZD: Correction is likely to happen! Dear Traders,
The AUDNZD currency pair is likely to experience a correction as the price has been in a prolonged bullish trend. We have observed significant selling volume in the market which suggests a potential reversal.
Fundamentally, we anticipate a strong New Zealand Dollar (NZD) to overtake

GNPJPY SELLSThese sells i have been planning and waiting for this structure. structure wise, its on a Down trend, respecting the resistance/ emtry candle has not formed and i really dont wanna get in out of London Session, but hey keeping an eye out for a Bearish
Engulfing close to a Doji

EURUSD Daily CLS Model 1Hi friends, new range created. As always we are looking for the manipulation in to the key level around the range. Don't forget confirmation switch from manipulation phase to the distribution phase to make the setup valid. Stay patient and enter only after change in order flow. If price reaches 50%

GBP/USD 2026 Forecast: Market Structure Shift The Road to 1.3400GBP/USD 2026 Forecast: Market Structure Shift The Road to 1.3400
The British Pound is currently at a critical inflection point against the US Dollar. Following a period of volatility driven by recent US Supreme Court decisions regarding global tariffs, the greenback has seen a resurgence that is pr

25.02.26 Daily ForecastPairs on Watch -
FX:GBPJPY : A simple 123 move and now waiting for the last leg to complete at the base. This will be a three touch structure if it does, meaning so development is needed after. 1H risk entry long with the JP225 breaking all time highs again, we could see more upside movement on

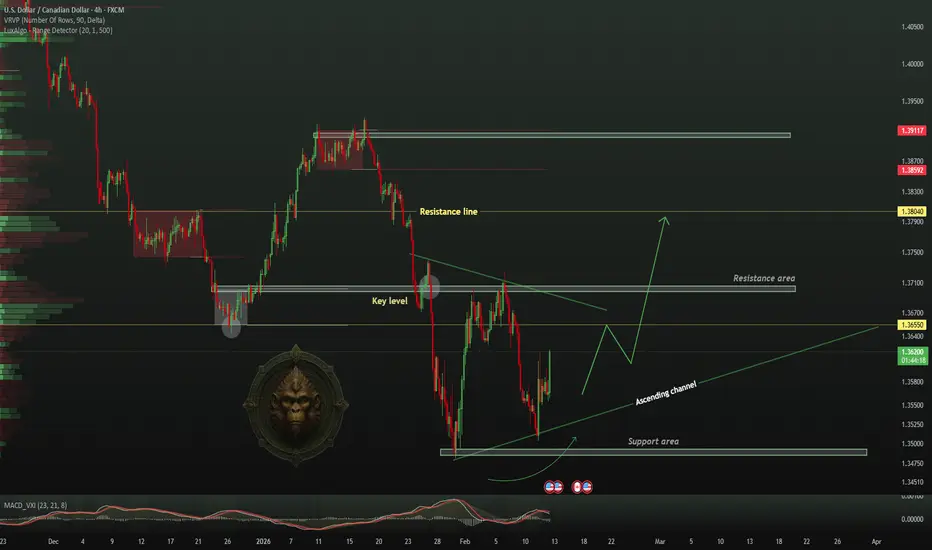
TheGrove | USDCAD Buy | Idea Trading AnalysisUSDCAD is falling towards a support level which is a pullback support and could bounce from this level to our take profit.
We expect a decline in the channel after testing the current level which suggests that the price will continue to rise
Hello Traders, here is the full analysis.
I think we can
SHORT ON GBP/JPYGJ has retraced to a significant FVG to the downside after rising during its pullback phase.
GJ from a daily timeframe has changed structure from UP to DOWN and the pullback is now over (in my opinion).
The JPY index is also at a major Demand Level after completing its pullback to the downside.

See all forex ideas
Trade directly on Supercharts through our supported, fully-verified, and user-reviewed brokers.


