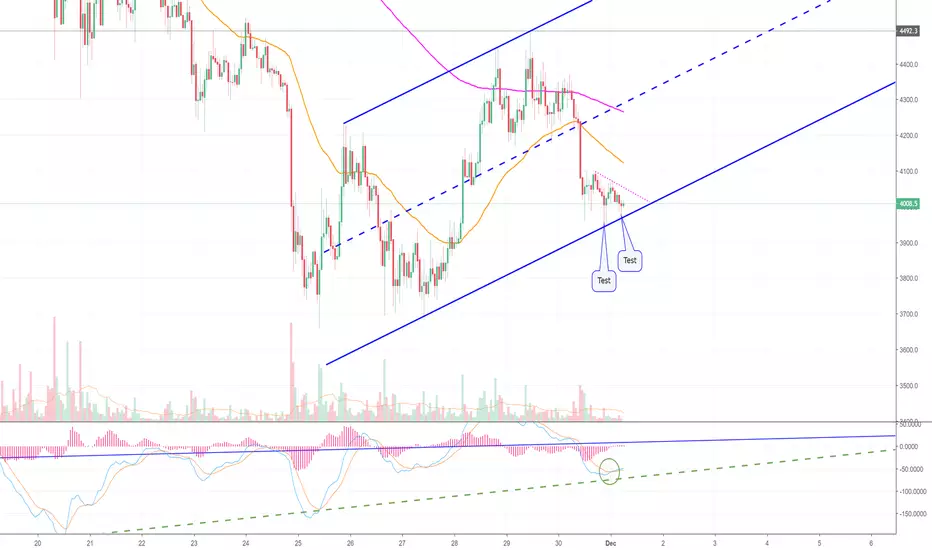
Hi friends! Welcome to this update analysis on Bitcoin! Let's get right to it. Looking at the hourly chart, you can see that BTC is in a clear uptrend channel (in blue.) Currently, price is testing the bottom of the channel. Price has touched it twice today, and both times the channel has held. So far, it appears to be supportive. For educational purposes, you could use this as a trading setup, particularly if price were to pop above the pink falling dotted trendline. However, it is a risky trade, because there is a lot of falling overhead resistance. Regardless, you could go long at a close above the pink dotted trendline, looking for a retest of the top of the channel, which could be up near $4700. That would be a 15% increase.
On the other hand, if we break below the blue uptrend channel right here, it will pretty much seal the deal for $3000. That doesn't mean that $3000 would come immediately. We could chop around here for a while before heading lower. Regardless, the point is that we have another imminent breaking point on the chart, that we can monitor to determine the forward path of the market. Breaking above the pink trendline sends us on a risky uphill climb through resistance, toward the top of the channel. Breaking below the channel, eventually sends us to $3000, which would be a $25% loss from current levels. Obviously, the easier trade is to the downside, so I'm more interested in a breakdown from the uptrend channel, than a sketchy long trade through falling resistance. As I've said before, I don't really care to go long until we see a confirmation above the 50 EMA on the daily chart, a capitulation selloff with a subsequent recovery on high volume, or powerful bullish reversal signal. Until either of those conditions develop, it's best to remember that this is a bear market in a powerful downtrend. Selling the rallies is recommended.
I'm the master of the charts, the professor, the legend, the king, and I go by the name of Magic! Au revoir.
***This information is not a recommendation to buy or sell. It is to be used for educational purposes only.***
-JD-
Disclaimer
The information and publications are not meant to be, and do not constitute, financial, investment, trading, or other types of advice or recommendations supplied or endorsed by TradingView. Read more in the Terms of Use.
Disclaimer
The information and publications are not meant to be, and do not constitute, financial, investment, trading, or other types of advice or recommendations supplied or endorsed by TradingView. Read more in the Terms of Use.