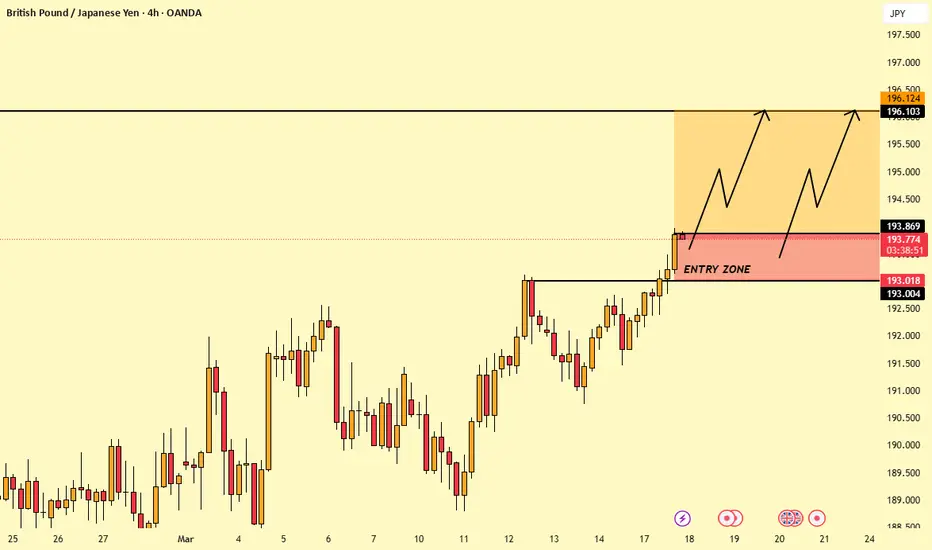
GBP/JPY (British Pound / Japanese Yen) on a 4-hour timeframe.
Chart Details:
• Current Price: 193.768
• Sell Price: 193.640
• Buy Price: 193.896
• Trend: The price is in an uptrend and has reached the marked “Entry Zone”, indicating a potential buy opportunity.
Possible Price Movement:
• The Entry Zone is highlighted as a potential buy area, meaning the price could bounce upward from this level.
• Key resistance levels (targets for take profit):
• 195.500
• 196.103
• 196.124 - 196.500 (major resistance zone)
• The chart shows a zig-zag bullish pattern, suggesting that the price may experience minor pullbacks before continuing upward.
Analysis:
• If the price holds above the “Entry Zone,” it could be a buy opportunity.
• Take Profit (TP) levels: 195.500, 196.103, and 196.500
• If the price breaks below the zone, a bearish movement could occur.
This chart suggests a bullish setup for GBP/JPY, but confirmation through price action is necessary before entering a trade.
Trade active
Active Trade 194 pips running,Join us for daily updates and grow your trading skills! t.me/+k4cGIo3p1sY0ZGQ0
Disclaimer
The information and publications are not meant to be, and do not constitute, financial, investment, trading, or other types of advice or recommendations supplied or endorsed by TradingView. Read more in the Terms of Use.
Join us for daily updates and grow your trading skills! t.me/+k4cGIo3p1sY0ZGQ0
Disclaimer
The information and publications are not meant to be, and do not constitute, financial, investment, trading, or other types of advice or recommendations supplied or endorsed by TradingView. Read more in the Terms of Use.