Hello traders 🐺 .
this is update for my last idea about the SAND , and in this idea I want to talk about the possible price targets for the SAND .
1_pattern :

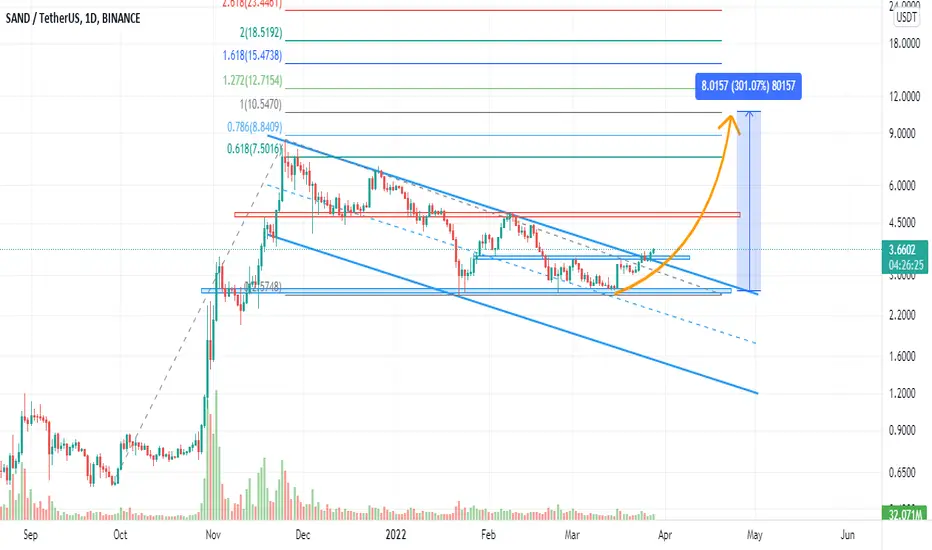
in the chart above you can see a very clear flag pattern , and as you know the flag pattern is the trend continuation pattern which means that they intend to break in the favor of the trend , in this case the overall trend is bullish so the next move could be a bullish move and the chance of it is higher than 60% .
2_EMA Ribbon :

in the daily chart we can see that the EMA Ribbon is flipping bullish and this is a very good sign for the SAND , also we can see that the price is breaking above the channel , and in my opinion after the retest of the channel and EMA Ribbon we could expect a bullish impulse for the SAND .
3_TSI and RSI :

in the RSI value we had a bullish divergence and this move is because of that divergence that we had on the RSI value .
in the other side we can see that the TSI is breaking above the zero line and we could expect this as a bullish signal .
conclusion : with above information I can say that the SAND is breaking above the flag pattern and after the retest of the channel and the EMA Ribbon we could expect a nice bullish impulse for SAND , and also TSI and RSI is also bullish so the overall view of the SAND is bullish .
price targets :

I like to use measure the price targets by using the Fibonacci tools , so as you can see in the chart above , the possible price target for the SAND is around 1.0 Fibonacci level because other name of the FLAG pattern is AB=CD pattern so the technical target is around 1.0 Fibonacci level , however we must consider the other levels of the resistance for the SAND for example the first supply area is at 0.618 .
but don't forget that this is not a Financial advice and always trade based on your trading strategy ; have nice day my dear friends .
this is update for my last idea about the SAND , and in this idea I want to talk about the possible price targets for the SAND .
1_pattern :
in the chart above you can see a very clear flag pattern , and as you know the flag pattern is the trend continuation pattern which means that they intend to break in the favor of the trend , in this case the overall trend is bullish so the next move could be a bullish move and the chance of it is higher than 60% .
2_EMA Ribbon :
in the daily chart we can see that the EMA Ribbon is flipping bullish and this is a very good sign for the SAND , also we can see that the price is breaking above the channel , and in my opinion after the retest of the channel and EMA Ribbon we could expect a bullish impulse for the SAND .
3_TSI and RSI :
in the RSI value we had a bullish divergence and this move is because of that divergence that we had on the RSI value .
in the other side we can see that the TSI is breaking above the zero line and we could expect this as a bullish signal .
conclusion : with above information I can say that the SAND is breaking above the flag pattern and after the retest of the channel and the EMA Ribbon we could expect a nice bullish impulse for SAND , and also TSI and RSI is also bullish so the overall view of the SAND is bullish .
price targets :
I like to use measure the price targets by using the Fibonacci tools , so as you can see in the chart above , the possible price target for the SAND is around 1.0 Fibonacci level because other name of the FLAG pattern is AB=CD pattern so the technical target is around 1.0 Fibonacci level , however we must consider the other levels of the resistance for the SAND for example the first supply area is at 0.618 .
but don't forget that this is not a Financial advice and always trade based on your trading strategy ; have nice day my dear friends .
_____________________________________
🐺 Discipline is rarely enjoyable ,
But almost always profitable 🐺
TElEGRAM CHANNEL : t.me/KIU_COIN
_____________________________________
🐺 Discipline is rarely enjoyable ,
But almost always profitable 🐺
TElEGRAM CHANNEL : t.me/KIU_COIN
_____________________________________
Related publications
Disclaimer
The information and publications are not meant to be, and do not constitute, financial, investment, trading, or other types of advice or recommendations supplied or endorsed by TradingView. Read more in the Terms of Use.
_____________________________________
🐺 Discipline is rarely enjoyable ,
But almost always profitable 🐺
TElEGRAM CHANNEL : t.me/KIU_COIN
_____________________________________
🐺 Discipline is rarely enjoyable ,
But almost always profitable 🐺
TElEGRAM CHANNEL : t.me/KIU_COIN
_____________________________________
Related publications
Disclaimer
The information and publications are not meant to be, and do not constitute, financial, investment, trading, or other types of advice or recommendations supplied or endorsed by TradingView. Read more in the Terms of Use.