1. Technical Analysis Breakdown:
Daily Chart:
• Trend: Bullish overall, but showing signs of pullback.
• MACD: Bearish, indicating weakening momentum.
• RSI: At 45.23 — neutral but leaning toward oversold territory.
• Support level: Around 41,500.
• Resistance level: Recent high near 42,890.
15-Min Chart:
• Trend: Strong intraday upward momentum.
• MACD: Bullish crossover with momentum building.
• RSI: 69.09 — nearing overbought but still has room.
• Support: Around 41,760.
• Resistance: 42,208 (current price), next major level at 42,500.
3-Min Chart:
• Trend: Short-term bullish with a slight consolidation.
• MACD: Flat, showing a pause but no reversal yet.
• RSI: 53.19 — mid-range, suggesting more upside potential.
⸻
2. Fundamental Analysis:
• US economy shows resilience (strong job data, improved GDP).
• Fed’s stance on rates remains balanced, leaning dovish, supporting equities.
• Geopolitical tensions slightly cooling, risk appetite growing.
⸻
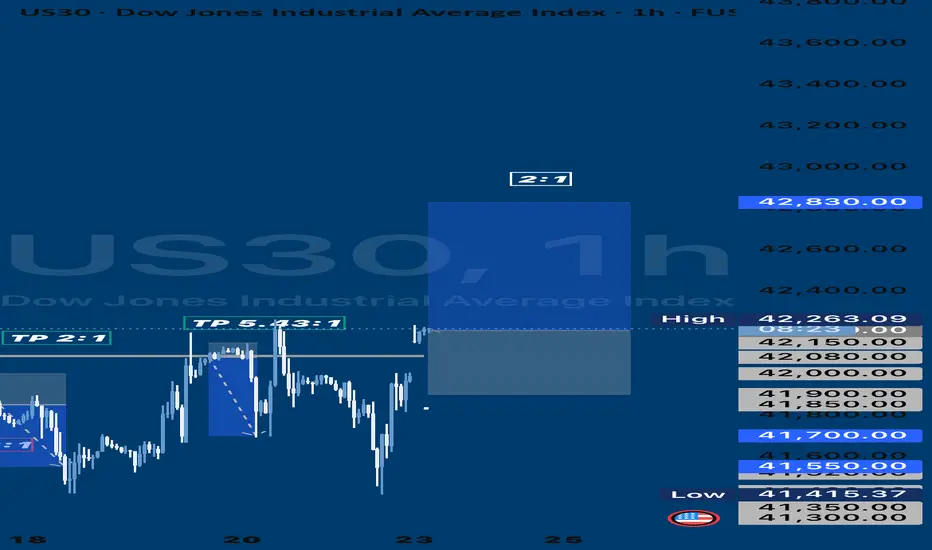
3. Trade Plan — Long Position (Buy)
• Entry: 42,210 (after a clean break above consolidation).
• Stop Loss (SL): 41,900 (below recent intraday support).
• Take Profit (TP): 42,830 (previous daily high). US30
US30
Daily Chart:
• Trend: Bullish overall, but showing signs of pullback.
• MACD: Bearish, indicating weakening momentum.
• RSI: At 45.23 — neutral but leaning toward oversold territory.
• Support level: Around 41,500.
• Resistance level: Recent high near 42,890.
15-Min Chart:
• Trend: Strong intraday upward momentum.
• MACD: Bullish crossover with momentum building.
• RSI: 69.09 — nearing overbought but still has room.
• Support: Around 41,760.
• Resistance: 42,208 (current price), next major level at 42,500.
3-Min Chart:
• Trend: Short-term bullish with a slight consolidation.
• MACD: Flat, showing a pause but no reversal yet.
• RSI: 53.19 — mid-range, suggesting more upside potential.
⸻
2. Fundamental Analysis:
• US economy shows resilience (strong job data, improved GDP).
• Fed’s stance on rates remains balanced, leaning dovish, supporting equities.
• Geopolitical tensions slightly cooling, risk appetite growing.
⸻
3. Trade Plan — Long Position (Buy)
• Entry: 42,210 (after a clean break above consolidation).
• Stop Loss (SL): 41,900 (below recent intraday support).
• Take Profit (TP): 42,830 (previous daily high).
Note
I MOVE SL TO BE @ 1:1 ON ALL MY POSITIONSTrade closed: target reached
Disclaimer
The information and publications are not meant to be, and do not constitute, financial, investment, trading, or other types of advice or recommendations supplied or endorsed by TradingView. Read more in the Terms of Use.
Disclaimer
The information and publications are not meant to be, and do not constitute, financial, investment, trading, or other types of advice or recommendations supplied or endorsed by TradingView. Read more in the Terms of Use.