Bitcoin - More blood coming! Buy 57k (extremely strong support)Bitcoin is currently in a very sharp decline, because the price dropped in the past 4 months by 53%. A lot of people didn't expect such high volatility because they are even new to the market, or they thought that ETF would reduce the overall volatility of this market. The truth is that the market is still extremely volatile, and all ETF investors may be at a massive loss on their account later in 2026, when the price drops to the all-time low of these ETFs. What is my prediction in the short term, and why will Bitcoin probably continue to go down in the next days / weeks ?
I see 2 main issues with the current price of Bitcoin. The first is that Bitcoin still didn't hit the 0.618 Fibonacci retracement of the previous bull market (2022 - 2025) - this fibo sits at 57,772 USDT. That's the first magnet. The second issue is that Bitcoin still didn't hit the parallel channel's trendline (blue descending channel on the chart). Before any pumps, I would like to see at least 1 of these 2 conditions met, so either hit the trendline or hit the 0.618 fibo.
From the Elliott Wave perspective, these are corrective types of waves, even though they are very sharp. I am still missing the last (Y) wave of the complex corrective wave (W)(X)(Y). I would also like to see a bearish divergence on the RSI indicator. The RSI indicator is oversold, but there is still no divergence, so that's another issue with what I see on the current price of Bitcoin. I am bearish, and I think Bitcoin will hit 57k in the short term. The banks and huge institutions want liquidity as much as possible before a new all-time high, so they want to take all your stop losses.
Write a comment with your altcoin + hit the like button, and I will make an analysis for you in response. Trading is not hard if you have a good coach! I am very transparent with my trades. Thank you, and I wish you successful trades!
Community ideas

Gold Price Analysis – Key Support and Resistance LevelsThis chart outlines the key support and resistance levels for gold prices. The Key Resistance Level at 5,431.175 is a potential rejection zone, where price may face resistance. The Support Zone at 5,040.060 is being tested, and if price holds, a bounce or reversal is expected. The Critical Support at 4,949.972 is a key level for a potential bullish reversal. The Extreme Support at 4,497.334 represents a significant reversal area where price is likely to find strong support. Traders should monitor these levels for price action to confirm potential movements

Gold Isn’t Rushing Lower – What Is the Money Flow Telling Us?If we view the gold market as a flowing stream, XAUUSD is moving upward in a controlled and orderly manner —not aggressively, but with clear conviction. After the prior sharp shakeout, gold did not collapse ; instead, it quickly regained balance , signaling that underlying buying pressure remains intact and has not stepped aside.
Over yesterday and today, the news backdrop has continued to support precious metals . A cooling U.S. dollar and a shift back toward a defensive mindset have reinforced gold’s role as a natural safe haven. More importantly, no headline strong enough has emerged to force capital out of gold , allowing the primary trend to remain firmly in place.
From a technical standpoint, the recent pullbacks in XAUUSD are necessary pauses within a larger uptrend . Price has been consistently supported by the ascending trendline and the Ichimoku cloud , showing that buyers are ready to step in whenever the market cools . This behavior is building a progressively higher price base , rather than the kind of distribution typically seen near major tops.
As long as price holds above the 4,820 area, the most logical scenario remains continued upside. The upside objective around 5,400 is not an emotional projection , but a logical destination if the current structure remains unbroken. At this stage, following the trend and patiently buying pullbacks is a far safer and more effective approach than attempting to catch a top in a strong market.

XAUUSD: Liquidity Grab Below Support, Expansion Ahead To $5,110Hello everyone, here is my breakdown of the current XAUUSD setup.
Market Analysis
Gold has been trading within a well-defined bullish environment, previously respecting a clean ascending channel, where price consistently formed higher highs and higher lows. This structure reflected strong buyer dominance and healthy trend continuation rather than impulsive exhaustion. During this phase, XAUUSD also went through a consolidation range, signaling accumulation before the next impulsive move. The breakout from the range triggered a strong bullish impulse, pushing price aggressively toward the 5,110 Resistance Zone, where sellers became active. This area acted as a major supply zone, leading to a sharp rejection and a deep corrective move. Price dropped impulsively, breaking below the rising channel and testing lower liquidity, which marked a short-term shift in market structure.
Currently, XAUUSD is stabilizing above the reclaimed support zone, with multiple breakout attempts confirming acceptance above demand. This price behavior indicates that buyers are gradually regaining control, while sellers are unable to push price back below key support.
My Scenario & Strategy
My primary scenario favors a bullish continuation, as long as XAUUSD holds above the 4,970 Support Zone and continues to respect the rising triangle support line. The recent reclaim and consolidation above support suggest that the prior drop was a fake breakdown, not the start of a sustained bearish trend. From a structural perspective, pullbacks toward the support zone are considered corrective, offering potential continuation opportunities rather than reversal signals. The next key upside objective lies at the 5,110 Resistance / Supply Zone (TP1), which aligns with previous supply and remains the main barrier for further upside. A clean breakout and acceptance above the 5,110 resistance would confirm bullish continuation and open the door for a renewed expansion toward higher levels.
However, a decisive breakdown and acceptance below the support zone and triangle support line would invalidate the bullish scenario and signal a return of bearish pressure. For now, structure favors buyers, with Gold holding above key demand and building strength for the next directional move.
That’s the setup I’m tracking. Thank you for your attention, and always manage your risk.

Elise | XAUUSD · 30M – Bullish Continuation from Channel SupportOANDA:XAUUSD
Gold sold off aggressively, sweeping liquidity before reversing strongly from demand. The recovery leg was clean and impulsive, followed by controlled consolidation inside a bullish channel. Current price is holding above key support, suggesting buyers remain in control. As long as price holds this base, continuation toward the upper resistance zone remains the higher-probability move.
Key Scenarios
✅ Bullish Case 🚀 →
🎯 Target 1: 5,080 – 5,120
🎯 Target 2: 5,230 – 5,260
❌ Bearish Case 📉 →
A sustained breakdown below 4,980 – 4,950 would weaken the bullish structure and open room for deeper correction.
Current Levels to Watch
Resistance 🔴: 5,080 – 5,120 / 5,230 – 5,260
Support 🟢: 4,980 – 4,950
⚠️ Disclaimer: This analysis is for educational and informational purposes only. It is not financial advice. Please conduct your own research before trading.

GOLD Price Update – Clean & Clear ExplanationGold is a strong bullish structure after forming a clear higher high–higher low sequence. Price has respected multiple demand zones, confirming sustained buying interest after the earlier in the session.
The recent breakout above the 5,040–5,050 resistance zone signals strength. Price is now pulling back slightly, indicating a healthy retracement rather than weakness. This pullback into the marked demand zone suggests a potential continuation move.
Bullish Scenario:
If price holds above the demand area and shows confirmation, upside targets lie near 5,110–5,150, where prior supply and liquidity reside.
Bearish Risk:
A breakdown below 4,970–4,950 would invalidate the bullish bias and may lead to a deeper correction toward lower demand zones.
“If you come across this post, please like, comment, and share. Thanks!”

XAU/USD | Gold At a Critical Short-Term Decision Zone!By analyzing the #Gold chart on the 30-minute timeframe, we can see that right after our last analysis, gold moved higher again and delivered more than 1,500 pips of profit, pushing price up to $5,047. Gold is now trading around $5,012.
If price fails to hold above $5,050 within the next 4 hours, we can expect a deeper pullback. The downside targets for this correction are $4,999, $4,990, and $4,960. On the other hand, if gold manages to stabilize above $5,050 within the next 4 hours, we can expect further upside in the short term, with targets above $5,080.
Please support me with your likes and comments to motivate me to share more analysis with you and share your opinion about the possible trend of this chart with me !
Best Regards , Arman Shaban


GOLD - Consolidation before the rally. Focus on 5090FX:XAUUSD is storming 5089 as part of a bullish trend. There is a high probability of a breakthrough, but before that, the market may form a correction. Tomorrow is NFP...
The dollar is falling, and against this backdrop, gold looks like a strong asset in terms of buyer interest.
The projected slowdown in retail sales and weak NFP expectations are supporting expectations of a Fed rate cut. The dollar is under pressure due to rumors of Chinese banks diversifying away from US Treasury bonds. Overall, this supports the bullish trend for the metal.
Core Retail Sales, NFP (a key indicator for the Fed), and CPI will determine the inflation trend and the Fed's future policy
Technically, gold is in a bullish trend, but before rising, it may test the following support levels: 4985, 4902 (sharp long squeeze).
Resistance levels: 5089, 5100, 5250
Support levels: 4985, 4902, 4812
The market continues to approach resistance at 5089, a break of which could trigger a rally to 5250-5400. However, it is possible that a correction could form before the news before growth. Focus on key levels
Best regards, R. Linda!

Silver: Support Holds, but the Trend Still Points LowerHello everyone, looking at silver on the H4 timeframe, the overall picture remains quite clear: the dominant trend is still bearish, and there are no signs yet that this structure has been decisively broken.
From a technical perspective, price is still trading below both the fast EMA and the medium-term EMA, with both averages continuing to slope downward. This indicates that selling pressure remains in control. The sharp drop in early February generated strong downside momentum, accompanied by a clear surge in volume, reflecting active participation from larger players. The recent bounce mainly stems from oversold conditions, but the rebound has been limited in scope and not strong enough to alter the broader trend structure. From my experience, when silver rebounds but fails to reclaim the EMA zone above, it is usually just a pullback within a downtrend rather than an early reversal signal.
On the macro and news side, silver’s recent volatility is not random. Based on information flows from Forex Factory and other mainstream financial sources, expectations around Fed monetary policy continue to exert significant pressure. Elevated US interest rates increase the opportunity cost of holding non-yielding metals like silver. At the same time, short-term risk-off sentiment across global financial markets has encouraged capital to move away from more volatile assets. Compared to gold, silver is also more sensitive to industrial demand, so when global growth prospects come into question, silver often reacts more sharply and more quickly.
These factors help explain why the recent decline in silver has been stronger and more abrupt than gold’s. What about you? Are you expecting silver to hold support and form a base, or are you still preparing for a deeper correction ahead?

Gold at Key Resistance — Is This the End of the Correction?Gold( OANDA:XAUUSD ) is currently moving near its resistance zone($5,191-$5,097).
From an Elliott Wave perspective, it appears Gold is completing the microwave 5 of the main wave C, with the corrective upward structure likely a Zigzag correction (ABC/5-3-5).
Also, we can see a negative Regular Divergence(RD-) between two consecutive peaks.
I expect that upon entering the resistance zone($5,191-$5,097), gold will likely resume its decline and reach at least the targets I’ve identified on the chart.
First Target: $4,953
Second Target: $4,827
Third Target: $4,703
Stop Loss(SL): $5,221
Points may shift as the market evolves
What’s your view on gold’s trend this week? I’d be happy if you share your thoughts in the comments!
💡 Please respect each other's opinions and express agreement or disagreement politely.
📌 Gold Analyze (XAUUSD), 1-hour time frame.
🛑 Always set a Stop Loss(SL) for every position you open.
✅ This is just my idea; I’d love to see your thoughts too!
🔥 If you find it helpful, please BOOST this post and share it with your friends.

Gold 30Min Engaged ( Bullish Reversal Entry Detected )⚡Base : Hanzo Trading Alpha Algorithm
The algorithm calculates volatility displacement vs liquidity recovery, identifying where probability meets imbalance.
It trades only where precision, volume, and manipulation intersect —only logic.
Technical Reasons
/ Direction — LONG / Reversal 4917 Area
/ Direction — LONG / Reversal 4863 Area
☄️Bullish momentum confirmed through strong candle body.
☄️Structure shifted with higher-low near key demand base.
☄️Volume expanding confirms order-flow alignment upward.
☄️Buyers reclaimed imbalance with sustained clean break.
☄️Algorithm detects rising momentum under low liquidity.
⚙️ Hanzo Alpha Trading Protocol
The Alpha Candle defines the day’s real control zone — the first battle of momentum.
From this origin, the Volume Window reveals where the next precision strike begins.
⚙️ Hanzo Volume Window / Map
Window tracked from 10:30 — mapping true market behavior.
POC alignment exposes institutional bias and breakout potential zones.
⚙️ Hanzo Delta Window / Pulse
Delta window monitors real buying vs. selling power behind each move.
Tracks volume aggression to expose who controls the candle — buyers or sellers.
When Delta aligns with Volume Map, momentum becomes undeniable.

EURUSD Buyers in Control After Corrective Move, Eyes on 1.1930Hello traders! Here’s my technical outlook on EURUSD (1H) based on the current chart structure. EURUSD previously traded within a strong bullish environment, supported by a well-defined rising trend line. During this phase, price consistently formed higher highs and higher lows, confirming sustained buyer control and healthy upside momentum. This bullish impulse led to a breakout above the key Buyer Zone around 1.1810, which acted as a strong demand area and structural support. After the impulsive move, price reached the Seller Zone / Resistance Level near 1.1930, where selling pressure stepped in. This resulted in a corrective pullback, with price respecting a descending resistance line, indicating a controlled correction rather than a full trend reversal. Importantly, the pullback found support back at the previous Buyer Zone, which has now been tested multiple times and shows clear acceptance as support. Currently, EURUSD is consolidating inside a tight range above the Buyer Zone, while also respecting the rising trend line from below. This compression between horizontal demand and dynamic support suggests that the market is building energy for the next directional move. The recent breakout attempt from the range indicates early bullish intent, while the structure still favors higher continuation as long as support holds. My primary scenario favors a bullish continuation as long as EURUSD remains above the 1.1810 Buyer Zone and continues to respect the rising trend line. The current consolidation appears to be a corrective pause within a broader bullish structure rather than distribution. A successful hold above support could lead to a gradual push higher, with the 1.1930 Resistance / Seller Zone acting as the first upside target (TP1). A clean breakout and acceptance above this resistance would confirm trend continuation and open the door for further upside expansion. However, a strong rejection from the Seller Zone could trigger another pullback toward demand. A decisive breakdown and acceptance below the Buyer Zone and trend line would invalidate the bullish scenario and signal a deeper corrective phase or potential range expansion to the downside. For now, market structure favors buyers, with demand holding firm and price compressing below resistance — a classic setup for a potential continuation move. Please share this idea with your friends and click Boost 🚀

BTCUSDT Compression Below Resistance Signals Expansion To 71,800Hello traders! Here’s my technical outlook on BTCUSDT (4H) based on the current chart structure. Bitcoin previously traded within a well-defined range, where price respected both the upper and lower boundaries for an extended period. This consolidation phase reflected balance between buyers and sellers, with multiple reactions from range highs and lows. Eventually, price broke down from the range, signaling a loss of bullish control and the start of a corrective bearish phase. Following the range breakdown, BTC entered a descending channel, characterized by lower highs and lower lows. Price respected the falling resistance line, confirming sustained selling pressure and controlled downside continuation rather than a volatile sell-off. During this move, several corrective bounces were capped by the descending resistance, reinforcing the bearish structure. Currently, BTCUSDT is consolidating above the Buyer Zone, while also attempting to break and hold above a newly formed ascending support line. This behavior suggests that selling pressure is weakening and buyers are gradually gaining control. The recent breakout attempts from minor resistance indicate early bullish intent, although price is still capped below the key Seller Zone / Resistance near 71,800. My primary scenario favors a move higher toward the 71,800 resistance level (TP1), which aligns with the Seller Zone and previous breakdown area. A clean breakout and acceptance above this resistance would confirm a deeper recovery and potentially signal a trend shift. However, a strong rejection from the Seller Zone could lead to another pullback toward the Buyer Zone. A decisive breakdown below the 68,000 support and loss of the ascending support line would invalidate the bullish recovery scenario and open the door for renewed downside continuation. For now, BTCUSDT shows signs of stabilization after a strong drop, with buyers defending demand and price compressing below resistance — a classic setup for a potential breakout move. Please share this idea with your friends and click Boost 🚀

GOLD - Consolidation above 5000. Awaiting NFP...CAPITALCOM:GOLD consolidates above $5,000 in anticipation of key data from the US. Economic data may set the medium-term tone for the market. A long squeeze before the move cannot be ruled out...
Central banks continue to buy metal, expectations of a more dovish Fed policy weaken the dollar. Easing tensions in the Middle East and growing risk appetite in global markets support the gold trend.
Ahead of us are the Employment Report (NFP) on Wednesday and
Inflation Data (CPI) on Friday .
These data will determine further expectations for Fed rates and the direction of the dollar.
Gold is in a state of equilibrium ahead of the release of critical data. A sustained breakout from the current range ($5000-5100) is likely only after the release of US employment and inflation reports, which will clarify the trajectory of the Fed's monetary policy.
Resistance levels: 5047, 5098, 5100
Support levels: 4946, 4902, 4811
The zone of interest and liquidity within the current movement is the 4950-4940 area. There is a possibility that during the transition from the European to the US session, the market will test this area before growing. However, a premature breakout of 5047 and a close above 5050 could trigger a rally to 5150-5250.
Best regards, R. Linda!

THE KOG REPORT - UpdateEnd of day update from us here at KOG:
RED BOXES:
BREAK ABOVE 4970 for 4989✅, 4999✅, 5002✅, 5010✅ and 5016✅ in extension of the move
BREAK BELOW 4950 for 4038, 4933, 4920 and 4006 in extension of the move
We had another bullish open which was expected, but unfortunately, we didn't get that lower bounce we wanted to go long. Instead, we got the move we wanted into the defence region completing the red box targets and then giving us a RIP for a short trade.
Apart from that, we managed some long scalps on the indi's in Camelot, but a slow day on the markets.
We're still playing that 5020 pivotal region as mentioned in yesterdays report, and this 4H candle looks like it's going to break above the defence region. Support at the 5035-40 level can lead price to complete the move upside into the 5080's so lets see how we close.
As always, trade safe.
KOG

XRPUSDT - Hunting for liquidity before the fallBINANCE:XRPUSDT looks very weak, losing 69% from its high. As part of the downtrend, the coin may experience sharp local spikes in search of liquidity before falling.
Bitcoin is consolidating below 70K without the ability to break through the key level. The market is stagnating after a sharp decline, which may continue.
After the pullback phase, an intermediate consolidation has formed with a liquidity zone of 1.4625 - 1.4886. Within the downtrend, the market may form a short squeeze in the specified zone, followed by a decline to 1.2845.
The market has confirmed two key levels, 1.4625 and 1.3850, with support tested and a weak reaction. If the market begins to contract towards support, this will only increase the chances of a further decline.
Resistance levels: 1.4625, 1.4885, 1.5300
Support levels: 1.412, 1.385, 1.2845
I do not rule out the possibility of an attempt to break the downward structure and grow, but in the current conditions, any bullish momentum can be quickly sold off. Technically, I have identified an area of interest between 1.4625 and 1.4885. There may be a false breakout, a retest of 1.3850, and a further decline
Best regards, R. Linda!

Bitcoin Price Update – Clean & Clear ExplanationBitcoin remains under strong bearish pressure on the 2-hour timeframe. After forming a lower high near the 72,000 / 73,000 supply zone, price failed to sustain upside momentum and continues to trade below the key resistance structure.
The market is currently moving inside a rising corrective channel, which appears to be a bearish continuation pattern rather than a trend reversal. Price is struggling to hold above the 69,000–70,000 region, showing clear signs of seller dominance at higher levels.
If Bitcoin fails to break and hold above the upper trendline of the rising channel, a sharp bearish rejection is likely. A breakdown below current support would confirm continuation toward the marked downside targets.
Bitcoin remains in a sell-on-rallies environment. As long as price stays below key resistance zones, the probability favors further downside continuation toward the 64K and 60K levels.
“If you come across this post, please like, comment, and share. Thanks!”

Gold Looks Chaotic – But the Structure Is Crystal ClearRecently, the gold market has appeared rather chaotic. The upside momentum no longer looks smooth, price has been fluctuating aggressively, and many traders have begun to ask themselves: Is this the top, or just the beginning of a much larger trend?
However, when I take a step back and look at the entire structure, the story becomes remarkably simple.
Everything started with a break above a key resistance level, where price accelerated sharply and formed a clear ascending flag. This was not a random rally, but a momentum-driven expansion, clearly showing initiative from the buyers.
So what happened next?
Price did not reverse. Instead, it simply corrected within a controlled descending channel. Lower highs, lower lows, with every move respecting the trendlines. This is exactly how a healthy market cools down after a strong expansion. No panic. No collapse. Just a correction.
After that, price moved into a consolidation phase. And this is where most traders start to lose their bearings. The chart looks “boring,” nothing seems to happen, candles get smaller, and volatility contracts. Many mistake this simple pause for a full trend reversal.
But the market always follows a very familiar logic:
Compression → Expansion.
And as expected, price broke out of the consolidation zone. This breakout was not just another push higher; it was confirmation of trend continuation. Momentum returned precisely at the moment when most traders had already begun to doubt the trend.
✨ Here’s the most interesting part
After the breakout, price did not surge higher in a disorderly way. Instead, the market formed another flag pattern—smaller in size. A very clean mini flag.
And this is the key point to understand:
This small flag is not reversal pressure.
It is simply a tactical pause, where the market reloads energy before the next expansion.
The structure continues to follow the same logic:
- Clear bullish impulse
- Controlled corrective pullback
- Volatility compression
- Preparation for the next expansion phase
What many traders label as “noise” is, in reality, the market repeating the same behavior on a smaller scale.
Correction within a correction.
Fractal structure.
Order, not chaos.
🔁 A familiar scenario repeating itself
This is exactly where most traders get misled. They zoom in too much, see small candles chopping around, and conclude that the trend is over. But when I look at the broader structure, everything is crystal clear:
- A larger bullish flag
- Inside it, a smaller bullish flag
- A minor pullback holding just above the breakout zone
This is textbook behavior of a healthy uptrend:
momentum → correction → momentum.
What we currently have is:
Impulse → Flag → Impulse → Flag
Historically, this structure only ends when the final flag breaks in the opposite direction.
And for now, that has not happened.
🎯 My expectation
Given what we are seeing, I expect another breakout to form from the current area, continuing the existing uptrend. At the very least, the market still has room for another clear bullish leg before we need to reassess the bigger picture.
There is no need to overcomplicate it.
When you understand structure, the market speaks very clearly.

EURUSDHello Traders! 👋
What are your thoughts on EURUSD?
After retesting the previously broken zone, EUR/USD has resumed its bullish move. This area has successfully acted as a strong support following the breakout.
As long as price holds above this support zone, we expect the bullish momentum to continue and price to rise at least toward the highlighted target levels. The overall market structure remains bullish, and the recent pullback can be considered a healthy correction within the dominant uptrend.
Don’t forget to like and share your thoughts in the comments! ❤️

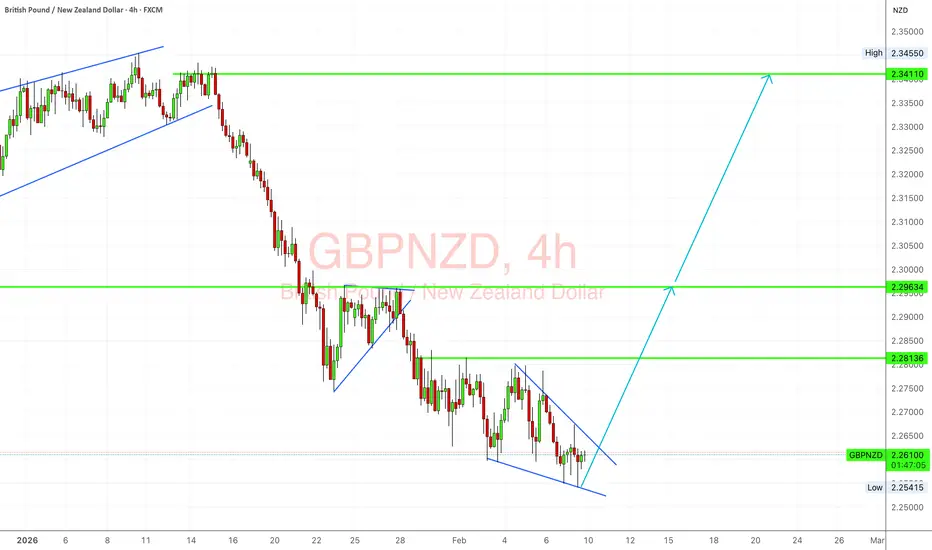
GBPNZD Testing Deep Support as Reversal Pressure Starts to BuildGBPNZD has been in a steady, grinding decline, and the structure on the 4H chart shows a clean sequence of lower highs and lower lows. What stands out now is location: price is pressing into a well-defined support zone after a corrective channel breakdown. When a pair stretches this far in one direction while approaching higher-timeframe demand, I stop chasing and start asking whether the next move is exhaustion or continuation. The setup here is less about momentum and more about reaction at levels.
Current Bias
Short term: Bearish, but stretched — leaning toward corrective bounce risk.
Medium term: Still structurally bearish unless price reclaims the 2.28–2.30 resistance band.
Key Fundamental Drivers
GBP side: Bank of England remains cautious, with growth soft and structural drag themes still present in UK outlook discussions. Rate expectations are not aggressively rising, which limits strong GBP upside.
NZD side: NZD is sensitive to global risk sentiment and China-linked growth signals. When risk tone stabilizes, NZD tends to hold better than GBP.
Rate differential theme: Relative policy expectations between BoE and RBNZ are not widening sharply, which reduces strong trend fuel and supports more range or rotation behavior after extended moves.
Risk appetite: NZD benefits more than GBP in mild risk-on flows, reinforcing the recent downside in GBPNZD.
Macro Context
Interest rate expectations: Major central banks remain data dependent. Markets are reacting heavily to labor and inflation data rather than forward guidance alone. That keeps rate spread trades unstable.
Growth trends: UK growth signals remain uneven, while NZ is tied closely to external demand and commodity-linked flows.
Commodity flows: Stable to firm commodity tone tends to support NZD relative to GBP.
Geopolitical themes: Trade policy noise, sanctions chatter, and tariff discussions globally keep FX volatility elevated and favor selective risk currencies over slower-growth currencies like GBP at times.
Primary Risk to the Trend
The main risk to continued downside is risk sentiment flipping positive while USD and yields soften, which typically lifts NZD broadly — but if GBP catches a relative bid on UK data or BoE repricing, GBPNZD can snap back sharply from support. This pair is known for violent mean-reversion rallies after extended drops.
Most Critical Upcoming News/Event
Next high-impact UK data (inflation / growth / labor)
Any RBNZ policy signals or NZ inflation data
Major US labor or inflation releases that shift global rate expectations and risk sentiment (indirect but powerful driver for NZD crosses)
Leader/Lagger Dynamics
GBPNZD is typically a lagger pair.
It usually follows GBPUSD and NZDUSD direction rather than leading them.
Also reacts to AUDNZD and GBPAUD rotation flows.
If NZD strength shows first in NZDUSD and AUDNZD drops, GBPNZD often follows lower afterward.
If GBP starts outperforming across GBPUSD and GBPJPY, GBPNZD rebounds tend to follow.
Key Levels
Support Levels:
2.2600–2.2540 zone (current demand and recent low area)
Below that: 2.2300 area as deeper swing support if breakdown extends
Resistance Levels:
2.2815 area
2.2960 area
2.3400–2.3450 higher-timeframe supply zone
Stop Loss (SL):
Below 2.2500 for bounce setups from current support zone
Take Profit (TP):
First: 2.2815
Second: 2.2960
Extension: 2.3400 zone if broader reversal unfolds
Summary: Bias and Watchpoints
Right now GBPNZD is still bearish in structure, but it’s pressing directly into a major support zone after a prolonged slide, which raises the odds of at least a corrective bounce. Fundamentally, the pair has been driven by relatively softer GBP tone and steadier NZD risk sensitivity, but that spread is not expanding aggressively — which weakens trend continuation odds at extremes. The biggest risk to the downside trend is a shift in rate expectations or risk sentiment that boosts GBP relative to NZD and triggers a squeeze higher. I’m watching reactions around 2.26 support closely; failure there opens deeper downside, but a firm hold sets up a recovery toward 2.28 and possibly 2.30+. This is level-driven now, not chase-driven.
Gold consolidation remains bullish structureGold consolidation remains bullish after price action slowed and closed above the 5000 level. This behaviour suggests healthy digestion following the recent rally rather than trend exhaustion.
Gold prices rose today and tested the highest resistance level of the week. The move was supported by softer real yields, a weaker U.S. dollar, and renewed safe-haven demand ahead of key macroeconomic data.
Recent Federal Reserve signals have reinforced expectations for easier monetary policy. Comments from Fed official Mary Daly, indicating openness to one or two rate cuts, combined with risks of softer U.S. jobs and CPI data later this week, have increased bullish sentiment for bullion.
Tecnically, if bulls maintain control within the current range, a pullback toward the support zone is possible. As long as price holds this area and then achieves a daily close above 5060, upside momentum should strengthen. In that scenario, the next key resistance zone lies between 5130 and 5252.
You may find more details in the chart,
Trade wisely best of luck buddies.
Ps; Support with like and comments for better analysis Thanks for Supporting.

Hellena | EUR/USD (4H): LONG to 1.19523 (Nearest target).Colleagues, following on from the previous forecast, I believe it is necessary to come up with a new idea that does not contradict the old plan.
The price shows a resumption of the upward movement, and I think that now we need to highlight two main levels:
1) 1.17663 - if the price updates this level, it means that the structure is changing and the waves need to be redrawn.
2) 1.19074 - breaking through this level and above will mark the continuation of the upward movement. This means that the structure is not broken and wave “4” has formed lower than I originally thought, but within acceptable limits. In this case, I expect the nearest target of 1.19523 to be reached - the area of volume accumulation.
Manage your capital correctly and competently! Only enter trades based on reliable patterns!
