How to trade head and shoulder pattern? As a forex trader, it's essential to have a robust arsenal of technical analysis tools at your disposal. One of the most powerful and reliable chart patterns you can use is the "Head and Shoulders" pattern. This pattern is prized for its ability to signal potential trend reversals, allowing traders to make informed decisions and capitalize on market opportunities. In this comprehensive guide, we'll delve deep into the Head and Shoulders pattern, breaking down its components, identifying its variations, and learning how to trade it effectively.
Understanding the Head and Shoulders Pattern
The Head and Shoulders pattern is a classic reversal pattern that forms after an extended uptrend, signaling a potential change in market direction from bullish to bearish. It consists of three peaks, with the middle peak (the "head") being higher than the other two peaks (the "shoulders"). The pattern typically unfolds as follows:
1. The Left Shoulder
- The left shoulder represents the first peak after a strong uptrend.
- This peak is typically followed by a minor retracement, creating the first trough.
2. The Head
- The head forms after a brief rally from the left shoulder's low point.
- It represents the highest peak in the pattern and usually exceeds the previous peak.
- After reaching this peak, the price retraces again, forming the second trough.
3. The Right Shoulder
- The right shoulder is the third and final peak in the pattern.
- Like the left shoulder, it is lower than the head and forms after a minor rally.
- The right shoulder's high is followed by a retracement, creating the third trough.
Key Characteristics of the Head and Shoulders Pattern
To effectively identify and trade the Head and Shoulders pattern, it's crucial to understand its key characteristics:
1. Symmetry
- The left and right shoulders should be roughly symmetrical in terms of height and width.
- The head should be the highest point in the pattern.
2. Volume
- Volume plays a vital role in confirming the pattern.
- Volume should generally decline as the pattern forms and then increase as the price breaks below the neckline (more on this later).
3. Neckline
- The neckline is a trendline drawn horizontally connecting the low points of the left and right troughs (the shoulders).
- The neckline serves as a critical level of support. A breach of this level confirms the pattern.
Trading the Head and Shoulders Pattern
Trading the Head and Shoulders pattern involves two main steps: identification and execution.
Identification:
1. potting the Pattern: Begin by identifying a well-defined Head and Shoulders pattern on your forex chart.
2. Volume Confirmation: Ensure that volume decreases as the pattern forms and increases upon breaking the neckline.
3. Neckline: Draw a neckline connecting the lows of the left and right shoulders.
Execution:
1. Entry Point: Place a short trade when the price breaks below the neckline. This serves as a signal that the pattern has confirmed.
2. Stop-Loss and Take-Profit: Set a stop-loss order above the right shoulder and a take-profit order based on your risk-reward ratio.
3. Risk Management: Be mindful of risk management, and never risk more than you can afford to lose on a single trade.
Variations of the Head and Shoulders Pattern
While the classic Head and Shoulders pattern is powerful, variations can offer additional insights:
Inverse Head and Shoulders:
- An inverse Head and Shoulders pattern signals a potential bullish reversal.
- It comprises three troughs with the head being lower than the shoulders.
- The pattern is confirmed when the price breaks above the neckline.
Complex Head and Shoulders:
- Complex variations may have multiple heads or shoulders, making them harder to spot.
- Despite their complexity, they follow the same principles of confirmation through neckline breaches.
Conclusion
The Head and Shoulders pattern is a valuable tool in the forex trader's toolkit. By mastering its identification and execution, you can gain a competitive edge in the market. Remember that no pattern is foolproof, and risk management remains paramount in forex trading. As with any technical analysis tool, it's essential to combine the Head and Shoulders pattern with other indicators and analysis methods for a well-rounded trading strategy. So, start practicing, keep refining your skills, and always stay informed about the latest market developments to become a successful forex trader.
Head and Shoulders

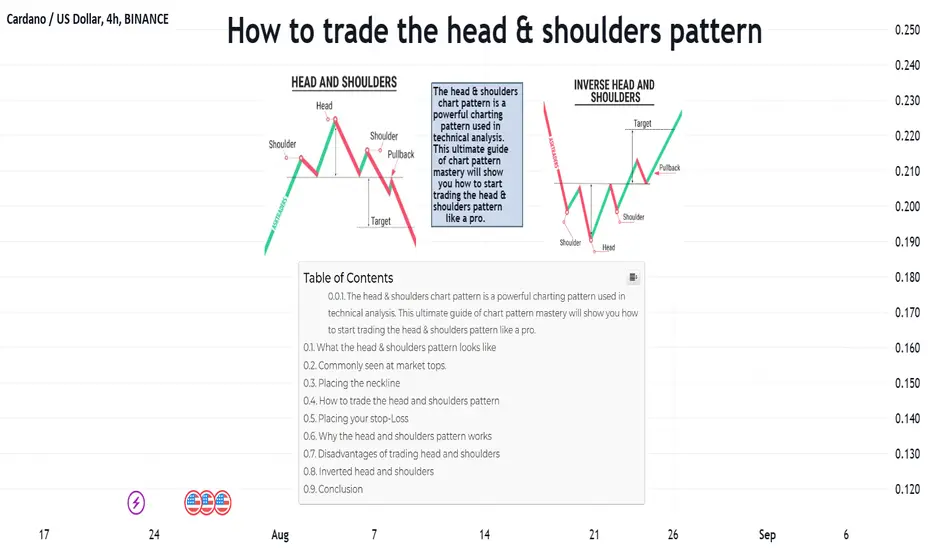
How To Trade The Head & Shoulders PatternThe Head & Shoulders is an extremely popular and easy to spot chart pattern used in technical analysis. After you read this guide you will know exactly what to look out for whilst trading. The pattern appears on all times frames and can, therefore, be used by day and swing traders as well as investors. Entry levels, stop levels and price targets make this trading formation easy to implement, as the chart pattern provides important and easy-to-see levels.
First, let’s look at the formation of the head and shoulders pattern:
Formation of the pattern:
Left shoulder: Price rise followed by a left price peak, followed by a decline.
Head: Price rise again forming a higher peak.
Right shoulder: A decline occurs once again, followed by a rise forming the right peak which is lower than the head.
As you can see from the image above, it is very similar to the triple top, however the peaks are of different heights and the neckline is not strictly horizontal.
A head and shoulders pattern is formed first by a peak (the shoulder) followed by a higher peak (the head) followed by another lower peak (the second shoulder).
In this instance, we draw the neckline by connecting the two lowest points that are visible from the pullbacks. More often than not the line will not be straight, but don’t worry this is typical for a head and shoulders pattern.
PLACING THE NECKLINE
The first step is to locate the left shoulder, head and right shoulder on the chart. In the standard head and shoulders pattern (market top), we connect the low after the left shoulder with the low created after the head. This creates our “neckline” – the blue dashed line on the example.
HOW TO TRADE THE HEAD & SHOULDER PATTERN
So how do we trade this? Well, we use the exact same method as the triple top and double top. Simply wait for a clean break of the neckline and then enter our SELL positions. We can expect a pullback to be a similar distance to the difference between the head and the neckline.
Tip: Some traders say that the signal is more accurate when then neckline is a downslope. This would signify that the market is clearly losing strength and the possibility of a clean break of the neckline is more likely.
Chart pattern formations are rarely textbook perfect, meaning there may be some discrepancies between the respective shoulders and head.
It is very important that traders wait for the pattern to complete. One should not assume that a pattern will develop or that a partially developed pattern will become complete in the future. Partial or nearly completed patterns should be watched, but no trades should be made until the pattern breaks the neckline.
In the head and shoulders pattern, we are waiting for price action to move lower than the neckline after the peak of the right shoulder. For the inverse head and shoulders, we wait for price movement above the neckline after the right shoulder is formed.
A trade can be initiated as the pattern completes. Plan the trade beforehand, writing down the entry, stops and profit targets and noting any variables that will change your stop or profit target. The most common entry is when a breakout occurs – the neckline is broken and a trade is taken. Another entry point requires more patience and comes with the possibility that the move may be missed altogether. This method involves waiting for a pullback to the neckline after a breakout has already occurred. This is more conservative in that we can see if the pullback stops and the original breakout direction resumes, but it also means the trade may be missed if the price keeps moving in the breakout direction.
PLACING YOUR STOP-LOSE
In the traditional market top pattern, the stop-loss is placed just above the right shoulder (topping pattern) after the neckline is penetrated. As a break above this point is usually where the pattern becomes invalidated. Alternatively, the head of the pattern can be used as a stop, but this is likely a much larger risk and reducing the reward to risk to reward ratio of the pattern.
WHY THE HEAD & SHOULDER PATTERNS WORKS
No pattern is perfect, nor does it work every time. Yet there are several reasons why the chart pattern theoretically works:
As price falls from the market high (head), sellers have begun to enter the market and there is less aggressive buying.
As the neckline is approached, many people who bought in the final wave higher or bought on the rally in the right shoulder are now proven wrong and facing large losses – it is this large group that will now exit positions, driving the price toward the profit target.
The stop above the right shoulder is logical because the trend has shifted downwards – the right shoulder is a lower high than the head – and therefore the right shoulder is unlikely to be broken until an uptrend resumes.
The profit target assumes that those who are wrong or purchased the security at a poor time will be forced to exit their positions, thus creating a reversal of similar magnitude to the topping pattern that just occurred.
The neckline is the point at which many traders are experiencing pain and will be forced to exit positions, thus pushing the price toward the price target.
Volume can be watched as well. During inverse head and shoulder patterns (market bottoms), we would ideally like the volume to expand as a breakout occurs. This shows increased buying interest that will move price toward the target. The decreasing volume shows a lack of interest in the upside move and warrants some scepticism.
DISADVANTAGE OF TRADING HEAD & SHOULDER PATTERN
As stated, no trading pattern is perfect. Here are some potential problems with trading a Head and Shoulders pattern:
You need to find patterns and watch them develop, but you should not trade this strategy until the pattern is completed. So it could mean a long period of waiting.
It will not work all the time. During times of high volatility, the stop-loss levels will sometimes be hit.
The profit target will not always be reached, so traders may wish to fine-tune how the market variables will affect their exit from the security.
The pattern is not always tradable. For example, if there is a massive drop on one of the shoulders due to an unpredictable event, then the calculated price targets will likely not be hit.
Patterns can be subjective. One trader may see a shoulder, where another does not. When trading patterns, define what constitutes a pattern for you beforehand – given the general guidelines above.
INVERTED HEAD & SHOULDER PATTERN
As with most of these patterns, there is always a mirror pattern that works in the exact same way. Here is an example of an inverted head and shoulders pattern.
As you would expect, the inverted head and shoulders pattern only arises in a downtrend and must meet all of the same criteria as the standard head and shoulders pattern.
We simply place a LONG once there is a clear break of the neckline and the trend reversal is confirmed.
CONCLUSION
Head and shoulder patterns occur on all times-frames, and can be easily seen visually. While subjective at times, the complete pattern provides entries, stops and profit targets, making it easy to implement a trading strategy. The pattern is composed of a left shoulder, head, then followed by a right shoulder.
The most common entry point is a breakout of the neckline, with a stop above (market top) or below (market bottom) the right shoulder. The profit target is the difference of the high and low with the pattern added (market bottom) or subtracted (market top) from the breakout price. The system is not perfect, but it does provide a method of trading the markets based on logical price movements. (Profit-taking opportunities abound using this lesser-known pattern.
📈 4 BULLISH PATTERNS YOU NEED TO KNOW📌How to easily identify these patterns?
🟢Cup and Handle Pattern
The cup and handle pattern is a bullish continuation pattern that typically occurs after a significant uptrend. It is characterized by a U-shaped "cup" followed by a smaller consolidation known as the "handle." The cup portion represents a temporary pause or correction in the price, forming a rounded bottom. This signifies that selling pressure has diminished, and buyers are stepping in. After the cup formation, the handle is formed as a slight downward drift in price, usually in the form of a small consolidation or a shallow retracement. The handle represents a final consolidation before the resumption of the bullish move. The handle should be relatively smaller in size and have a downward-sloping price action.
🟢Double Bottom
The double bottom pattern is a bullish reversal pattern that signifies a potential trend reversal from bearish to bullish. It consists of two consecutive lows that are approximately at the same level, forming a support level. The first low represents a selling climax or a period of intense selling pressure. After the first low, the price rebounds and retraces to form a temporary high, creating a potential resistance level. However, buyers step in again, pushing the price back up, resulting in a second low that matches or is very close to the level of the first low. This double bottom formation indicates a significant level of support where buying interest outweighs selling pressure.
🟢 Bullish Flag
The bullish flag pattern is a continuation pattern that occurs after a strong upward move in price. It is characterized by a brief period of consolidation, where the price forms a narrow and rectangular range, resembling a flagpole and a flag. The flag portion of the pattern is typically slanted in the opposite direction of the initial price move. The flagpole represents the initial strong upward move, indicating a surge in buying interest. Following the flagpole, the price enters a consolidation phase, represented by the flag. This consolidation allows the price to stabilize and absorb selling pressure. The flag pattern should have parallel trendlines that contain the price action.
🟢Inverse Head and Shoulders
The inverse head and shoulders pattern is a bullish reversal pattern that indicates a potential shift from a bearish to a bullish trend. It consists of three consecutive lows, with the middle low (the head) being lower than the two outer lows (the shoulders). The pattern resembles a head between two shoulders. The left shoulder forms as the price declines, followed by a subsequent rally to create a temporary high. The price then retraces, forming the head, which is lower than both the left and right shoulders. After the head, the price rallies again to form the right shoulder, which is usually slightly higher than the left shoulder.
👤 @QuantVue
📅 Daily Ideas about market update, psychology & indicators
❤️ If you appreciate our work, please like, comment and follow ❤️

THE KING OF THE HEAD AND SHOULDERS | How to find this pattern
⚡Zer0_Trader
The essence of the strategy is to search for the direct and inverted "Head & Shoulders" pattern
Shoulders" pattern with the simultaneous confirmation of its potential workout on
Zer0 Trader Indicator" indicator, which makes it possible to trade regularly,
minimizing the closing of trades by stops.
❌TRADING WITHOUT AN INDICATOR
We see the "Head & Shoulders" formation, enter the trade 🔜 the trade is closed by a Stop Loss⛔
✅Trading with the "Zer0 Trader Indicator" indicator
We see the formation "GIP", we see the confirmation of the result on the indicator, we go into
trade 🔜 trade is closed at Take Profit
As you can see from the examples above, it is absolutely not enough to find
only a formation because:
- Perfect formations are quite rare in the market, and full-fledged
it is necessary to trade regularly to make a full-fledged profit;
- Every trader tends to see or "complete" a formation where it is not
any trader has a tendency to see or "draw" a formation where it doesn't exist and this leads to an increase in loss-making trades;
- without additional confirmation of a potential working out of a formation your deals
form, your trades will be closed by stops more often and take unnecessary losses which
you could have avoided using the indicator.
📈 INDICATOR "Zer0 Trader Indicator"
In order to enter non-obvious but potentially profitable situations and
I created the "Zer0 Trader Indicator" indicator to minimize errors. Thanks to
which increased the percentage of profitable trades by 90%, and the percentage of trades closed
of trades closed by stop was reduced to 10%.
The signal to enter the trade, along with the formation of Head & Shoulders/reverse Head & Shoulders, are the reduction of
strength on the indicator, namely, descending peaks (divergence/convergence), as in the
examples below.
🔎EXAMPLES OF WORKOUTS
In the framework of the trading strategy with the use of the indicator all situations can be
can be divided into 2 types:
- Head & Shoulders/ reverse Head & Shoulders with a flat base
- Head & Shoulders/ reverse Head & Shoulders with diagonal base
🟢Head & Shoulders/ reverse Head & Shoulders with flat base
*ideal, but rather rare situation
🟢Head & Shoulders/ reverse Head & Shoulders with a diagonal base
*The situation you will deal with most often
✍️ STEP BY STEP INSTRUCTIONS FOR WORK
Setting up a chart in TradingView
- Line" chart view
- logarithmic scale
Searching for the Head & Shoulders/ reverse Head & Shoulders pattern
- it is important that similar patterns draw several coins simultaneously
- on a downtrend, the chart and the indicator should be reversed (the scale should be inverted)
- you can look for a pattern by the indicator (divergence)
- the more ideal-looking is the pattern, the higher is the probability of its execution
- it is important that the pattern is drawn correctly not only on the line, but also on a candlestick chart
chart
Comparison of the chart and the indicator
The indicator must show a decrease in strength (three
divergence).
Searching for the entry point
TVX - entry point when the neckline is broken and the
of the candle behind it. It's important to have an identical pattern
on other coins as well.
Risk evaluation
Potential of the trade is measured from the top of the head to
the level of the neck line. We draw a line from the peak of the head to the
the neck line and re-position it to the potential breakout point.
We take the "Short/Long Position" tool and put
it in the TVX. Then we stretch out the targets by the level of potential,
and stop 3-4% above the head (on the candlestick chart).
Setting targets
Objective 1 (45%) - from the entry point to the middle of the breakout
Target 2 (45%) - till the end of analysis
Target 3 (10%) - to the moon, based on the previous extremums
*At achievement of the first target we move the stop to the Buy
☢️ THE MOST COMMON MISTAKE
Entering a trade in the absence of a pronounced divergence on the indicator
Such an error leads, at a minimum, to unjustified and useless losses, and, at a maximum, to
at most, liquidation, if there were no stops at all!
🔴THE MOST IMPORTANT SECTION
WHERE TO START TRADING?
You have read this tutorial, you understand everything and you are ready to fix the profit. BUT!
The first thing you need to start with is training on history and developing
observation of not just the chart, but the chart through the prism of this strategy. For
I strongly recommend each of you to do your homework.
Despite the fact that I've been trading for several years now, I myself regularly
myself on a regular basis.
HOW TO DO MY HOMEWORK?
1. You pick any coin and any year that has already completely passed.
2. Rewind the chart to January 1 and press "Market Simulator", which
will hide the chart movement from you after that date.
3. Choose a simulation speed of x10 and press the "Forward" button until you see the potential formation of the right shoulder,
until you see the potential formation of the right shoulder and head.
4. Next, you draw a potential neck line, a working pattern, and wait for
for confirmation of the formation. Additionally, see if a similar situation is drawn on other charts.
situation on other charts.
5. The deal worked out.
6. Make 2 screenshots (line + candlestick) and enter the results in the table
"Home" in your worksheet.
7. You save the screenshots in the folder with the name of the coin and drop them into the chat room, where I will
give comments.

Classic Trend Reversal Patterns📚
✅It is difficult to overestimate the importance of the classic continuation and reversal patterns. For a real trader trading on the Forex market, it is huge, because these patterns make it possible to predict the behaviour of the price.
⚠️If one of the trend continuation patterns appears in front of us on the chart, it means that the usual correction (rollback) is taking place. After its completion, it becomes possible to profitably enter the market at the existing rate.
📈📉Head & Shoulders
🟢The Head and shoulders pattern is a reversal pattern that is usually formed during a bullish trend and creates a top — the first shoulder. After the correction, the price creates a higher top — the head. After the next correction, the price creates a third top, which is below the head — the second shoulder. So, we have two shoulders and a head in the middle.
🟢Of course, the head and shoulders reversal pattern has its inverse equivalent, which turns bearish trends into bullish ones. This pattern is called the Inverted Head and Shoulders pattern.
🟢Confirmation of the pattern occurs when the price breaks the line that runs through two bases on either side of the head. This line is called the neckline. When the price overcomes the neck line, we get a reversal signal.
📊Double Top and Double Bottom
🟢A double top consists of two peaks on the chart. These peaks are either at the same resistance level, or the second peak is slightly lower. A sample of a double top usually looks like the letter "M".
🟢A double top has its opposite, which is called a double bottom. This model consists of two bases, which are either located at the same support level, or the second base is slightly higher. The double bottom pattern usually looks like the letter "W".
🟢Confirmation of the Double top pattern comes at the moment when the price breaks through the minimum between the two tops. This level is marked by a line on the chart and is called a signal line.
🟢The stop loss order should be placed directly above the second top. The minimum profit target is equal to the distance between the neck and the center line that connects the two tops.
❗️The double bottom looks and works exactly the same.
💎Diamond
🟢It is quite difficult to see this pattern on a real chart – it looks like a standard flat, but with unstable volatility. A diamond means, at least, medium-term market uncertainty, when the probability of movement in any direction is almost the same. But the longer it takes to form, the stronger the breakdown and the subsequent trend will be.
☕️Cup with Handle
🟢The cup with handle pattern is considered a bullish continuation pattern, so it is necessary to determine the previous uptrend. This can be done by analyzing price dynamics or technical indicators, such as moving averages.
The cup should be more U-shaped, not V-shaped, and the upper points on both sides of the cup should be approximately at the same level.
❤️ Please, support our work with like & comment! ❤️

Head and Shoulder PatternThe head and shoulders pattern is a popular chart pattern used in technical analysis to predict potential reversals in price trends. It is named after its visual resemblance to a head and two shoulders. The pattern is typically formed after an uptrend and is considered a bearish reversal pattern.
Here are the key characteristics of a head and shoulders pattern:
1. Formation: The pattern consists of three peaks or highs, with the middle peak (the head) being the highest and the two outer peaks (the shoulders) being slightly lower in height. The lows between the peaks are known as neckline valleys.
2. Neckline: The neckline is a support level that connects the lows between the peaks. It acts as a crucial level to watch for confirmation of the pattern. The neckline can be sloping upward, downward, or horizontally.
3. Volume: Volume is an essential factor in confirming the pattern. Typically, volume is higher during the formation of the left shoulder and the head and lower during the formation of the right shoulder. A significant increase in volume can occur when the price breaks below the neckline, confirming the pattern.
4. Breakout: The pattern is considered complete when the price breaks below the neckline. This breakout is seen as a confirmation of the bearish reversal, indicating a potential trend reversal from an uptrend to a downtrend.
5. Price Target: To estimate the potential downside target, measure the vertical distance from the neckline to the top of the head and subtract that distance from the breakout point. This projected target represents a potential price level that the stock or asset could reach after the pattern is confirmed.
The accuracy rate of the head and shoulders pattern, like any other chart pattern, is subjective and varies depending on several factors. It is important to understand that no pattern or indicator guarantees 100% accuracy in predicting future price movements.
The accuracy of the head and shoulders pattern can be influenced by various factors, including the timeframe in which it occurs, the market conditions, and the quality of the pattern itself. Some head and shoulder patterns may be more reliable and accurate than others based on these factors.
Traders and analysts often use additional confirmation signals and indicators, such as volume analysis, momentum oscillators, and trendlines, to increase the reliability of their predictions when identifying head and shoulders patterns.
While the head and shoulders pattern is widely recognized and used by technical analysts, it is important to use it as part of a comprehensive trading strategy, considering other factors such as fundamental analysis, market sentiment, and risk management.

Ninja Talks EP 18: The FOMO ParadoxThe FOMO Paradox: Fearlessly Embrace the Joy of Missing Out
In the vast realm of trading, where fortunes are made and lost, one peculiar phenomenon reigns supreme: FOMO, the Fear of Missing Out. It is a force that tempts even the most seasoned traders, whispering in their ears with alluring promises of quick gains and overnight success. But in this whimsical journey through the tradingverse, we shall embark on an intellectual escapade to unravel the paradoxical nature of FOMO, armed with humor, wisdom, and the power of restraint.
1. The FOMO Symphony: An Ode to Irrationality
Imagine, dear reader, a symphony hall filled with traders, each playing their instruments of irrationality. The violins of impulsive buying, the trumpets of chasing trends, and the drums of unchecked greed. Amidst this cacophony, the conductor whispers, "Fear not the fear of missing out, for it is but a deceptive melody, luring you into a dance of folly."
2. The 'Emo' of FOMO: Trading with Feelings
Ah, the emotional rollercoaster of FOMO, where rationality takes a backseat and the heart commands the trades. It's like being on a blind date with the market, where you're desperate for a connection, but all you end up with is a hefty loss and a broken heart. Remember, dear trader, emotions make for terrible trading partners. As Warren Buffett wisely said, "The stock market is a device for transferring money from the impatient to the patient."
3. FOMO and the Illusion of Predictability
In the enchanted land of trading, FOMO whispers sweet tales of predictable trends, promising riches to those who dare not miss out. But as the legendary trader Jesse Livermore declared, "The market is designed to fool most of the people most of the time." So, when FOMO comes knocking at your door, be ready to greet it with skepticism and a firm understanding that market movements are as predictable as a cat chasing its own tail.
4. The Wisdom of the Watchful Owl
Picture yourself as an owl perched high atop the trading tree, observing the market with unwavering focus. You know that succumbing to FOMO means flying blindly into the night, destined to collide with unforeseen risks. Instead, let patience be your wings, and knowledge be your guiding light. Remember the ancient proverb, "A wise trader is one who embraces the joy of missing out, for it is the gateway to disciplined decision-making."
5. The 'FauxMO' Rebellion: Making Fear Funny
Let us unleash our inner court jesters and laugh in the face of FOMO! Embrace the power of satire and humor to disarm the seductive allure of quick profits. Create your own FauxMO index, where the most overhyped assets are mockingly celebrated. Treat it as a reminder that while FOMO may be real, it's better to join the circus of laughter than the parade of losses.
As we bid adieu to the whimsical tradingverse, let us etch these words into our trading strategy: "Fearlessly embrace the joy of missing out, for it is in patience and restraint that true market mastery resides." Remember, dear trader, the market rewards those who approach it with intellect, discipline, and a hearty dose of humor. So, resist the siren call of FOMO and embark on your trading journey with confidence and a twinkle in your eye. Happy trading, and may the FOMO be with you... or rather, may it be far, far away!

“Well, not everybody understands the patterns” Limitless 2011
In the movie Limitless (2011), Eddie Morra (Played by Bradley Cooper) takes a mysterious pill, NZT-48 , that turns him from a struggling writer to a financial wizard . The pill unleashes 100% of his cognitive power, transforming him into an intellectual powerhouse.
About 40 minutes in, there is a scene.
Hank: "Pattern recognition. That's your snake oil?"
Eddie: "Well, not everybody understands the patterns."
Why am I sharing this? Well, because not everybody understands the patterns, especially most traders.
Did you know that chart patterns actually work?
Not all patterns work, just some of them.
Although there are numerous patterns in technical analysis books, many of them are actually snake oil.
Take, for example, the Bull Flag; this is a Flag pattern occurring in an uptrend, usually during a bull market. The flag pattern is proven* to be snake oil; it is no more than a 50/50 chance of success.
Only one flag pattern works; it is called a high tight flag* and works 85% of the time.
The chart above (NVDA) is an example of one of the most accurate and successful patterns in technical analysis.
The Inverse Head and Shoulders.
The inverse head and shoulders is a well-known chart pattern. But how reliable is it?
Based on thousands of tested trades from 1996 to 2020, it has an 89% success rate and an average price increase of 45%.
Two decades of research* shows an inverse head and shoulders chart pattern has an 89% success rate for a reversal of an existing downtrend during a bull market.
When this pattern works, it averages a price increase of 45%; this is one of the most reliable chart patterns.
In fact, the NVIDIA chart above made 43% and has exceeded the target.
Trading is a Game of Probabilities
Trading is definitely a game of probability, but few traders understand the actual probability of each trade.
Now that you know the inverse head and shoulders is 89% successful with an average upside of 45%; you can assess your risk/reward and make better trades.
Sure, there is an 11% chance of failure and a lower-than-average price increase, but now you know the odds.
Take TradingView's NZT-48 Pill
In the movie Limitless, Eddie takes the NZT-48 pill and becomes a top trader.
But did you know that TradingView is like the NZT-48 pill?
How?
Because the inverse head and shoulders pattern in NVIDIA (chart above) was discovered and annotated with TradingView's pattern recognition algorithms .
TradingView does the hard work for you; it even sets the correct price target and lets you know when it is reached.
If you are trading and not using TradingView's in-built pattern recognition, you are not utilizing the NZT-48 superpower.
How to Turn On Pattern Recognition in TradingView
Click Indicators > Technicals > Patterns
Next, select the patterns you want.**
I hope this was useful; if you like, hit like. If you want more, hit follow.
Happy trading, traders!
*Source: The Encyclopedia of Chart Patterns (2021 Wiley) by Tom Bulkowski
**I would not recommend using the Pennant Patterns; they are proven not to work.

📊How To Trade: H&S Pattern📍How to Identify and Use the Head and Shoulders Pattern
The head and shoulders pattern is characterized by key features to look out for on trading charts. It typically occurs after a bullish uptrend when buying pressure begins to fade. The pattern includes a left shoulder, a higher middle peak, and a right shoulder approximately at the same level as the left shoulder. Additionally, the pattern should have a distinct neckline acting as a support level.
✔️To successfully identify and trade the head and shoulders pattern, consider the following step-by-step approach:
🔹 Look for three distinct tops , namely the left shoulder, head, and right shoulder, which occur after an uptrend.
🔹 Identify the neckline support level , which connects the lowest points of the left and right shoulders.
🔹 Wait for a breakout to occur, confirmed by a candle closing below the neckline.
🔹 Once the breakout is confirmed, place a selling order to capitalize on the bearish reversal signaled by the pattern.
🔹 Implement a stop-loss order above the neckline, ideally positioned at the highest level of the right shoulder, to manage risk effectively.
🔹 Consider using a risk-reward ratio to determine a suitable target for taking profits, ensuring the potential reward justifies the risk taken.
Lets consider the following example below as a step by step to identify the pattern. This is what it would look like in a real scenario:
Step 1: Price is moving on an uptrend and starting to form the head and shoulder peaks
Step 2: We can identify the neckline which we can observe price react as a temporary support which connects the lower peaks. We need to wait for a clear breakout in order to find an entry
insert s2.png image here
Step 3: Price broke below the neckline and re-tested the neckline so we enter a short position on the re-test with taking profit target the length of the head to neckline
insert s3.png image here
Step 4: We can see the pattern was correct and it hit our targets
insert s4.png here
👤 @QuantVue
📅 Daily Ideas about market update, psychology & indicators
❤️ If you appreciate our work, please like, comment and follow ❤️

Overview of Reversal Chart Pattern IndicatorHello Everyone,
In this video, we discussed briefly about
Different Reversal Chart Patterns
Zigzag and Patterns Ecosystem of Libraries and Indicators developed in Pinescropt
Recursive Reversal Chart Pattern Indicator
Adding the snapshot for reference
Link to the Indicator:
Search for Zigzag and Pattern Ecosystem libraries and indicators in my profile if you like the subject :)

Learn Top 4 Price Action Pattern to Trade Reversals
Hey traders,
In this article, I will share with you the list of 4 best reversal price action patterns.
📍Ascending & Descending Triangles
The main element of the ascending triangle as the REVERSAL pattern is the BEARISH impulse leg, preceding the formation of the pattern.
The pattern consist of 2 main elements:
a horizontal neckline based on the equal highs,
a rising trend line based on the higher lows.
❗️The trigger is a bullish breakout of a neckline of the pattern and candle close above.
📈The position is opened on a retest.
🔴Stop loss is lying at least below the level of the last higher low.
🎯Take profit is the next historical resistance.
——————
📍The main element of the descending triangle formation as the reversal pattern is the BULLISH leg, preceding the formation of the pattern.
The pattern consist of 2 main elements:
a horizontal neckline based on the equal lows,
a falling trend line based on the lower highs.
❗️The trigger is a bearish breakout of a neckline of the pattern and candle close below.
📉The position is opened on a retest.
🔴Stop loss is lying at least above the level of the last lower high.
🎯Take profit is the next historical support.
📍Rising & Falling Wedges
What makes a rising wedge pattern a reversal pattern?
Before the formation of the pattern, the price should form a strong bullish impulse and trade in a bullish trend.
The pattern consists of 2 contracting, rising trend lines based on the higher highs and higher lows.
❗️The trigger is a bearish breakout of a support of the pattern and candle close below.
📉The position is opened on a retest.
🔴Stop loss is lying above the high of the pattern.
🎯Take profit is the closest horizontal support.
——————
What makes a falling wedge pattern a reversal pattern?
Before the formation of the pattern, the price should form a strong bearish impulse and trade in a bearish trend.
The pattern consist of 2 contracting falling trend lines based on the lower lows and lower highs.
❗️The trigger is a bullish breakout of a resistance of the pattern and candle close above.
📈The position is opened on a retest.
🔴Stop loss is lying below the low of the pattern.
🎯Take profit is the closest horizontal resistance.
📍Double Top & Bottom
Double bottom pattern usually forms at the end of a bearish trend.
After a strong bearish impulse, the price retraces, sets a lower high and retests the current low.
Instead of going lower, the price retraces one more time, retests the level of the last lower high and breaks it.
Such a formation confirms a bullish reversal.
❗️The trigger is a bullish breakout of a neckline of the pattern and a candle close above.
📈The position is opened on a retest.
🔴Stop loss is lying below the lows of the pattern.
🎯Take profit is the closest horizontal resistance.
——————
Double top pattern usually forms at the end of a bullish trend.
After a strong bullish impulse, the price retraces, sets a higher low and retests the current high.
Instead of going higher, however, the price retraces one more time, retests the level of the last higher low and breaks it.
Such a formation confirms a bearish reversal.
❗️The trigger is a bearish breakout of a neckline of the pattern and a candle close below.
📈The position is opened on a retest.
🔴Stop loss is lying above the highs of the pattern.
🎯Take profit is the closest horizontal support.
📍Head & Shoulders Pattern & Inverted One
Inverted H&S pattern usually forms at the end of a bearish trend.
The price forms a zig-zag movement with 3 main elements:
the left shoulder with a lower low, the head with a new lower low, and the right shoulder with a higher low.
While the price sets multiple lows, it keeps setting the equal highs, composing a so-called horizontal neckline.
A bullish reversal becomes confirmed once the price breaks and closes above the neckline.
❗️The trigger is a bullish breakout of a neckline of the pattern and a candle close above.
📈The position is opened on a retest.
🔴Stop loss is lying below the lows of the pattern.
🎯Take profit is the closest horizontal resistance.
——————
Head & Shoulders pattern usually forms at the end of a bullish trend.
The price forms a zig-zag movement with 3 main elements:
the left shoulder with a higher high, the head with a new higher high, and the right shoulder with a lower high.
While the price sets multiple highs, it keeps setting the equal lows, composing a so-called horizontal neckline.
A bearish reversal becomes confirmed once the price breaks and closes below the neckline.
❗️The trigger is a bearish breakout of a neckline of the pattern and a candle close below.
📈The position is opened on a retest.
🔴Stop loss is lying above the highs of the pattern.
🎯Take profit is the closest horizontal support.
In order to increase the accuracy of trading these patterns, I would recommend trading them only if they are formed on key levels:
Bearish patterns on key resistances and bullish patterns on key supports.
Also, higher is the time frame where you spotted the patterns, higher is the chance that it will give a valid reversal signal.
❤️Please, support my work with like, thank you!❤️

The importance of waiting for a secure buying point
Most investors can never control their inner greed and blindly chase market trends after missing a reasonable entry point.
Impatience often leads to premature positions, which means enduring market fluctuations before the expected uptrend or downtrend materializes. In this situation, you often cannot hold on or your stop loss level will not allow you to hold on.
If the stop loss level is set too wide, it can lead to significant losses once triggered. If it is set too narrow, it is easy to be hit by market volatility.
These phenomena are due to a lack of patience on the part of traders, the underlying reason being the eagerness to make money and the fear of missing out on the best opportunities, manifested in premature entry, which is actually greed.
Some people enter the market too late, underlyingly due to fear of missing out on this market cycle and eagerness to make money, which is actually fear.
Let's encourage each other!
COMEX:GC1! FX:EURUSD TVC:USOIL NASDAQ:IXIC BINANCE:BTCUSDT

QML pattern Quasimodo | SMART MONEY CONCEPTHello all. Today we will talk about the reversal pattern "Quasimodo" or QML. Schematically it looks like this:
The price moves in the trend, in POI the structure breaks and after that, the price can not update the previous HH and the downward movement continues (consider a schematic example).
In this example, after the breakdown of the structure, the price reverses to soften and remove internal liquidity, after which a reversal occurs. This is done in order to close a losing position at the expense of those who put their stop losses behind the maximum of the substructure.
There are many names for this pattern, such as three tap setup, but I'm more accustomed to calling it quasimodo. If you like, it's a reworked version of the "head and shoulders" pattern, but in this case you're focusing on the price action instead of the picture.
Criteria for QML formation
1. Use it in HTF POI
2. Watch HTF POI
3.Watch the price action.
4. Premium or Discount zone
To use the pattern effectively, you must analyze the chart of all TFs. And use the pattern as an entry model. For example, the daily TF is bearish. The price is in the premium zone, as well as on the H1 TF began an uptrend, a full of bullish trend in the lower TF, after which we see that the substructure (red) has changed from a rising to a descending. And thus, we expect a continuation of the downtrend.
Important
Don't use this pattern in terms of "drawing". They can draw anything on the chart. I recommend to look for POI in POI of higher TFs.
An additional factor could be substructure fluctuations before FWG or OB. You need to see how the price behaves after their update.
Where to put a stop loss
The first option is a stop-loss for a local FVG/OB
The second - above swing high of substrucutre
Third - above the HTF point of interest, if your RR allows it
EXAMPLE
After updating the all-time high, the daily structure was broken. Then price consolidated, it was worth waiting for the manipulation. It was possible to enter from HTF POI - aggressive entry, but it was possible to wait for confirmation on the LTF (as I do).
I'm expect bullish OF on 4H chart to HTF POI (2D ob)
This "entry into position" is shown as an example, so that you can form an understanding of how to act in this or that situation. In conclusion, the more factors you take into account in your analysis, the higher the probability of working out of the pattern. Also, it's up to you to choose what kind of stop loss you will use. There is no right and wrong, everything depends on your strategy and money management.
The position was opened after the second liquidity raid in the premium market. I hope it was helpful to you. Thank you for your attention

HEAD AND SHOULDERS PATTERN - TRADING GUIDE Head and Shoulders pattern
This lesson will cover the following
What is a “Head and Shoulders” formation?
How can it be confirmed?
How can it be traded?
The Head and Shoulders pattern forms after an uptrend, and if confirmed, marks a trend reversal. The opposite pattern, the Inverse Head and Shoulders, therefore forms after a downtrend and marks the end of the downward price movement.
As you can guess by its name, the Head and Shoulders pattern consists of three peaks – a left shoulder, a head, and a right shoulder. The head should be the highest and the two shoulders should be at least relatively of equal height. As the price corrects from each peak, the lows retreat to form the so-called neckline, which is later used for confirming the pattern. Here is what an H&S pattern looks like.
Other key elements of this pattern and its trade process are the breakouts, protective stops, profit target, and volume, which is used as an additional tool to confirm the trend reversal. So here is how you identify the Head and Shoulders pattern and how its individual components are characterized.
Formation and confirmation
In order to have a trend reversal pattern, you definitely need a trending market. Let's talk about the first model of H&S, the Inverse or Reversal will have the same methodology but exactly in the opposite way.
While prices are trending up, our future patterns left shoulder forms as a peak, which marks the high of the current trend. For the shoulder to be formed, the price then needs to correct down, retreating to a low, which is usually above or at the trend line, thus, keeping the uptrend still in force. This low marks the first point used to determine where the neckline stands.
Afterward, a new higher peak begins to form, stemming from the left shoulder low, which is our pattern head. As the market makes a higher high (the head), it then corrects back and usually, this is the point where the upward trend is penetrated, thus signaling a shift in momentum and a possible Head and Shoulders pattern.
The second low that is touched after the retreat from the heads peak is the other point used to build the neckline, which is basically a line drawn through the two lows.
The subsequent rebound from the second low forms the third peak – the right shoulder. It should be lower than the head and overall match the height of the left shoulder (keep in mind that exact matches rarely occur). It is also preferable that the two shoulders have required relatively the same amount of time to form as this would make the pattern stronger.
In order for the Head and Shoulders pattern to be confirmed, the retreat from the third peak (the right shoulder) should penetrate the neckline and a candle should close below it.
The neckline itself should be horizontal in the perfect case scenario, but that rarely happens. Instead, most often it is sloping up or down and that is of significance as well – a downward-sloping neckline is more bearish than an upward-sloping one.
Volume
As mentioned above, volume plays a key role as a confirmation tool and can be measured via indicators or by just analyzing its levels. Presumably, volume during the left shoulder advance should be higher than during the subsequent one, because as the head hits a higher high on the base of declining volume, this serves as an early signal for a possible reverse. This, however, does not happen every time.
The next step of confirmation comes when volume increases during the decline from the head's peak and the last nail in the coffin are when volume gains further during the right shoulder's decline.
Trading the pattern, stops and profit targets
We said earlier that the Head and Shoulders pattern is deemed confirmed if the right shoulder's decline penetrates through the neckline and a candle closes below it. As soon as that happens and you are reassured that it is not a false breakout, you can enter into a short position. However, as you already know, no trading decisions should be made on the go, i.e. you need to have predetermined where your protective stop is going to stand and what your profit target is.
Protective stop
There are two common places where you can place your stop loss. The first one, which is more conservative, is right above the peak of the head, while a more standard position is right beyond the right shoulder. You can see those visualized in the following screenshot.
The second option makes more sense because if the breakout through the neckline actually fails and the price rebounds back with such momentum that it rises beyond the right shoulder, then the whole pattern is flawed and you definitely do not need to wait for it to exceed the head as well. Besides, such a loose stop significantly increases the risk and reduces the risk/reward ratio, thus, reducing this pattern's trading appeal.
Profit target
The most common and often advised profit target is the distance (number of pips) between the head's peak and the neckline. Having estimated that distance, you then need to subtract it from the neckline, just like in the screenshot below.
And how does that translate in terms of risk/reward ratio? If the breakout confirmation (the close beyond the neckline) appears very close to the neckline itself, and we enter into a short position there, we generally have a 1:1 risk-to-reward proportion, if we use a conservative protective stop. Why?
Since our profit target is the distance between the heads peak and the neckline, if we decide to use the conservative option for a protective stop, then we will have the same distance as a loss limit, thus, reducing our risk-to-reward ratio to 1:1.
This is why, in order to improve that ratio, most experienced traders place their protective stops more often above the right shoulders peak, given that they use the head-to-neckline profit target.
However, keep in mind that this price distance should serve as a rough target, because things are usually not that straightforward and other factors such as previous support levels, crossing mid-term and long-term moving averages, etc. must be taken into consideration as well.
Two ways to trade the Head and Shoulders Pattern
There are generally two ways to trade this pattern, depending on how it plays out. The first one we've already mentioned. As soon as a candle closes below the neckline as a sign of confirmation, you enter into a short position with the respective profit target and protective stop described above.
Now for the second way to trade the H&S formation. In this case, we have a pullback after the neckline penetration, which, once support, now acts as a resistance level. This time we need to go short once the price pulls back and tests the neckline as resistance. As soon as it rebounds from the neckline, we enter into a short position, using the same principle for placing the protective stop and aiming for the same profit as in the first scenario. Here is what this would look like.

Forget about chart patterns! Hello, my dear friends and happy New Year!
I wish you to be healthy and reach all your goals in trading and not only! Never give up on this difficult way which we are going to overcome together!
Today we have a very important topic. How to use Elliott waves instead of classical chart patterns. This is the natural exposure why the chart patterns are garbage. I remember my third year at university when we have the trading lessons. Our teacher gave us a lot of useless knowledges about support, resistance and chart patterns. I have not understood why it should working and it was not soo intereting subject for me. That’s why I returned back to trading much later using self-education. Now I have the clear understanding why Elliott waves is the best tool and why it’s working. Most of traders even don’t understand that chart patterns is just the special case of Elliott waves. That’s why today I decided to explain you how you can change the first one to the second one. Let’s go!
Double Top(Bottom)
On the chart above I drew the different types of double tops. Generally we have 3 types of this pattern
Double top with the second top higher than the first one. In this case we can interpret it in two ways. It could be the classical waves 3, 4, 5 and the corrective wave A at the ending stage. In this case we can anticipate waves B and C. Also it could be the irregular correcton ABC inside wave 4 (rarely in wave 2). In this case we should wait for the wave 5 after that. Traders usually execute short position on the neckline breakdown and suffer when the wave 5 smashed their stop-loss. They are wondering why double top does not working.
Double top with the equal highs has the same possible outcomes. The only one difference that correction called flat instead of irregular.
Double top with the second top lower than the first one. Here is the most common variant is the end of the ABC correction. In this case we have the low potential for shorting the market becuase the new impulsive wave to the upside can hit all stop losses.
Head & Shoulders
This is the easiest pattern for analysis. The right sholder usually is the wave 4, the head, obviously is the wave 5 and the right shoulder is the wave B. On the neckline breakdown we have the shorting potential only in the rest part of the wave C. You could correctly count waves and short that the bearish reversal bar of the wave 5 or, as a last resort, at wave B potential top. Shorting at the neckline has sence only if you are sure that the wave B was the the wave 1 of the impulsive wave to the downside if higher degree and now the market is in wave 3. We have to learn how to count waves in a correct way. I would recommend you to read the Trading Chaos book by Bill Williams because it has the best explanation how do waves work.
Triangles and Wedges
This part is common for all types of triangles (ascending, descending, symmetrical) and wedges (falling and rising). This patterns have the similar structure. If we faced with one of these patterns we have 4 possible scenarios.
Triangle in the downtrend after the wave 3. In this case triangle is the wave 4, which is represented as the triangle correction. This correction type consists of 5 waves A, B, C, D and E. When the wave E is finished market will continue it’s move in the direction of a trend, printing the wave 5.
The same, but in the uptrend.
When the market showed us the 5 waves cycle to the upside and the correction is in progress. Triangle can appears in the wave B. In this case the price will continue the corrective move in the wave C after it’s finished.
The same with the downtrend.
Guys, of course there are much more types of chart patterns. For example, tripple tops and bottoms and so on. The purpose of this article is giving you another view of the market structure and to motivate you studying the Elliott waves theory. Believe me, it has much more potential than it seems on the first glimplse.
Best regards, Ivan
________________________________________________________________________________________________
If you like my educational ideas, please smash the boost button to stimulate me make more quality articles!

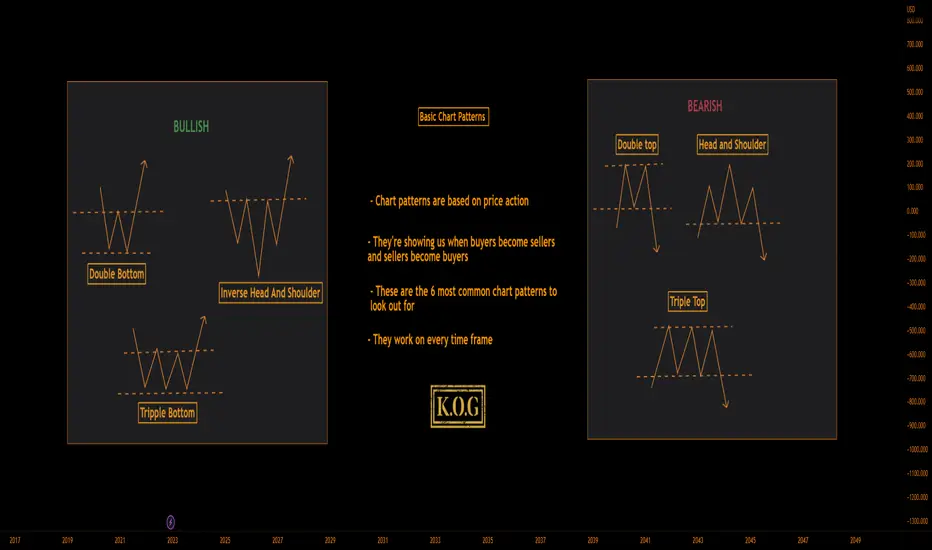
KOG - BASIC CHART PATTERNSThe plan was to do a series of posts on popular chart patterns as well as advanced chart patterns we use in Camelot. We did this earlier in the year so we're sharing it again, also as a reminder for us to continue with this in the new year as a series of educational posts to help traders in their day to day trading. There are many ways to trade patterns, structures, support and resistance levels, we're showing you how we do it.
Followers of KOG will know we are technical traders so we are always looking out for candlestick and chart patterns as part of our trading plans and analyses.
These are what we feel the 6 most common and basic chart patterns that you will find almost daily on the smaller time frames. During the course of this series we will look at each and everyone in more detail and give you live examples of how they work.
TIP: When trading chart patterns its always best to wait for the neckline of the pattern to break, this confirms the movement in the chosen direction. Chart patters also work best at key levels of support and resistance and at the top or bottom of trends. For example, if you see the price is at the top of the trend and a Head and Shoulders pattern is forming, this is the first sign of a reversal on price.
1) Always wait for the pattern to form and ensure its clear!
2) Wait for the break of the neckline
3) Breakouts usually occur with aggressive candles that are volume driven
4) Your first target should always be the nearest KEY support or resistance level, this ensures some profit is locked in and this is where you take a majority of the trade off the table, then leave a small runner for your target area
5) In most cases you will get a retest of the neckline, this is usually the best entry
Chart patterns are helpful in determining the direction of the instrument and most are reliable. When markets are ranging or we are in pre-event price action, for example before FOMC or NFP, you need to remain cautious when trading patterns. During these market environments you will likely see contradicting patterns as well as patterns inside patterns so know when to trade patterns and when not to!
Hope this helps traders.
As always, trade safe.
KOG
REVERSAL AND CONTINUATION PATTERNS ⚡️Chart patterns are visual representations of price action. Chart patterns can show trading ranges, swings, trends, and reversals in price action. The signal for buying and selling a chart pattern is usually a trend line breakout in one direction showing support or resistance is overcome at a key level. Stop losses are usually set on retracement back inside the previous range and profit targets are usually set based on the magnitude of the previous move leading into the pattern.
Many people think of chart patterns as bullish or bearish but there are really three main types of chart pattern groups: reversal chart patterns, continuation chart patterns, and bilateral chart patterns. Understanding the differences is important for traders to understand the path of least resistance on a specific chart based on the primary sentiment of the buyers and sellers price action.
Well in this article we will discuss the Reversal chart patterns and the Continuation chart patterns.
Reversal chart patterns
Reversal patterns happen when a chart has a strong break from its current trend and its momentum reverses course. These patterns show that a trend is coming to an end and the price action is moving in a new direction away from the previous range or direction. These patterns go from bullish to bearish or bearish to bullish. They can take longer to develop than other types of chart patterns.
Now I'll show you how the 3 Bullish and Bearish patterns shown in the picture in this Education post.
Double TOP and BOTTOM:
Well for this first pair of patterns, I have already made a very nice and detailed explanation here in Tradingview, follow the link :)
Click Below in the picture.
Head & Shoulder and Reversal H&S
A head and shoulders pattern used in technical analysis is a specific chart formation that predicts a bullish-to-bearish trend reversal. The pattern appears as a baseline with three peaks, where the outside two are close in height, and the middle is the highest.
The head and shoulders pattern forms when a stock's price rises to a peak and then declines back to the base of the prior up-move. Then, the price rises above the previous peak to form the "head" and then declines back to the original base. Finally, the stock price peaks again at about the level of the first peak of the formation before falling back down.
The head and shoulders pattern is considered one of the most reliable trend reversal patterns. It is one of several top patterns that signal, with varying degrees of accuracy, that an upward trend is nearing its end and vice versa.
and Viceversa the reversal will look like this
Reversal Rising Wedge and Falling Wedge
A wedge pattern can signal either bullish or bearish price reversals. In either case, this pattern holds three common characteristics: first, the converging trend lines; second, a pattern of declining volume as the price progresses through the pattern; third, a breakout from one of the trend lines. The two forms of the wedge pattern are a rising wedge (which signals a bearish reversal) and a falling wedge (which signals a bullish reversal).
Rising Wedge
This usually occurs when a security’s price has been rising over time, but it can also occur in the midst of a downward trend as well.
Falling Wedge
Continuation chart patterns
Continuation patterns signal that the current trend is still in place and it’s about to resume going in the same direction after a trading range has formed. These types of patterns usually form consolidations in price action to let buyers and sellers work through supply and demand before moving higher or lower like the previous trend leading into the range. These are the most popular classic bearish and bullish chart patterns.
Continuation Falling Wedge
The falling wedge pattern is a continuation pattern formed when the price bounces between two downward-sloping, converging trendlines. It will follow the impulse trend, so a Bullish trend will continue in the uptrend and Vice-versa for il downtrend.
And Vice versa the Rising Wedge
The Bullish and the Bearish Rectangle
A rectangle is a pattern that occurs on price charts. A rectangle is formed when the price reaches the same horizontal support and resistance levels multiple times. The price is confined to moving between the two horizontal levels, creating a rectangle.
Bullish Rectangle
Bearish Rectangle:
Bullish and Bearish Pennant
In technical analysis, a pennant is a type of continuation pattern formed when there is a large movement in a security, known as the flagpole, followed by a consolidation period with converging trend lines "the pennant" followed by a breakout movement in the same direction as the initial large movement, which represents the second half of the flagpole.
Some examples:
Hope this post will help you to understand the difference between some examples of the most common reversal and continuation patterns.

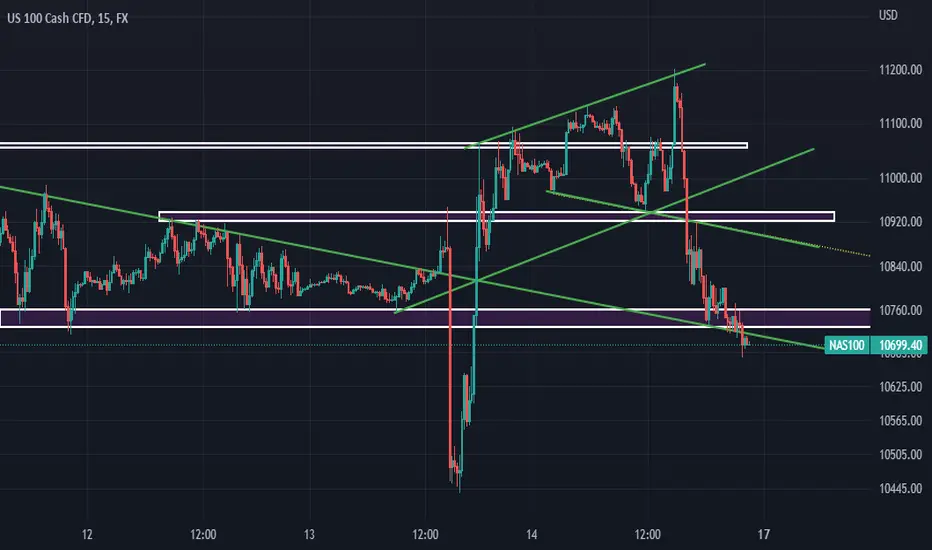
NAS100 CONSOLIDATION TRADE 1hour/30 minutes, there are many visible/ trustworthy moves in there..
Every move in 15mnts?1hour/30 minutes influences the whole day chart
So check for every move IN 1hour/30-minutes TF(draw trendlines and analyze the every move the market makes in the 1hour/30 minutes TF)
Trust ME
So for every move made in 30 minutes you take(provided move perfect AF)
i realized today that you have to stick to your stratergy and timeframe youre best at... please take note, and be patient with yourself. stick to what youre best at, this analysis was made a day after trading on the 4 hour chart. wasn't a profitable day/ week trading on the 4 hourly chart...
Learn How to Trade Head & Shoulders Pattern | Full Guide 📚
Learn my step-by-step guide for Head & Shoulders pattern trading.
This video includes important theory and real market examples.
❤️Please, support this video with like and comment!❤️

Position Size Calculation - Example 11. INPUT
PE = Capital($) = 1000
RP = Risk (%) = 2 %
EP = Entry Price = 1719.78
XP = Exit Price = 1733.75
2. OUTPUT (Goal)
PS = Position Size = ?
LEV = Leverage = ?
IM = Initial Margin = ?
3. CALCULATION
RD = Risk ($) = 1000 * (0.02) = 20
SLD = |EP - XP| = |1719.78 - 1733.75| = 13.97
SLP = Stop Loss (%) = (SLD / EP) = (13.97 / 1719.78) = 0.0081
PS = Position Size ($) = RD / SLP = 20 / 0.0081 = 2469.13
CPV = Current Price Value = EP = 1719.78
QNT = Quantity = PS / CPV = 2469.13 / 1719.78 = Roundup(1.435) = 2
4. Assumption and Final Calculation
LEV = {3, 5, 10, 20}
IM = PS / LEV = 2469.13 / {3, 5, 10, 20} = {823.04, 493.826, 246.913, 123.4565}

HEAD & SHOULDER AND INVERSE HEAD & SHOULDER In this tutorial, we go in-depth explaining the head and shoulder & the inverse head and shoulder patterns.
Comment your thoughts, like and share 🙂

shake-n-bake fractalThis is just your typical head and shoulders pattern, but when a range is so tight, you'll just see one after the other after the other. It's pretty bizarre. I'm declaring this fractal as a "shake-n-bake" pattern where h&s leads right into another h&s of equal size and volatility

CL1! - How I approach my analysisA Trader asked me, if I could show how I approach my analysis. And this is what this Video is about.
At the end we even have a potential trade and definitely a chart to observe.
What you will see is:
- the big picture
- swings
- Andrews Pitchfork
- the sine-wave pattern
...and even the classic Head & Shoulder, which reveille where the meat is.
Let's start...

Head and ShoulderYou probably heard of the Head and Shoulders chart pattern. There are two versions of the 'Head and Shoulders' in the markets. The pattern that resembles a human figure standing upright is the BEARISH version where we would like to see SELLS in the market.
The pattern that resembles a Human figure hanging upside-down is called the "Inverted Head and Shoulders" pattern where we would like to see BUYS in the market.
In this chart example, we have the Bearish version. The head (where the face is located) is often times classified as the stop hunt where liquidity is established. The stop hunt liquidity is where retail buyers are trapped.
An optimal entry for this pattern would be on the right shoulder (located on right side of your screen) with first targets aim at the neckline or beyond.
