Hellena | GOLD (4H): LONG to resistance 5200.Since the movement continues and clearly shows no signs of reversing, I had to slightly revise the wave count, and it looks as if the impulse has been extended.
This means that the higher-order wave “3” has just ended or will end soon.
This means that wave “5” is not over yet and we should expect another update of the maximum.
I expect the gap at 4984.97 to be closed, after which I expect the rather important and strong level of 5200 to be reached.
Alternatively, wave “3” has not yet ended and should be expected at the same level of 5200.
Manage your capital correctly and competently! Only enter trades based on reliable patterns!
Community ideas

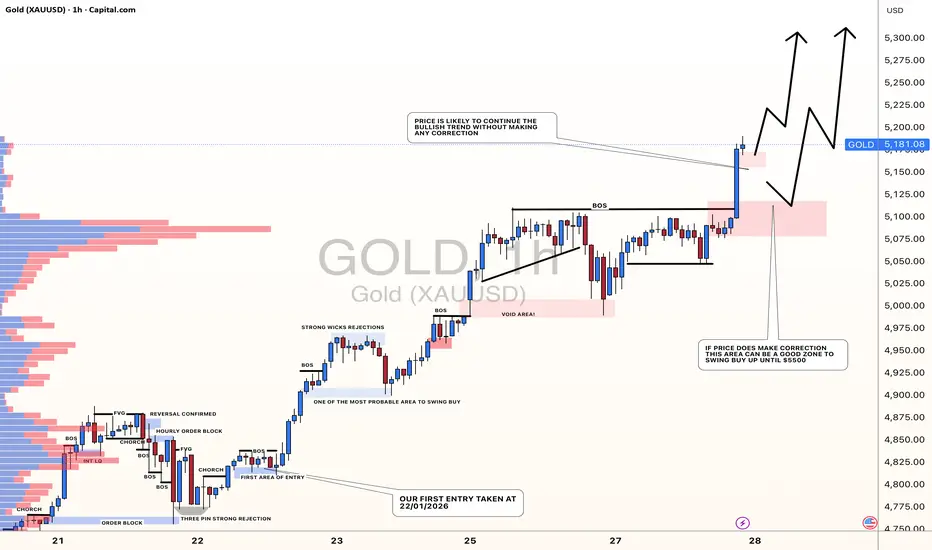
GOLD: Detailed View, Is Price Heading Towards $5500?Gold overview!
After the price built up, we're seeing a strong bullish move. Our earlier analysis today didn't quite work out, but this one points to two key areas where the price might turn around. The first zone is probably the better entry, since the market will open with a gap up and fill it before moving on. A profit target of $5500 looks pretty good.
If you like what we do, please hit like and leave a comment on this idea. And follow us to get updates on new ideas like this one.
Team Setupsfx_
Bitcoin - Must see, bear flag target 42k in 2026!Bitcoin is forming a huge bearish flag on the daily/weekly chart! This is an extremely good pattern for all bears around, but for the bulls, it's indeed not that good because the classic profit target of this pattern is 42k (by classical technical analysis of a bear flag pattern). How to measure the profit target? I did it for you on the chart, but you take the flagpole, copy it, and move it to the breakout point of the flag. But of course we are not going to go down in a straight line!
There is a minor support of 71k that can temporarily hold the price, so if you want to trade, really take profit after a few days. 42k is the main target of this bear flag, and I expect that bitcoin can reach this level at around September to October 2026. This should be the ultimate bottom for Bitcoin, so if you want to buy very cheap Bitcoin, this is pretty much your chance. But for now we are waiting for Bitcoin to hit this level.
In order to understand why in September or October, please take a look at my previous important analysis:
What about price action in the short term? Bitcoin can go up in the short term because there is some interesting price action on the 1h chart, but this is really not the point of this analysis. This is an analysis on the daily chart, and in this timeframe, I am of course bearish. But in the short term, Bitcoin can test levels of 91k - 93k before dropping down!
Write a comment with your altcoin + hit the like button, and I will make an analysis for you in response. Trading is not hard if you have a good coach! I am very transparent with my trades. Thank you, and I wish you successful trades!

GOLD - Correction ahead of the Fed meeting. What next?FX:XAUUSD hit a new high of 5311 and entered a correction phase (profit-taking) ahead of the Fed's interest rate meeting...
Fundamental situation
Tensions between the US and NATO over plans for Greenland. Trump's threats to impose 100% tariffs on goods from Canada. Fruitless negotiations between Russia and Ukraine
Fed:
Expectations that rates will remain unchanged at the January 31 meeting. Powell's tone and the appointment of a new Fed chair (announcement possible today) could increase volatility. However, the market is pricing in two Fed rate cuts in 2026, despite a possible pause in the near term.
US consumer confidence index fell to an 11.5-year low (84.5), supporting demand for gold
Resistance levels: 5285, 5310, 5350
Support levels: 5250, 5230, 5190
Gold maintains its upward momentum thanks to geopolitical risks and expectations of a soft Fed policy. However, news volatility could trigger a correction before the growth continues. Focus on key (marked) support levels.
Best regards, R. Linda!

Gold Price Intraday Analysis – Key Resistance and Support LevelsThis chart provides an intraday analysis of gold prices, highlighting critical levels for potential price action. Key zones include Trendline Resistance at 5,108.974, a Minor Resistance at 5,077.929, and a Support Zone at 5,040.216, where price could potentially bounce. The Key Support Level at 4,980.813 offers a strong buying opportunity, while the Final Target at 4,837.129 marks the expected bottom for the downtrend. Traders should monitor these levels for price reactions and plan entries accordingly.

EURUSD 3M CLS range - I Potential high of the yearWe have seen last six months of consolidation, recently in the COT data we could see 10 years extreme long positions and since then the longs been closed and shorts are growing which suggest that market makers has been preparing for this manipulation. As predicted in this previous idea. Now above 1.2 - Institutional level market makers are closing longs and building and adding shorts. Once the price closes back in the 3M CLS range we could potentially see a big sell off.
There is FOMC tonight which is perfect moment for the reversal.
I promised myself I’d become the person I once needed the most as a beginner. Below are links to a powerful lessons I shared on Tradingview. Hope it can help you avoid years of trial and error I went thru.
📊 Sharpen your trading Strategy
⚙️ 100% Mechanical System - Complete Strategy
🔁 Daily Bias – Continuation
🔄 Daily Bias – Reversal
🧱 Key Level – Order Block
📉 How to Buy Lows and Sell Highs
🎯 Dealing Range – Enter on pullbacks
💧 Liquidity – Basics to understand
🕒 Timeframe Alignments
🚫 Market Narratives – Avoid traps
🐢 Turtle Soup Master – High reward method
🧘 How to stop overcomplicating trading
🕰️ Day Trading Cheat Code – Sessions
🇬🇧 London Session Trading
🔍 SMT Divergence – Secret Smart Money signal
📐 Standard Deviations – Predict future targets
🎣 Stop Hunt Trading
💧 Liquidity Sweep Mastery
🔪 Asia Session Setups
📀 Gold Strategy
🧠 Level Up & Mindset
🛕 Monk Mode – Transition from 9–5 to full-time trading
⚠️ Trading Enemies – Habits that destroy success
🔄 Trader’s Routine – Build discipline daily
💪 Get Funded - $20 000 Monthly Plan
🧪 Winning Trading Plan
⭕ Backtesting vs Reality
🛡️ Risk Management
🏦 Risk Management for Prop Trading
📏 Risk in % or Fixed Position Size
🔐 Risk Per Trade – Keep consistency
🧪 Risk Reward vs Win Ratio
💎 Catch High Risk Reward Setups
☯️ Smart Money - Who control Markets
Adapt useful, Reject useless and add what is specifically yours.
David Perk

Bitcoin Descending Channel Signals Further Downside To $86,100Hello traders! Here’s my technical outlook on BTCUSD (4H) based on the current chart structure. BTCUSDT initially traded inside a well-defined range, reflecting a prolonged period of balance between buyers and sellers. This consolidation phase ended with a clean upside breakout, signaling a shift in market control toward buyers. After the breakout, price entered a structured ascending channel, confirming a bullish phase with higher highs and higher lows. During this advance, Bitcoin respected the rising support line and showed strong impulsive moves, highlighting sustained buyer strength. As price approached the upper boundary of the ascending channel, multiple fake breakouts appeared near the resistance line, indicating growing exhaustion at the highs. Eventually, BTC failed to maintain acceptance above the channel resistance and experienced a breakdown below the channel, confirming a loss of bullish momentum and a structural shift. Following this breakdown, price moved lower and formed a descending channel, signaling short-term bearish control. Attempts to recover were capped by the descending resistance line, and several breakout attempts above this line were rejected, reinforcing seller dominance. A key Resistance / Seller Zone around 89,000 acted as a strong supply area, where previous support flipped into resistance after the breakdown. Currently, BTCUSDT is trading within the descending channel and moving toward a clearly defined Buyer Zone / Support area around 86,100, which aligns with a broader horizontal support and a rising long-term support line. This confluence strengthens the level and makes it a critical reaction zone. The recent price action suggests continuation to the downside rather than accumulation, with bearish momentum still in control. My scenario: as long as BTCUSDT remains below the 89,000 Resistance / Seller Zone and continues to respect the descending channel structure, the bearish bias remains valid. I expect sellers to push price toward the 86,100 Support / Buyer Zone (TP1). A strong reaction or temporary bounce may occur there, but a clean breakdown and acceptance below this support would open the door for further downside continuation. A confirmed breakout and acceptance back above 89,000 would invalidate the short scenario and suggest a shift toward consolidation or recovery. For now, market structure clearly favors sellers, with downside continuation as the primary scenario. Please share this idea with your friends and click Boost 🚀

XAUUSD Long: Consolidation Before the Next Impulsive MoveHello traders! Here’s a clear technical breakdown of XAUUSD (1H) based on the current chart structure. Gold is trading within a strong and well-defined ascending channel, confirming a sustained bullish trend supported by consistent higher highs and higher lows. This structure reflects strong buyer dominance and healthy trend conditions rather than an overextended or exhausted move. Prior to the impulsive rally, price spent a prolonged period consolidating within a range, indicating accumulation and balance between buyers and sellers. This range eventually resolved to the upside, triggering a clean breakout and initiating a strong bullish impulse that pushed price firmly into the ascending channel.
Currently, Gold is pulling back toward a strong Demand Zone around 4,990–5,010, which aligns closely with the lower boundary and midline of the ascending channel. This confluence between horizontal demand and dynamic channel support significantly strengthens the level. The pullback so far appears corrective, with price showing stabilization and buyer reactions near demand, indicating that sellers are losing momentum while buyers continue to defend the broader bullish structure.
My scenario: as long as XAUUSD holds above the demand zone and continues to respect the ascending channel, the bullish structure remains intact. A sustained reaction from this demand area could lead to another bullish leg targeting the 5,150 Supply Zone (TP1). A clean breakout and acceptance above this supply would confirm trend continuation and open the door for further upside expansion within the channel. However, a decisive breakdown and acceptance below the demand zone and channel support would invalidate the bullish bias and signal a deeper corrective phase. For now, structure, trend, and price action continue to favor buyers. Manage your risk!

TSLA Catalysts Ranking | Q1 2026 Update | by ProjectSyndicateTSLA: Updated Outlook Jan 2026 — Catalyst Memo
Updated Catalyst Scorecard Ranked by Impact
1 🤖 Autonomous and Robotaxi Execution — 9.4
2 🧱 Energy AI and Optimus Optionality — 9.0
3 🏭 EV Demand and Geographic Mix — 7.8
4 🧮 Battery Cost and Margin Levers — 7.6
5 🗃️ Affordable Model and Next Gen Platform — 7.4
6 ⛓️ Competition and Global Share — 6.7
7 🧭 Macro Trade and Policy — 6.6
8 📉 Rates and Credit Conditions — 6.1
9 🧾 US EV Incentives and Pull Forward — 5.2
10 🧪 Commodities and Inputs — 5.1
11 🛡️ Safety Regulatory and Governance Risk — 8.2 risk flag
________________________________________
Primary Catalyst Stack Updated Scores
🤖 1 Autonomous and Robotaxi Execution — 9.4 out of 10 up
• What changed: Market reporting indicates robotaxi operations in Austin have progressed toward a less supervised operating format, strengthening the commercialization timeline signal.
• Key upside path: Expansion to additional geographies, measurable safety performance, and a clearer unit economics narrative.
• Primary risk: Regulatory intervention, operating restrictions, or a high profile incident that forces program throttling.
• Why higher: This is the clearest pathway to a structural multiple reset and remains the dominant driver of incremental investor positioning.
________________________________________
🧱 2 Energy AI and Optimus Optionality — 9.0 out of 10 up
• What changed: Energy storage deployments remain the most consistently constructive datapoint with rising investor focus on backlog visibility and margin trajectory.
• Key upside path: Sustained deployments growth plus improving profitability, positioning Energy as a second earnings engine rather than a cyclical adjunct.
• Primary risk: Supply chain constraints, project timing volatility, margin normalization if pricing tightens.
• Why higher: Energy plus AI infrastructure adjacency continues to expand the non auto terminal value narrative.
________________________________________
🏭 3 EV Demand and Geographic Mix — 7.8 out of 10 down
• What changed: Deliveries momentum has moderated versus prior year comps, with mix and regional pricing pressure remaining central to earnings power.
• Key upside path: Stabilization in core regions through product refresh cadence, financing support, and disciplined pricing.
• Primary risk: Extended price competition in China and Europe, weaker affordability, inventory driven discounting.
________________________________________
🧮 4 Battery Cost and Margin Levers — 7.6 out of 10 down
• What changed: Margin sensitivity remains elevated given pricing actions, mix shift, and fixed cost absorption.
• Key upside path: Lower bill of materials, manufacturing efficiencies, software attach, and Energy margin expansion.
• Primary risk: Further auto gross margin compression or inability to offset pricing with cost improvements.
________________________________________
🗃️ 5 Affordable Model and Next Gen Platform — 7.4 out of 10 flat
• What changed: The market continues to discount timing uncertainty. Without a defined ramp window, this remains a medium term catalyst rather than a near term driver.
• Key upside path: Clear launch timeline plus credible capacity plan that expands the addressable market.
• Primary risk: Execution delay, demand cannibalization, margin tradeoffs.
________________________________________
🧾 6 US EV Incentives and Pull Forward Dynamics — 5.2 out of 10 down
• What changed: Incentive support is structurally less constructive into 2026, increasing reliance on pricing, financing, and product cadence to drive volume.
• Key upside path: Stronger than expected natural demand, creative financing solutions, improved affordability.
• Primary risk: Air pocket in demand as incentive effects roll off.
________________________________________
📉 7 Rates and Credit Conditions — 6.1 out of 10 flat
• What changed: Financing conditions remain a meaningful second order driver for payment sensitive buyers.
• Key upside path: Easier financing plus improved consumer confidence.
• Primary risk: Sticky rates or tighter underwriting standards.
________________________________________
🧭 8 Macro Trade and Policy — 6.6 out of 10 up
• What changed: Policy remains a swing factor affecting both demand and cost corridors, with tariff and regulatory narratives capable of repricing risk quickly.
• Key upside path: Stable policy environment with limited new frictions.
• Primary risk: Adverse trade moves, tightening regulatory posture, or geopolitical disruptions.
________________________________________
⛓️ 9 Competition and Global Share — 6.7 out of 10 flat
• What changed: Competitive intensity remains high, particularly where local OEMs can compress price points.
• Key upside path: Product refresh leadership plus software differentiation.
• Primary risk: Sustained price war and commoditization pressure.
________________________________________
🛡️ 10 Safety Regulatory and Governance Risk — 8.2 out of 10 risk flag up
• What changed: Autonomy scrutiny remains an active overhang that can change the timeline overnight.
• Key downside path: Restrictions, remedies, reporting burdens, or reputational hits that slow adoption.
• Why elevated: This is the primary left tail against the autonomy bull case.
________________________________________
🧪 11 Commodities and Inputs — 5.1 out of 10 flat
• What changed: Input costs matter, but are not the gating item relative to demand, pricing, and autonomy timelines.
• Key upside path: Lower raw materials supporting margin.
• Primary risk: Sudden spikes that compress profitability.
________________________________________
________________________________________
Analyst positioning and targets
Street posture remains broadly balanced with dispersion widening between autonomy bulls and auto fundamental bears. Into the next earnings cycle, revisions risk is skewed toward fundamentals while multiple sensitivity remains skewed toward autonomy milestones and regulatory developments.
________________________________________
Headlines and tape drivers
• 🤖 Robotaxi commercialization signaling has strengthened
• 🧱 Energy deployments remain a key positive differentiator
• 🛡️ Regulatory scrutiny remains the principal headline risk
• 🧾 Incentive fade increases reliance on pricing and financing levers
________________________________________
Levels and structure
• 🧊 Support zones 405 to 415 then 380 to 395 then 330 to 350
• 🪨 Resistance zones 450 then 475 to 510 then 600
________________________________________
Next 60 to 90 days watch list
1 🤖 Robotaxi expansion pace, operating design, and safety metrics
2 🛡️ Regulatory milestones and any mandated remedies
3 🧱 Energy profitability commentary and backlog visibility
4 🏭 Pricing actions and demand elasticity post incentive fade

EURUSD: Corrective Pullback After Strong Bullish ImpulseHello everyone, here is my breakdown of the current EURUSD setup.
Market Analysis
EURUSD has been trading within a well-defined upward channel, which reflects a strong bullish structure over the higher timeframe. Price has consistently respected the channel boundaries, forming higher highs and higher lows, confirming that buyers remain in control of the broader trend. Each impulsive leg higher has been followed by corrective pullbacks that stayed contained within the channel, signaling healthy trend behavior rather than trend exhaustion. Recently, the market delivered a strong bullish impulse, breaking above the previous consolidation and pushing decisively higher. This impulsive move confirmed bullish momentum and attracted aggressive buying interest. After the breakout, price reached a key resistance zone around 1.1900, where sellers stepped in and caused a fake breakout above resistance. This failure to hold above the highs signals weakening bullish pressure at premium levels.
Currently, EURUSD started to correct lower, pulling back from resistance while still remaining inside the overall upward channel. Importantly, this decline currently appears corrective rather than impulsive, suggesting profit-taking and short-term seller activity instead of a full trend reversal. The former resistance area around 1.1800 has flipped into a Support Zone, which is now acting as the first key downside target and decision area. As long as price remains above the lower boundary of the channel, the broader bullish structure stays intact. However, the inability to sustain acceptance above resistance increases the probability of a deeper pullback toward support before the next directional move.
My Scenario & Strategy
My primary scenario is a short-term bearish correction within the broader bullish trend. As long as EURUSD trades below the resistance zone near 1.1900 and shows rejection from the upper channel boundary, I expect sellers to maintain control in the short term. The first target for this corrective move is the Support Zone around 1.1800, where buyers previously stepped in aggressively. If price reaches this support area and shows bullish reaction or consolidation, a continuation to the upside would remain the preferred higher-timeframe scenario. A clean bounce from support would confirm that the move lower was only a correction within the uptrend.
However, if EURUSD breaks below the support zone and shows acceptance beneath it, this would signal a deeper correction toward the lower boundary of the ascending channel. Only a decisive breakdown of the channel structure would invalidate the bullish bias and shift the market into a more bearish environment. For now, the setup favors a controlled pullback after a strong impulse, with short-term downside potential toward support while the overall trend structure remains bullish.
That’s the setup I’m tracking. Thank you for your attention, and always manage your risk.

Gold Compressing Near Resistance Ahead of Potential BreakoutHello traders! Here’s my technical outlook on XAUUSD (3H) based on the current chart structure. Gold has been trading in a strong bullish trend, clearly defined by a rising structure that started after a prolonged consolidation phase. Initially, price moved sideways within a well-marked range, signaling market balance and accumulation. This range acted as a base for the next directional move. Once buyers gained control, XAUUSD broke decisively above the range highs, confirming a shift from consolidation to expansion and triggering a strong impulsive rally. Currently, price is approaching the Resistance Level / Seller Zone around the 5,330–5,350 area. Momentum remains bullish, but the market is showing signs of short-term consolidation near the highs, suggesting a pause after the strong impulse. This behavior is typical after vertical moves, as the market digests gains before deciding on continuation or correction. Importantly, price is still holding above the rising support line and above the Buyer Zone, which keeps the bullish bias intact. My scenario: as long as XAUUSD holds above the Buyer Zone around 5,060–5,100 and continues to respect the ascending channel support, I expect a continuation higher toward the Seller Zone near 5,350 (TP1). A brief corrective pullback into support would be a healthy move within the trend and could provide renewed buying interest. A clean breakout and acceptance above the Seller Zone would confirm further upside continuation and open the door for higher targets. However, a strong rejection from the Seller Zone followed by a breakdown below the rising support line and Buyer Zone would signal a deeper corrective phase. For now, the structure, momentum, and price action continue to favor buyers, with the current consolidation appearing as preparation for the next move, not a reversal. Please share this idea with your friends and click Boost 🚀

BITCOIN isn't diverging from 2022 at all!Bitcoin (BTCUSD) continues to replicate the 2022 Bear Cycle almost in the exact same fashion. This is of course a concept we introduced back in October for the first time and so far it has fulfilled all conditions set in its way.
The most recent is the 1D MA100 (green trend-line) rejection, which in 2022 happened on March 02 and after another Support test, BTC rebounded for the final rejection on the 1D MA200 (orange trend-line). As mentioned before, that could be around $100k.
Assuming the 2026 Bear Cycle continues to repeat the 2022 price action, the next Support level should be around $70k, then $51-52k and finally around $45000.
So do you think it will unfold like 2022? Feel free to let us know in the comments section below!
---
** Please LIKE 👍, FOLLOW ✅, SHARE 🙌 and COMMENT ✍ if you enjoy this idea! Also share your ideas and charts in the comments section below! This is best way to keep it relevant, support us, keep the content here free and allow the idea to reach as many people as possible. **
---
💸💸💸💸💸💸
👇 👇 👇 👇 👇 👇

BTCUSD – 30M – Bullish Continuation From SupportBITSTAMP:BTCUSD
After sweeping liquidity from the lower demand zone, BTC shifted momentum bullish and pushed toward the 90,700–91,000 resistance zone. Price is now retracing into prior support, suggesting a potential continuation if buyers defend the level.
Key Scenarios
✅ Bullish Case 🚀 → Hold above 88,500 with bullish reaction
🎯 Target 1: 90,700 – 91,000
🎯 Target 2: 91,800 – 92,200
❌ Bearish Case 📉 → Clean breakdown below 88,500
A loss of structure opens downside toward 86,300 demand, invalidating the bullish setup.
Current Levels to Watch
Resistance 🔴: 90,700 – 91,000
Support 🟢: 88,500 / 86,300
⚠️ Disclaimer: This analysis is for educational purposes only. It is not financial advice. Please do your own research before trading.

XAUUSD: at Key Resistance - Pullback Scenario in Focus To $5,400Hello everyone, here is my breakdown of the current XAUUSD setup.
Market Analysis
XAUUSD is trading within a broader bullish structure that previously developed inside a well-defined upward channel. After a prolonged consolidation phase marked by a clear range, price broke to the upside, confirming buyer control and initiating a strong impulsive rally. This breakout from the range acted as a key structural shift, pushing gold into an accelerated bullish phase supported by higher highs and higher lows within the ascending channel. As price continued higher, XAUUSD approached a major higher-timeframe Resistance Zone around the 5,580–5,600 area. This zone has historically acted as a strong supply region, and current price action suggests that bullish momentum is starting to weaken near this level. The market is now showing signs of overextension after a near-vertical move, increasing the probability of a corrective pullback. Importantly, price is currently trading at the upper boundary of the ascending channel, where buyers often begin to take profits and sellers look for short-term opportunities.
Currently, a clearly defined Support Zone around the 5,380–5,420 area aligns with the prior breakout level and the upper boundary of the former consolidation. This zone represents a key area of interest, as it previously acted as resistance before being broken and now serves as potential support. The structure suggests that a pullback into this zone would be a healthy correction rather than a trend reversal.
My Scenario & Strategy
My primary scenario is a short-term corrective pullback from the Resistance Zone toward the Support Zone. As long as price remains capped below the 5,600 resistance and shows rejection from the upper channel boundary, I expect a move lower toward the 5,400 support area (TP1). This short idea is counter-trend and should be treated strictly as a corrective trade within a broader bullish market structure. A clean reaction into the Support Zone could attract fresh buyers and potentially lead to trend continuation afterward.
However, if price fails to find support and breaks decisively below the 5,380 level with strong bearish acceptance, a deeper correction toward the lower channel boundary would become more likely. On the other hand, a strong breakout and acceptance above the 5,600 Resistance Zone would invalidate the short scenario and signal bullish continuation. For now, price is at a critical reaction area where a pullback is technically justified.
That’s the setup I’m tracking. Thank you for your attention, and always manage your risk.

Silver XAG/USD - Breakout + Retest Signals Upside Continuation📝 Description🔍 Setup (Market Structure) FX:XAGUSD
XAG/USD is forming a well-defined Triangle Breakout pattern on the M30 timeframe.
After a strong bullish move, price consolidated with lower highs and higher lows, compressing volatility — a classic sign of an upcoming expansion.
Price has now broken above the triangle resistance and is showing a healthy breakout & retest, supported by EMA and holding above the structure.
This favors a bullish continuation scenario.
📍 Support & Resistance
🟨 Support Zone: 104.70 – 106.00
🟢 1st Resistance: 123.90
🟢 2nd Resistance: 130.00 – 130.20
⚠️ Disclaimer
This analysis is for educational purposes only.
Commodities are volatile — always use proper risk management and position sizing.
💬 Support the Idea👍 Like if you’re bullish on Silver
💬 Comment: Clean breakout or fake move?🔁 Share with traders watching XAG/USD
#XAGUSD #Silver #CommodityTrading #TriangleBreakout #PriceAction #TechnicalAnalysis #TradingView #Kabhi_TA_Trading

Gold - Preparing the final blow off top!💰Gold ( OANDA:XAUUSD ) will rally a final +20%:
🔎Analysis summary:
Just in January alone, Gold is up another +25% so far. Looking at this very bullish parabolic rally, Gold remains super strong and is still not done with the bullrun. Until Gold retests the ultimate resistance trendline, it can easily rally another +20% from the current levels.
📝Levels to watch:
$6,000
SwingTraderPhil
SwingTrading.Simplified. | Investing.Simplified. | #LONGTERMVISION

Lingrid | GOLD Continued Bullish Momentum in MarketOANDA:XAUUSD perfectly played out my previous trading idea . Price remains firmly bid after defending the rising trendline and printing another sequence of higher lows within the ascending channel. The recent push above the 5,200 area confirms sustained demand, while momentum continues to build rather than fade. Price action suggests strength, not exhaustion, as buyers keep stepping in on shallow pullbacks.
If the market holds above the rising support band, TVC:GOLD could grind higher toward the 5,500 psychological level, where the upper channel resistance comes into play. Any short-term dip toward trend support may attract fresh demand rather than trigger distribution.
➡️ Primary scenario: continuation above 5,135 → advance toward 5,500.
⚠️ Risk scenario: a decisive breakdown below the rising trendline could delay upside and expose a deeper consolidation.
If this idea resonates with you or you have your own opinion, traders, hit the comments. I’m excited to read your thoughts!

GOLD Defies Logic as Market Awaits the Next MoveGOLD Defies Logic as Market Awaits the Next Move
After the Davos meeting on January 21, GOLD did not react to Trump’s comments. Still, the price jumped almost +5.8%, rising from 4800 to 5110 with no clear reason.
I believe a larger correction is needed. I expected GOLD to start a downward move around 5000, but as you can see, it is not reacting to this strong psychological level, which is very unusual.
Now there are reports that Trump may be preparing an attack on Iran. It is possible that some market participants knew this news in advance, which could explain this sudden and aggressive rise.
At the moment, GOLD looks like it is consolidating before another move higher. A healthy scenario would be a retest of 5000 before continuing upward, as shown on the chart.
However, if GOLD moves above the blue box before any pullback, the bullish scenario becomes stronger. In that case, prices could reach 5200–5250 quite easily. For this to happen, a strong or hidden catalyst would be needed, similar to what we may have seen recently.
Only Trump and his company know the news in advance and are creating the moves to make money.
You may find more details in the chart.
Thank you and good luck! 🍀
❤️ If this analysis helps your trading day, please support it with a like or comment ❤️
✅PS: Be careful of the previous analysis. Everything can happen as I also explained earlier.

ETH : Bulls Regaining Control?ETH : Bulls Regaining Control?
Ethereum experienced a strong bullish impulse, followed by a small correction.
This structure looks like a classic bullish reversal pattern, and ETH is likely to resume the bullish trend again.
Price has now broken above the pattern, which is an important bullish signal. As long as ETH holds above this breakout area, the probability increases for a continuation to the upside.
The first upside target is the 3,160 area, which previously acted as a key structure zone.
If bullish momentum continues, ETH could extend higher toward the 3,350 level, where strong resistance is expected.
Key Levels:
3,160
3,350
You may find more details in the chart.
Thank you and good luck! 🍀
❤️ If this analysis helps your trading day, please support it with a like or comment ❤️

Gold Outlook – Bullish Consolidation with Key Levels in FocusGold remains in a bullish consolidation phase, though repeated attempts near today’s record highs have struggled to hold above the 5200 area.
Early Wednesday, gold sliced through 5300 and continued higher following a sharp 3% surge in the previous session, extending a parabolic rally driven by rising risk aversion. The move was further supported by a weaker US dollar, which slid toward four-year lows, boosting investor demand on the upside.
Tecnically price maintains bullish momentum and reclaims 5300, upside targets sit around 5318 / 5358 if the price does not growth f price fails to react positively around 5300, we could see a downside move, with a broader pullback zone toward 5230 – 5190.
You may find more details in the chart,
Trade wisely best of Luck Buddies.
Ps; Support with like and comments for better analysis Thanks for Supporting.

NQ Short (01-28-26)Fed Day and the stage is set for a decent drop test or rip lower. As usual I may be 1 day or so early with the Short call (yesterday), staying with it today. What to look at is how/when we got here. Mostly O/N after narrow sideways PA in the Reg (not normal or strange Bull). Why so much in the off session? The NQ Contract has 15 times the buying power vs QQQ ETF, this may explain the use to prop (up only in O/N) the NAZ or pave the way higher. The chart below will show the Reg Only session (left) and both sessions (right).
Regarding the Post, we could be looking at a Double Top False Breakout of the Triangle to a Rip Lower or Breakout with White arrow into upper channel, above the Orange TL (started in 10/22).

XAUUSD (Gold) – 30M Trendline Support & Breakout ContinuationPrice is holding above the rising trendline and support zone, forming a bullish continuation structure. A successful hold or breakout above the range opens the path toward higher targets.
Immediate Support: 4960 – 4975
Range High / Resistance: 4985 – 4990
First Target: 5025 – 5045
Extended Target: 5070 – 5100
Bullish bias remains valid above trendline support. Look for retest confirmation or clean breakout before entries and manage risk accordingly.

USDCAD Weekly Reversal Confirmed as Key Structure BreaksUSDCAD Weekly Reversal Confirmed as Key Structure Breaks
USDCAD broke out of a weekly Head and Shoulders pattern. Overall it is a very ugly reversal pattern. However, the most interesting area here is the weekly structure that was broken out.
Today we have the FOMC and Bank of Canada Interest rate decision, and the price could be volatile. Both are very important.
It is possible that USDCAD could test the broken pattern near 1.3650 before dropping further to 1.3450 and 1.3250.
You may find more details in the chart.
Thank you and good luck! 🍀
❤️ If this analysis helps your trading day, please support it with a like or comment ❤️
