BITCOIN Breakout Confirmed - Is $106K the Next Stop?COINBASE:BTCUSD is displaying strong bullish momentum after breaking decisively above the key $90,000 level. This breakout occurred after a well-defined double bottom formed around the major support zone near $74,000. The inability to create a new low and the sharp rejection from that zone confirmed strong buyer presence and marked a clear exhaustion of sellers.
The market is now following through with a solid bullish impulse, pushing past intermediate resistance and confirming the continuation of the ascending channel structure. With buyers stepping in aggressively and price respecting bullish market structure, Bitcoin now appears poised to reach the next significant resistance zone around $106,000, which also aligns with a big resistance level.
From a fundamental perspective, Bitcoin is gaining strength due to several key macroeconomic shifts. The recent escalation of trade tariffs by the Trump administration has heightened economic uncertainty, driving investors to seek alternative assets outside traditional markets. Historically, Bitcoin has thrived during such periods of instability, acting as a hedge against fiat volatility and centralized policy manipulation.
Adding to this backdrop, global central banks continue tightening monetary policy, increasing fears of a recession. As inflation remains sticky and growth slows, capital is flowing into assets with limited supply and no centralized control, reinforcing Bitcoin’s position as digital gold.
Meanwhile, institutional adoption continues to climb. Spot market activity is increasing, and institutional investment vehicles are seeing significant inflows. Improvements in regulatory clarity and market infrastructure are reducing barriers, allowing larger players to participate confidently. This deepening institutional interest is providing a strong foundation for sustained price movement toward $106,000.
The convergence of powerful technical patterns, especially the confirmed breakout and continuation within the ascending channel, along with strong macro and institutional support, points to a likely continuation of Bitcoin’s upside momentum.
Traders should closely monitor confirmation signals, such as bullish volume surges, strong candle closures above the $90,000 breakout level, and continuation patterns forming on lower timeframes to validate this scenario.
Feel free to share your thoughts or add further insights into this analysis!
1-BTCUSD

SPY/QQQ Plan Your Trade For 4-25 : Inside Breakaway patternToday's Pattern is an Inside Breakaway pattern. I suggest this pattern could play a pivotal role in how the markets setup for the May 2 Major Bottom pattern I'm expecting.
You'll see in this video how any move to the upside could present a broadening of the consolidation range - resulting in even bigger price volatility going forward.
Yet, I believe the markets will stall and roll a bit downward/sideways today. Possibly resulting in a move back into the lower consolidation range as we ROLL off resistance.
As I suggested last weekend, I see no reason to assume the markets are "cleared for take-off" yet. Tariffs and political concerns are still driving uncertainty.
I think we are seeing Q1 earnings inflate the markets while the fundamental elements of the global markets are still somewhat unsettled.
I urge traders to HEDGE any open trades going into this weekend. If the markets don't make any clear moves today, hedge any positions you hold into next week.
Gold & Silver are showing signs of minor panic selling. I see that as traders wanting to retest the $3300/$33 levels for Gold/Silver.
I still believe Gold/Silver will skyrocket higher. But, probably not going to happen today.
BTCUSD is making an interesting move higher. Potentially invalidating the previous EPP pattern and/or setting up a very broad consolidation range.
It will be interesting to see how BTCUSD continues to trend over the next few months.
Remember, I'm hopefully helping all of you find ways to improve your trading and find better results.
Get some..
#trading #research #investing #tradingalgos #tradingsignals #cycles #fibonacci #elliotwave #modelingsystems #stocks #bitcoin #btcusd #cryptos #spy #gold #nq #investing #trading #spytrading #spymarket #tradingmarket #stockmarket #silver

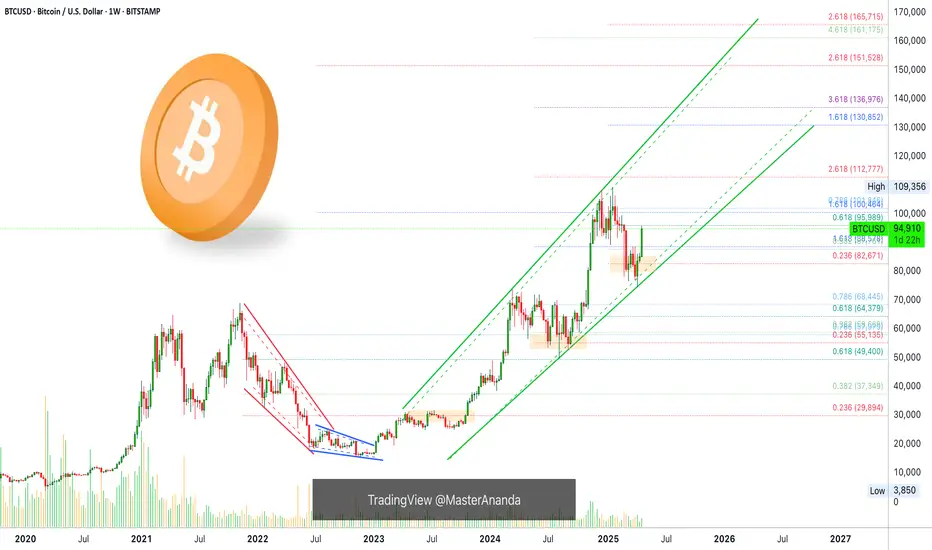
BITCOIN $140k will come sooner than you think!Bitcoin (BTCUSD) eventually made the strong rebound we've been talking about on the highly important Support cluster of: a) the 1W MA50 (blue trend-line), b) the former All Time High (ATH) trend-line and c) the Higher Lows Zone of the current Bull Cycle.
This Triple Hold Move is expected to produce the strongest rally of the Bull Cycle, the Parabolic Rally. But even if it is similar to the 'weakest' rally of this Cycle, then we should be expecting at least a +92.94% rise from the bottom, which translates to a price marginally above $140000. And that could come as early as this August.
So do you think we'll be seeing a rally at least as strong as last year's? Feel free to let us know in the comments section below!
-------------------------------------------------------------------------------
** Please LIKE 👍, FOLLOW ✅, SHARE 🙌 and COMMENT ✍ if you enjoy this idea! Also share your ideas and charts in the comments section below! This is best way to keep it relevant, support us, keep the content here free and allow the idea to reach as many people as possible. **
-------------------------------------------------------------------------------
💸💸💸💸💸💸
👇 👇 👇 👇 👇 👇

BTC | Bitcoin CURRENT CANDLE | NEW ATH or 70kThe previous weekly candle seemed unable to make a higher high after retesting the support at 76K.
However, today's bullish impulse has suddenly shocked right through two resistance zones, with the price now trading just above 90k.
If we can successfully CLOSE the weekly candle above 91K, it's likely that BTC is in for a new ATH which would mean ETH will also reach a new ATH, and then altseason will commence 🥳
Watch the following and make sure you are prepared for ALTSEAON:
___________________
BINANCE:BTCUSDT

Bearish drop?The Bitcoin (BTC/USD) is reacting off the pivot which is a pullback resistance and could reverse to the pullback support.
Pivot: 94,119.93
1st Support: 88,510.65
1st Resistance: 99,362.24
Risk Warning:
Trading Forex and CFDs carries a high level of risk to your capital and you should only trade with money you can afford to lose. Trading Forex and CFDs may not be suitable for all investors, so please ensure that you fully understand the risks involved and seek independent advice if necessary.
Disclaimer:
The above opinions given constitute general market commentary, and do not constitute the opinion or advice of IC Markets or any form of personal or investment advice.
Any opinions, news, research, analyses, prices, other information, or links to third-party sites contained on this website are provided on an "as-is" basis, are intended only to be informative, is not an advice nor a recommendation, nor research, or a record of our trading prices, or an offer of, or solicitation for a transaction in any financial instrument and thus should not be treated as such. The information provided does not involve any specific investment objectives, financial situation and needs of any specific person who may receive it. Please be aware, that past performance is not a reliable indicator of future performance and/or results. Past Performance or Forward-looking scenarios based upon the reasonable beliefs of the third-party provider are not a guarantee of future performance. Actual results may differ materially from those anticipated in forward-looking or past performance statements. IC Markets makes no representation or warranty and assumes no liability as to the accuracy or completeness of the information provided, nor any loss arising from any investment based on a recommendation, forecast or any information supplied by any third-party.

Bitcoin Cycle Update – Are We Nearing the Peak?Check out this BTCUSDT chart – we’re at GETTEX:92K today, and seems like things are heating up!
▸We’ve seen a Cycle Bottom in late 2022 - early 2023, followed by strong Bull runs in 2023 and 2024.
▸Those Consolidation phases (sideways channels) gave us the perfect setup for massive pumps!
▸Right now, we’re in a Pause Triangle after a big rally – but the Cycle Top could be just around the corner in mid-2025.
▸After that? A potential Bear phase – time to plan your moves!
💡 What’s your strategy? Are you riding this wave to the top, or preparing for the next dip? Let’s discuss 📨

DeGRAM | BTCUSD Large Investors Show Interest Through ETFs📊 Technical Analysis
BTC remains above $85 000 and holds the $91 500 level, so targets remain $98 000 and $108 000.
💡 Fundamental Analysis
• US spot-ETFs drew $442 M on Apr 24.
• Network hashrate hit a 1 ZH/s ATH, underscoring record security.
• Major players are withdrawing Bitcoin from exchanges.
• MicroStrategy added 11 k BTC.
• DXY is at 3-year lows and yields are down.
• Post-halving issuance may meet only 20 % of ETF demand.
• Latin-American remittance use keeps expanding.
✨ Summary
Surging ETF inflows, record hashrate, shrinking float and broader adoption reinforce the bullish breakout, favouring a move to 98-100 k while BTC stays above 91 500 USDT.
-------------------
Share your opinion in the comments and support the idea with a like. Thanks for your support!

Bitcoin Blasts to $95,800: Next Stop $96,500?Bitcoin is on FIRE! Just hit $95,800 & climbing in a perfect rising channel!
Breakout after breakout — next stop $96,500?
Check the 1H chart but beware of potential pullbacks!

Bitcoin - The Bottom Is In!Bitcoin ( CRYPTO:BTCUSD ) is reversing right now:
Click chart above to see the detailed analysis👆🏻
It was really just a matter of time until Bitcoin actually manages to create a potential short term and longer term bottom. With this monthly candle, bulls are taking over again and starting to buy cryptos quite heavily. The chart just tells us that this is not the end, but rather the continuation.
Levels to watch: $70.000, $300.000
Keep your long term vision,
Philip (BasicTrading)

Key Insights: Financial Markets Transformation by 2030For years, this page has been my space to share in-depth market research and personal insights into key financial trends. This post reflects my perspective — a strategic outlook on where I believe the digital finance industry is heading.
The financial world is evolving at an unprecedented pace, and it's easy to overlook subtle shifts. But the undeniable fact is that we are now standing at the intersection of three powerful industries — financial markets, blockchain, and artificial intelligence. We are positioned at the cutting edge of technology, where innovation is not a future concept but a present reality.
This post serves as a reference point for future trends and a guide to understanding the transformative forces shaping financial markets by 2030. These are not just facts, but my vision of the opportunities and challenges ahead in this rapidly converging digital ecosystem. Staying ahead today means more than following the market — it means recognizing that we are part of a technological shift redefining the core of global finance.
📈 1. Electronic Trading Evolution
Full transition from traditional trading floors to AI-driven digital platforms.
Integration of blockchain and smart contracts ensures transparency, automation, and risk reduction.
Real-time data analytics democratizes market access and enhances strategic decision-making.
🤖 2. Algorithmic Trading Growth
Accelerated by AI, machine learning, and big data analytics.
High-frequency trading (HFT) boosts efficiency but introduces new volatility factors.
Adaptive algorithms dynamically adjust strategies in real time.
Strong focus on regulatory compliance and ethical standards.
🔗 3. Tokenization of Real World Assets (RWA)
Transforming asset management with projected growth to $18.9 trillion by 2033. (now 18.85B)
Enhances liquidity, accessibility, and transparency via blockchain.
Institutional adoption is driving mainstream acceptance.
Evolving regulations (DLT Act, MiCA) support secure tokenized ecosystems.
🏦 4. Institutional Adoption & Regulatory Frameworks
Digitalization of fixed income markets and exponential growth in institutional DeFi participation.
Key drivers: compliance, custody solutions, and advanced infrastructure.
Global regulatory harmonization and smart contract-based compliance automation are reshaping governance.
💳 5. Embedded Finance & Smart Connectivity
Embedded finance market to hit $7.2 trillion by 2030.
Seamless integration of financial services into everyday platforms (e-commerce, mobility, etc.).
AI, blockchain, and IoT power real-time, personalized financial ecosystems.
Smart contracts reduce operational friction and enhance user experience.
🛡 6. Financial Crime Risk Management
Market expected to reach $30.28 billion by 2030.
AI-driven threat detection and anomaly monitoring strengthen AML compliance.
Blockchain ensures data integrity and automates cross-border regulatory adherence.
Global collaboration (FATF, EU AML) fortifies defenses against evolving financial crimes.
🌍 7. Consumer Behavior & Financial Inclusion
Digital banking bridges the gap for underbanked populations, especially in emerging markets.
Mobile solutions like M-Pesa revolutionize access to financial services.
Biometrics, microfinance, and AI-powered engagement tools foster inclusive economic participation.
🚀 Conclusion
By 2030, financial markets will be defined by technology-driven efficiency, regulatory adaptability, and inclusive growth.
Success will favor those who embrace innovation, leverage automation, and engage in cross-sector collaboration.
The future belongs to agile stakeholders navigating a landscape shaped by AI, blockchain, tokenization, and smart finance connectivity.
Best regards, EXCAVO
_____________________
Disclosure: I am part of Trade Nation's Influencer program and receive a monthly fee for using their TradingView charts in my analysis.

BTC Retrace or Rally? Bitcoin’s Liquidity Hunt & Next Move.Bitcoin BTC Analysis & Trade Idea
🚦 Market Context & Price Action
Bitcoin has experienced a sharp rally, pushing into previous weekly and daily highs. This area is a classic liquidity pool, where buy stops from breakout traders and late longs are likely accumulating. The current price action is overextended, suggesting that the market may be primed for a retracement as smart money seeks to capture liquidity before the next directional move.
💧 Liquidity Pools & Wyckoff Concepts
According to Wyckoff methodology, this phase resembles a "Buying Climax" (BC) where price surges into resistance, often followed by an "Automatic Reaction" (AR) and a potential "Secondary Test" (ST). The current rally into old highs is likely triggering buy stops, providing institutional players with ample liquidity to offload positions or engineer a shakeout.
🟢 Wyckoff Schematic:
Buying Climax (BC) at current highs
Anticipated Automatic Reaction (AR) as price retraces
Look for a range to develop (potential Accumulation phase) near the 50% Fibonacci retracement
📉 Fibonacci Retracement & Trade Setup
You’re eyeing the 50% retracement of the previous price range as a key level. This aligns with both technical and Wyckoff logic, as it’s a common area for price to find support after a liquidity grab.
🟢 Trade Plan:
Wait for a retrace to the 50% Fibonacci level
Observe for a range or consolidation (signs of absorption/accumulation)
Look for a bullish break of market structure (BOS) as confirmation
Enter long on confirmation, with stops below the range low
🌐 Fundamentals & Market Sentiment
Currently, Bitcoin sentiment is mixed but leaning bullish due to recent ETF inflows, institutional adoption, and macroeconomic uncertainty (e.g., inflation, rate cut expectations). However, funding rates are elevated, and open interest is high, indicating potential for a shakeout as overleveraged longs are vulnerable.
🟢 Key Fundamentals:
ETF inflows and institutional interest remain strong
Macro uncertainty (Fed policy, inflation) supports long-term bullishness
Short-term: Overheated sentiment and high leverage could trigger a corrective move
🧠 Sentiment & Risk Management
Social media and crypto news outlets are buzzing with bullish narratives, but this euphoria often precedes a correction. Be patient and disciplined—wait for the retrace and confirmation before entering.
🟢 Risk Management:
Only enter after clear accumulation and bullish BOS
Use tight stops below the range
Consider scaling in if the range develops with clear absorption
📈 Trade Idea Summary
Wait for a retrace to the 50% Fibonacci level of the recent rally
Look for Wyckoff-style accumulation and a bullish break of structure
Enter long on confirmation, targeting new highs or the top of the previous range
Manage risk with stops below the accumulation range
Not financial advice!

Bitcoin Forming Head & Shoulders – Watch for a Fake-OutPattern Formation: A complex Head and Shoulders structure is forming:
Left Shoulder ✅
Double Head ✅
Right Shoulder forming 🔄
Resistance Zone: The price is currently near a strong resistance area (around $87,000–$88,000).
This zone is likely to act as a ceiling and reject the price.
Expected Move (Blue Arrows):
shows a possible fake breakout above the resistance.
Then, a strong drop is expected, targeting:
First support near $78,000

#BTC is stuck but Here's the simplified Plan!Bitcoin is currently trading between key levels:
Upper resistance: 93700
Lower support: 91670
We are stuck in this range, and a breakout above or below these levels will confirm the next move in the trend.
Right now, Bitcoin is holding the 50 EMA on the 30-minute chart. As long as this support holds, we could see a move towards 95k, after which we will reassess the chart.
Here are two possible scenarios if we hit 95,700 again:
We break above and target 100k
We face rejection and correct back to 88k. While this wouldn’t be a large correction, it could offer a very opportunistic entry point.
I’ll be sharing more insights and updates as the chart unfolds.
Follow me on all my socials (link in bio).
Drop your thoughts in the comment section and hit the like button if this is useful.
Thank you
#PEACE

Hellena | BITCOIN (4H): LONG to resistance area of 98,000.Dear colleagues, in this forecast I will not make too forward-looking plans. I believe that the upward movement is not over yet, because the wave “C” is not yet completed and consists of five waves.
I think that we should expect to reach the resistance area of 98,000. A small correction to the support area of 90,000 is possible.
Manage your capital correctly and competently! Only enter trades based on reliable patterns!

Could The Stock Market Crash? - WARNING 🚨MartyBoots here , I have been trading for 17 years and sharing my thoughts on SPX .🚨
🚨 SP:SPX Could It Crash?🚨
Lets look into it deeper, very interesting chart but also a dangerous one. Need to see buyers soon or this is could be worse than people expect. 5-10% drop minimum and extreme bear could drop 40% total🚨
Watch video for more details

Bitcoin & The Cryptocurrency MarketWhat is the energy like? Are the energies rising or falling?
That's the question that you should ask yourself now in relation to Bitcoin and the Cryptocurrency market.
Falling energies lead to falling prices. What was happening just two months ago? The energy was low and the market dropped but, can you feel it? It has been heating up. Something is brewing behind the scenes and excitement is building up... It is coming, like a storm, a quiet storm.
The energies are rising and conditions are so much difference to just two months ago. Three months ago. Conditions are different now, the action on the chart will also be different now because the correction is over and once the correction is over we will always experience growth, no doubt for sure.
Mars will be in full force in May 2025 and Mars is the action planet. When Mars was retrograde the action died down, the action energy felt down and the market moved down. Mars goes full 1000% forward motion new territory high energies; fiery, impulse and barriers and blocks removed as Cryptocurrency grow.
That's the energy. It cannot be avoided it cannot be stoped, when it was going backward all the bullish action disappeared from the market, December 2024. As it goes back in full force the action is heating up and the proof will be seen clearly in the results. Bitcoin is already ultra bullish above $95,000. 80K is no more. No longer possible soon to be a dream long gone.
"Imagine buying Bitcoin when it was trading at 78,800, 80,000 or 90,000," that's exactly what people will be thinking in just a few short weeks when Bitcoin trades at $120,000 and then $150,000 with bullish momentum only growing and prices going higher.
What about the Altcoins?
You cannot have a bear market followed by a bear market supported by a bear market within a bear market. That's not how the market works. The market alternates between bearish and bullish periods between periods of corrections and growth.
Such a long correction we went through that we forget that Cryptocurrency is worth more than Gold. But we will remember soon because there is something cooking behind the scenes and the dish is almost ready to be served.
Your dish will be a desert, what you really deserve; huge profits.
The market will reward you for being a buyer when everybody was selling.
The market...
Thank you for reading.
Namaste.
BTCUSDT 1W AnalysisBTC ~ 1W Analysis
#BTC It is necessary to wait until this pattern is successfully broken to confirm a sustained bullish trend.

SPY/QQQ Plan Your Trade for 4-24 : Carryover PatternToday's Carryover pattern suggests we'll see similar price action today to what we saw yesterday.
We will very likely see a little support in early trading today, followed by a moderate meltdown-type trend.
I'm not expecting much to happen today - but we could get some news or other data that may prompt some type of bigger move in the markets.
Yesterday evening, I shared an "Update" video with everyone. In that video, I highlighted some of my active trades.
I've gotten a few messages from followers asking if I can share more data related to my trades. I'm sorry, but that won't happen in these FREE Plan Your Trade videos.
I shared some of my trades yesterday to highlight how I had moved into a moderate Short/PUT position, trying to stay ahead of the bigger market trend.
In other words, I'm not chasing the nickels. I'm setup to try to profit from the DOLLARS.
Gold and Silver may stay somewhat muted over the next 48 hours. But, I do expect them to try to melt upward.
BTCUSD appears to be setting up a BULL TRAP. I, personally, don't trust this upward price move because it is counter to the EPP price structure. I could be wrong.
But right now, I just don't trust the upside move in BTCUSD, knowing the SPY/QQQ should move into a deeper MAJOR LOW in early May.
Again, these videos are designed to help you build your skills and find your own style of trading.
I really do hope all of you are benefiting from my continued work to deliver these videos.
GET SOME...
#trading #research #investing #tradingalgos #tradingsignals #cycles #fibonacci #elliotwave #modelingsystems #stocks #bitcoin #btcusd #cryptos #spy #gold #nq #investing #trading #spytrading #spymarket #tradingmarket #stockmarket #silver

BTC H4 Analysis | Key Support Zone: | Watch for ReactionBitcoin is approaching a significant support area between 88,277 and 86,850 on the H4 timeframe. This zone has historically acted as a demand region, and price action within this range will be critical to monitor.
Technical structure shows a potential for volatility, and traders should keep an eye on how BTC behaves around this level. A clear reaction here could offer insight into the next directional move.
No trade setup provided — this is a technical observation for analysis purposes only.

April 23 Bitcoin Bybit chart analysisHello
It's a Bitcoinguide.
If you have a "follower"
You can receive comment notifications on real-time travel routes and major sections.
If my analysis is helpful,
Please would like one booster button at the bottom.
Yesterday, after a long time, the participation rate on TradingView was good, so
I will continue with a series of full-public analysis articles.
At the top is the Nasdaq 30-minute chart.
There will be an indicator announcement at 11 o'clock in a little while.
Based on the gap section created at the top and bottom,
I predicted the movement of the blue finger movement path.
This is the Bitcoin 30-minute chart.
Recently, Bitcoin has been moving autonomously,
and Tether dominance is in a vertical decline.
I won't tell you the reason for the Nasdaq decoupling separately.
The core of today's strategy is trend following.
I have never talked about all possibilities up and down without a single entry point.
*One-way long position strategy when the red finger moves
1. 93,068.9 dollar long position entry section / cut-off price when the purple support line is broken
2. 96,784 dollar long position 1st target -> Good 2nd target
Please note that the possibility of a new high is very high when the Good section is broken.
From 1 to Gap 8 at the top,
if coupled with Nasdaq, it is an upward wave. (After touching the top, wait for a long entry at the bottom)
Since the success rate can be high, please consider it as a long wait without operating a separate short position
Up to section 2 is the maximum long position waiting section.
Bottom->3 is a downward sideways movement.
The reason why I set the stop loss price when the purple support line breaks today is
Because it is the place where the previous low of the daily candle created today is broken
If it is pushed hard, it can fall to the bottom 89,597 dollars (1+4) section.
Up to this point, please use my analysis article only for reference and
I hope you operate safely with principle trading and stop loss prices.
Thank you.

BTC is trading within the equilibrium zone and..Bitcoin is now trading within my equilibrium zone. This will be one to watch for clues about the broader market, as it's currently leading the way.
Good luck, and always use a stop-loss!

Bitcoin Pullback or Opportunity📊 Bitcoin Analysis – Pullback or Opportunity?
CRYPTOCAP:BTC hit strong resistance at 94,000 $ failed to push higher, entering a correction phase 📉. Key support zones now lie at 91,200 $ 87,500 $ , both of which have shown solid reactions in the past 🛡️. If price holds one of these levels, the next target could be around 98,500 $based on the previous move’s momentum 🚀.
📌 Price is still holding above the 200 MA, suggesting bullish momentum is alive but needs further confirmation ✅.
👇 What’s your take on the next move?
🔁 Save this if you're watching the next targets
📩 Share with a friend who's trading BTC right now

TRUMP COIN BUY...Hello friends
Given the price growth we had, the price correction has now managed to make good bottoms, which indicates the strength of the trend, so we can enter the trade.
The purchase and target points have also been identified...
Follow capital management.
*Trade safely with us*

BTC Breakout is Loading... Don't Miss This Long Setup!BTC/USDT Trade Signal Analysis Setup Alert 🚨
Bitcoin looks ready to break higher after a clean retest of the breakout zone. Bulls in control—let’s get ready for a long!
• Signal Setup
📍 Entry Zone: 94,531 – 95,398
🎯 Take Profit 1 (TP1): 96,537
🎯 Take Profit 2 (TP2): 97,643
🎯 Take Profit 3 (TP3): 99,023
❌ Stop Loss (SL): 93,120
⸻
Technical Breakdown:
✅ Breakout above resistance turned support
✅ Retest + bounce with volume confirmation
✅ Clean bullish structure and momentum
Stick to your plan. Wait for confirmation and protect your capital! Do trade at your own risk.
