BTCUSDT in a sell zone Let's keep it simple.
The IOF is bearish on the H4 timeframe.
Price has retraced to a premium zone.
Technically, once we see a lower timeframe confirmation from these zones, we take a sell.
While I'm eyeing the liquidity at 109050, any break below 106415 will usher us into a sell towards 99000.
Use your proper entry confirmation and risk management.
1-BTCUSD

June 25 Bitcoin Bybit chart analysisHello
This is Bitcoin Guide.
If you "follow"
You can receive real-time movement paths and comment notifications on major sections.
If my analysis was helpful,
Please click the booster button at the bottom.
This is the Bitcoin 30-minute chart.
Nasdaq indicators will be announced at 11 o'clock shortly.
Nasdaq is rising vertically + renewing its all-time high.
Accordingly, I ignored the weekly MACD dead cross and
proposed the strategy for the pattern by substituting Tether dominance.
Although it is not visible on the screen,
I created today's strategy with the condition of maintaining the long position of $100,587.9 that was confirmed on the 23rd.
* One-way long position strategy when the red finger moves
1. $106,746 long position entry section / When the purple support line is broken
or when section 2 is touched, stop loss price
2. $108,66 long position 1st target -> Good 2nd -> Great 3rd target price
When section 1 at the top touches, it can be connected to an upward trend,
and section 2 is a sideways market.
At the very bottom and the very top,
I have indicated the maximum possible trend until tomorrow afternoon.
Up to this point, I ask that you simply use my analysis for reference and use only
I hope that you will operate safely with the principle of trading and stop loss.
Thank you.

BITCOIN Rejected (so far) where it absolutely SHOULDN'T!!Bitcoin (BTCUSD) hit today the top of the Channel Down pattern, which as we've discussed numerous times, is most likely on the long-term a Bull Flag technically. Still, this early test has so far turned into a rejection.
Early on to tell as the price remains above even the 1D MA50 (blue trend-line) but if it breaks above the closes a 1D candle above the top of the pattern, we expect it to immediately target the 2.0 Fibonacci extension level at 119500. We have analyzed of course why on the long-term the Target is at least $150k, but this is a shorter term analysis. Notice also how the 1D RSI has already broken above its Lower Highs trend-line.
As long as the price remains rejected within the Channel Down, it is possible to look for support on the 100000 level again, where this time it may make contact with the 1D MA100 (green trend-line) in an attempt to 'attract' the last batch of buyers.
Which scenario do you think will prevail? Feel free to let us know in the comments section below!
-------------------------------------------------------------------------------
** Please LIKE 👍, FOLLOW ✅, SHARE 🙌 and COMMENT ✍ if you enjoy this idea! Also share your ideas and charts in the comments section below! This is best way to keep it relevant, support us, keep the content here free and allow the idea to reach as many people as possible. **
-------------------------------------------------------------------------------
💸💸💸💸💸💸
👇 👇 👇 👇 👇 👇

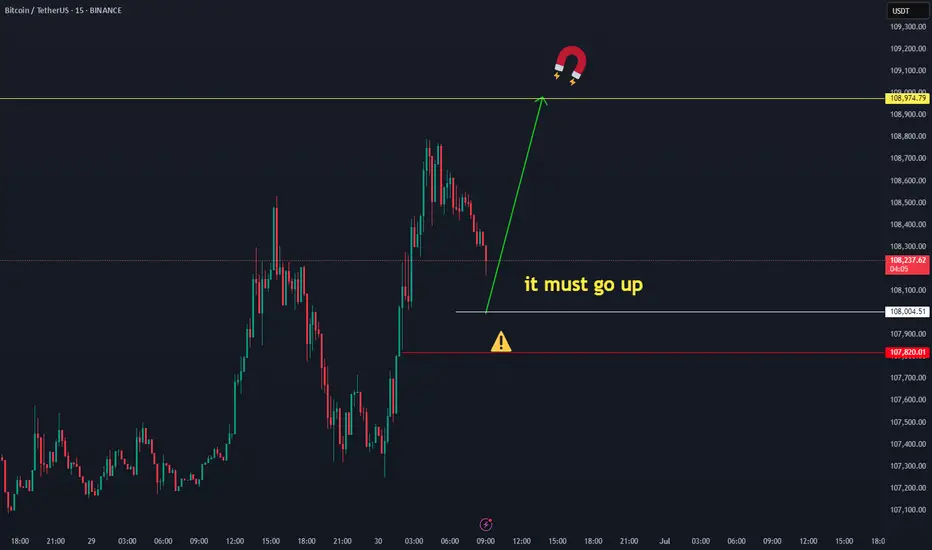
BITCOIN - Price can continue grow inside flat to $107933 level#BTC
The price is moving within a descending channel on the 1-hour frame and is expected to break and continue upward.
We have a trend to stabilize above the 100 moving average once again.
We have a downtrend on the RSI indicator that supports the upward move with a breakout.
We have a support area at the lower boundary of the channel at 106500, acting as strong support from which the price can rebound.
We have a major support area in green that pushed the price upward at 106000.
Entry price: 106736
First target: 106996
Second target: 107434
Third target: 107933
To manage risk, don't forget stop loss and capital management.
When you reach the first target, save some profits and then change your stop order to an entry order.
For inquiries, please comment.
Thank you.

Last chance to make profit from BTC with buying positionBullish flag
Strong resistance breakout
2 bull points
Position trade spot buying
Bitcoin completing timecycle on oct 2025 after that it would be 4th time if market again crash for around 70%
Manage your risk in both future and spot trading
Note: NO analysis would 100% profitable trading is the game of probability and risk management so follow your trading plan with proper risk reward and win rate.

StochRSI indicator and support and resistance levels
Hello, traders.
If you "follow" me, you can always get the latest information quickly.
Have a nice day today.
-------------------------------------
The StochRSI indicator on the left chart is slightly different from the StochRSI indicator on the right.
The StochRSI indicator on the left chart is the StochRSI indicator provided by default in TradingView, and the StochRSI indicator on the right chart is an indicator with a modified formula.
The StochRSI indicator is a leading indicator that is reflected almost in real time.
Therefore, it reacts sensitively to price changes.
Although it is advantageous because it reacts sensitively, it also increases the possibility of being caught in a fake, so I thought that a slight delay(?) was necessary, and so I created the StochRSI indicator on the left chart.
If you look at the relationship between the K and D of the StochRSI indicators on the two charts, you can see that there is a big difference.
In the end, you can predict the movement by checking whether the movement of the K line has escaped the overbought or oversold section.
However, I think that you will receive information that can determine the sustainability of the trend depending on the positional relationship between K and D.
Therefore, it is important to distinguish the inflection points that occur in the StochRSI indicator.
This is because these inflection points provide important information for drawing trend lines.
Therefore, the StochRSI indicator on the left chart, which better expresses the inflection point, is being used to draw the trend line.
(Unfortunately, this indicator was not registered on TradingView because I did not explain it well.)
-
As a new candle was created, the StochRSI indicator on the left chart is showing an inflection point on the K line.
The StochRSI indicator on the right chart is showing a transition to a state where K < D.
We will have to check whether the inflection point was created only when today's candle closes, but I think that the fact that it is showing this pattern means that there is a high possibility of a change in the future trend.
Since the next volatility period is expected to start around July 2nd (July 1st-3rd), I think it has started to show meaningful movements.
-
It is true that you want to buy at the lowest price possible and sell at the highest price.
However, because of this greed, one mistake can lead to a loss that can overturn nine victories, so you should always be careful.
Therefore, if possible, it is better to check for support and respond.
In that sense, I think it is worth referring to the relationship between K and D of the StochRSI indicator on the left chart.
This is because the actual downtrend is likely to start when K < D.
-
In order to check for support, you definitely need support and resistance points drawn on the 1M, 1W, and 1D charts.
Ignoring this and checking for support at the drawn support and resistance points can result in not being able to apply the chart you drew to actual trading.
Therefore, you should draw support and resistance points first before starting a trade.
Otherwise, if you draw support and resistance points after starting a trade, you are more likely to set support and resistance points that reflect your subjective thoughts, so as I mentioned earlier, you are more likely to lose faith in the chart you drew.
If this phenomenon continues, it will eventually lead to leaving the investment market.
-
It is important to determine whether there is support by checking the correlation between the StochRSI indicator and other indicators at the support and resistance points drawn on the 1M, 1W, and 1D charts.
Even if the inflection point of the StochRSI indicator or other indicators occurs at a point other than the support and resistance points you drew, you should consider it as something that occurred beyond your ability to handle.
In other words, you should observe the price movement but not actually trade.
As I mentioned earlier, if you start to violate this, you will become less and less able to trust the chart you drew.
-
Accordingly, the basic trading strategy I suggest is to buy near the HA-Low indicator and sell near the HA-High indicator.
However, since the HA-Low and HA-High indicators are expressed as average values, they may move in the opposite direction to the basic trading strategy.
In other words, if the HA-Low indicator is resisted and falls, there is a possibility of a stepwise downward trend, and if the HA-High indicator is supported and rises, there is a possibility of a stepwise upward trend.
Therefore, the basic trading strategy mentioned above can be considered a trading strategy in the box section.
In the case of deviating from this box section, it is highly likely to occur before and after the volatility period indicated by the relationship between the trend line using the StochRSI indicator mentioned above and the support and resistance points drawn on the 1M, 1W, and 1D charts.
Therefore, special care is required when conducting new transactions during the volatility period.
This is because there is a high possibility of being caught in a fake when trading during the volatility period.
-
The DOM(60) and DOM(-60) indicators are good indicators to look at together with the HA-Low and HA-High indicators.
The DOM indicator is an indicator that comprehensively evaluates the DMI, OBV, and MOMENTUM indicators.
Therefore, the DOM(60) indicator is likely to be at the end of the high point range, and the DOM(060) indicator is likely to be at the end of the low point range.
In the explanation of the HA-Low and HA-High indicators,
- I said that if the HA-Low indicator receives resistance and falls, there is a possibility that a stepwise downtrend will begin,
- and if the HA-High indicator receives support and rises, there is a possibility that a stepwise uptrend will begin.
In order for an actual stepwise downtrend to begin, the price must fall below DOM(-60), and in order for a stepwise uptrend to begin, it must rise above DOM(60).
In other words, the DOM(-60) ~ HA-Low section and the HA-High ~ DOM(60) section can be seen as support and resistance sections.
-
If these correlations start to appear, I think you will be able to create a trading strategy that fits your investment style without being swayed by price volatility and proceed with trading.
The reason for analyzing charts is to trade.
Therefore, the shorter the time for chart analysis, the better, and you should increase the start of creating a trading strategy.
-
Thank you for reading to the end.
I hope you have a successful trade.
--------------------------------------------------


BTC Shorts Into Q3 | Monthly + Half-Year Candle PressureWe’re entering a pivotal window on the Bitcoin chart, the monthly close, Q2 close, and 6-month candle all lining up. This kind of macro convergence rarely goes unnoticed by the market and often marks major structural shifts.
BTC has failed multiple times to break through key highs, and with momentum fading into this close, I’m leaning short heading into Q3. Even if price wants to trend higher later this year, I expect that move to begin from a deeper wick, not from the top of the current range.
I’m watching the 103K level closely. A break below it could trigger a swift drop toward 95K, possibly lower depending on how the new monthly opens and reacts. That would line up with the idea of a strong lower wick forming on the new 3M or 6M candle.
This isn't a long-term macro short, just a high R setup where structure, timing, and context are aligning. I believe this move starts today or very soon. The next few candles will speak volumes.

BTCUSDT SHORT SIGNAL Setup Type: Liquidity Trap & Distribution
Trade Idea (SHORT):
Entry Zone: $108,000 – $110000
Stop Loss: Above $113000
Take Profit Targets:
TP1: $104,000
TP2: $100,000
TP3: 98000
TP4: 74000
This analysis is for educational purposes only and does not constitute financial advice.
Always do your own research and apply proper risk management.
Trading involves risk, and you are solely responsible for your decisions.
Use this information as a guide — not a guaranteed outcome.
Wait for clear confirmation before executing any trade.

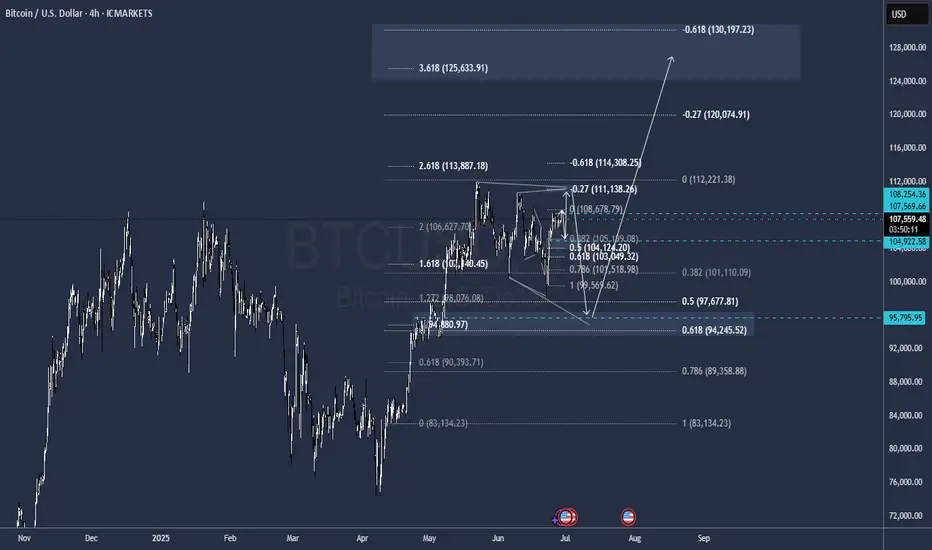
Analyzing the new month, new week, new day
Hello, traders.
If you "follow", you can always get the latest information quickly.
Have a nice day today.
-------------------------------------
(BTCUSDT 1M chart)
A new month begins in one day.
The key is whether it can hold the price by rising above 109588.0.
If not, there is a possibility that it will fall below the 94172.00 StochRSI 50 indicator point that the arrow is pointing to.
We need to see if it can rise with support near the Fibonacci ratio of 1.618 (89050.0).
Since the current low-point trend line is not complete, it is not surprising that it can show a downward trend at any time.
However, if it rises above 109588.0 and maintains the price, it is expected that there will be an attempt to rise near the Fibonacci ratio of 2.618 (133889.92).
I think it is likely to be the last target of the target bull market in 2025.
-
(1W chart)
It is a period of volatility around the week including June 23.
That is, from June 16 to July 6 is the volatility period.
The key is whether it can rise to the right Fibonacci ratio 2.24 (116940.43) during this volatility period.
Even if it fails to rise, if the price maintains above 104463.99, it is expected to show an upward trend around the next volatility period.
The next volatility period on the 1W chart is expected to be around the week of August 18.
-
When it falls below 104463.99, we need to check whether the HA-High indicator is newly generated.
If not, it is important to check whether there is support around the current HA-High indicator point of 99705.62.
Since the M-Signal indicator on the 1W chart is passing around 99705.62, its importance can be said to be high.
If it falls below the M-Signal indicator of the 1W chart, it is expected to determine the trend again when it meets the M-Signal indicator of the 1M chart.
-
(1D chart)
The key is whether it can maintain the price by rising above the HA-High indicator point of 108316.90 on the 1D chart.
If it fails to rise,
1st: 104463.99
2nd: 99705.62
You should check for support near the 1st and 2nd above.
If it falls below the M-Signal indicator of the 1W chart,
1st: 89294.25
2nd: M-Signal of the 1M chart
There is a possibility that it will fall near the 1st and 2nd above.
-----------------------------------------
(1W chart)
The chart above is a trend line chart drawn on the 1W chart.
It looks complicated, but what's important to look at is the correlation between the high-point trend line and the low-point trend line.
That is, even if the price rises above 109.588.0, if it doesn't rise above the high-point trend line, it is likely to fall near the low-point trend line.
Fortunately, since it is forming an upward channel, it is expected that the price will eventually rise even if it falls.
-
(1D chart)
Unlike the trend line on the 1W chart, the high-point trend line on the 1D chart forms a downward trend line.
Accordingly, the period around July 7, when the low-point trend line and the high-point trend line intersect, can be considered an important period of volatility.
However, the volatility period starts around July 2nd and is expected to end around July 10th.
----------------------------------------------
As shown above, many lines were drawn to analyze the chart.
I have roughly explained which of the lines drawn in this way should be prioritized.
Since chart analysis is for creating a trading strategy, the support and resistance points drawn on the 1M, 1W, and 1D charts are ultimately the most important.
Therefore, it is most important to check how the support and resistance points were created and find the reason for them.
Other analyses are only additional elements.
As I always say, chart analysis that does not show support and resistance points is only an analysis chart that can be used for trading.
You cannot trade with such analysis charts.
Also, if support and resistance points are shown, you should check the basis for setting the support and resistance points.
In order to serve as a support and resistance point, there must be a basis.
When you cannot confirm the basis for the support and resistance point, it is important to ask questions and find out the basis.
Fibonacci ratios are not suitable for actual trading.
However, when the ATH or ATL is updated, it is valuable enough for analysis.
Other than that, there must be support and resistance points drawn on the 1M, 1W, and 1D charts.
-
Thank you for reading to the end.
I hope you have a successful trade.
--------------------------------------------------
- This is an explanation of the big picture.
(3-year bull market, 1-year bear market pattern)
I will explain more details when the bear market starts.
------------------------------------------------------

The Chart Is Ugly. The Setup Is Beautiful. Welcome to the TrapI’m gonna try to keep it short (try, lol).
If you’re new here or just stumbled on this, here’s what you need to know:
LTC is the King of Pain… and the Prince of Parabolas.
It’s one of the hardest coins to hold — maybe the hardest.
It’ll test your patience, shake your conviction, and make you doubt everything...
right before it delivers.
Looking at the chart, LTC printed a bearish head-and-shoulders pattern.
But guess what? That’s PROBABLY the final trap — the one that triggers those explosive moves right after... the start of the parabolic season.
In my humble opinion, yeah — we MIGHT still drop more depending on what BTC does. But if you’re reading this and wondering what things look like before a big breakout — well, it’s exactly this:
Ugly charts, bearish structures, everyone doubting… and then boom — a new beginning. A rise.
That May move from $81 to $107? That was the breakout.
What we’re in now? It’s the bear trap.
What comes next? Should be something we’ve never seen before. I’ll leave it at that.
Some fundamentals:
LTC:
Hash-rate? Went parabolic — price hasn’t caught up yet.
Top 5 most used digital assets for moving value (by volume).
Born in 2011. 100% uptime. Still standing, still in the top 20. Survived it all.
Only 84M LTC will ever exist. Scarcity is real.
78% of LTC addresses are holding for over a year. They’re not selling cheap.
MWEB = optional privacy.
LiteVM = next-gen programmability for LTC.
Oh, and don’t forget: potential ETF approval.
If there’s one digital asset with a real shot — it’s LTC. Already declared a commodity by the CFTC.
Over 7 years of consolidation. If you zoom out to the monthly+ timeframe, all the bull and bear noise looks like one big sideways base.
Just to name a FEW.
Absurdly undervalued. Criminally underperforming.

Trading the Impulse Rally Retracement — Price and Time Symmetry The Stop Loss Triangle is back!
This time with BITSTAMP:BTCUSD coming off its recent impulse rally. For those of you that aren’t familiar with my strategy — let me start from the beginning…
This concept involves positioning against the opposing decline in price and time as a precursor to our theoretical projection. If the underlying enters our predetermined faded cross-section, the stop loss is triggered to prevent sideways consolidation and the erosion of contract premiums or leverage decay.
This inherently ‘sclene’ triangle is constructed by drawing a straight trend line through the bottoming reversal candle and the furthest projection in price and time symmetry (78.6%) of the retracement. Once connected, draw a vertically positioned straight line from the highest or lowest point in the previously identified retracement to the bottom reversal candle area once again. To create a ‘right triangle’, now turn 90 degrees towards the final point, which is determined by the nearest projection in price and time symmetry (38.2%). This allows time after the imposed price and time date, yet not enough for premium or leverage decay to become significant.
In its entirety, this forms the stop loss triangle.
I encourage my followers to identify and explore the system on their own. As always, feel free to ask me anything related to it. We’ll follow along and you’ll be amazed at the precision of Fibonacci symmetry.
CHEERS

Bitcoin: Bearish Signal Watch 107,400 To Confirm.Bitcoin bearish pin bar developing, which is a bearish sign at least for the short term. IF this candle closes and low is compromised, (107,400?) A sell signal will be in effect (see arrow). This will also confirm a failed break out (see trend line) of a multi month consolidation. The signal in question is an ideal setup for swing traders or day traders looking for aggressive shorts, while the broader trend is completely intact. A reasonable price objective for such a move is the 103K area which is basically the mid point of the consolidation and near the 102 to 100K support. While the market can potentially break lower than that, there is NO way to forecast such an event. Market confirms first, then expectations can be adjusted effectively.
The wave count has been adjusted on this chart. The current consolidation is likely the sub wave 4 of the broader 5 which means implies the trend is still bullish since the sub wave 5 of 5 is not in play yet. Maybe after this next retrace? The next bullish setup (around 103K?) may present a high probability swing trade opportunity on the long side possible over the next week or two.
Keep in mind, it is not a good idea to get married to any opinions. I don't care how bullish the fundamentals are, all it takes is an unexpected catalyst and this market retraces hard. A week ago we were flirting with 98K, today 108K. Levels and price action are a much more accurate gauge of where the market is likely to go on the short term, and more importantly offer greater insight into the potential reward and RISK.
I adjust my outlook constantly because I know that the MARKET is ALWAYS right. It offers guidance if you know how to listen and be flexible. "Outlook" can be categorized by time which helps to keep expectations inline with market intent. For example, reward and risk expectations for a swing trade (4H time frame) will be smaller compared to a position entered for investment (weekly time frame). Keeping these expectations separate will help you control risk in a much more optimal way compared to having a swing trade turn into an investment.
Thank you for considering my analysis and perspective.

BITCOIN NEXTKind of a Messy coorective Structure, this is What I can see right now with the movemments it has done
YIf you lower the time frame you should see the complete map also levels are Highlighted
It should go as follows
Buy from now @ 107.600 to 108.500
Sell from @ 108.500 to 105.000
buy from @ 105.000 to 111.000
Sell from @ 111.000 to 96.000
Buy from @ 96.000/ 94.000 to 120.000 and 130.000
GG
Buying Reploy AI (RAI) Today Is Like Buying Bitcoin at $345Buying Reploy AI (RAI) Today Is Like Buying Bitcoin at $345—Or Even $3.45
Imagine going back in time to 2016 and buying Bitcoin at $345. Most people didn’t believe in it. They thought it was too risky, too early, or just plain irrelevant. Today, Bitcoin is trading in the six figures. The opportunity was historic.
Now, there’s another chance brewing—and it’s quietly sitting in front of us.
That opportunity is Reploy AI ($RAI).
🚀 What is Reploy AI?
Reploy AI is a micro-cap artificial intelligence (AI) project focused on decentralizing the compute layer that powers AI training and inference. It’s building a distributed AI network that connects GPU resources with developers and businesses in need of scalable AI infrastructure. Think of it as the decentralized AWS + OpenAI — built from the ground up for speed, accessibility, and equity.
It’s early. But the fundamentals, vision, and market positioning are explosive.
💰 Let’s Talk Numbers: The Bitcoin Comparison
Right now, Reploy AI ($RAI) trades at a tiny market cap—roughly $3 million at the time of writing.
If $RAI hits a $1 billion market cap, that’s a 31,000% return.
Yes, 31,000% — not a typo. That’s a 310x gain.
That would be like buying Bitcoin at $345, before it ran to over $100,000.
If $RAI grows into a $10 billion AI ecosystem, it would be like snagging Bitcoin at just $3.45.
Let that sink in.
🌐 Why This Could Actually Happen
AI Is the Next Internet
The world is undergoing an AI revolution. But centralized giants (like OpenAI and Google) dominate access. Reploy offers a decentralized, censorship-resistant alternative — and the market desperately needs it.
Micro Cap = Maximum Asymmetry
Unlike hyped-up billion-dollar AI tokens, Reploy is still undiscovered. Small caps like this can explode with just one partnership, listing, or viral catalyst.
Strong Tokenomics & Ecosystem Design
RAI has a deflationary supply structure, utility-driven demand, and real infrastructure use cases tied to decentralized compute, developer tooling, and enterprise deployment.
It’s Not Just Hype. It’s Being Built.
Reploy isn’t vaporware. The team is shipping code. The platform is live. And the network of compute contributors is growing.
⚠️ Of Course, This Is Risky
Yes, it’s still early. Yes, micro-cap tokens carry real risk. But so did Bitcoin when it was $345. So did Ethereum when it was $7.
The difference is this: most people only see opportunity when it’s already gone.
This isn’t financial advice. But if you’ve ever wished for a second shot at catching a generational trend early—this might be it.
🧠 Final Thought
In crypto, the biggest returns come from spotting the future before it’s obvious.
Buying $RAI at today’s price could be your version of buying CRYPTOCAP:BTC at $345—or even $3.45. The only question is: will you see it in time?
📈 DYOR. Stay sharp. Think long-term. And don’t miss what might be the next breakout in AI + crypto.

BTCUSD: Bulls Are Winning! Long!
My dear friends,
Today we will analyse BTCUSD together☺️
The price is near a wide key level
and the pair is approaching a significant decision level of 107,630.73 Therefore, a strong bullish reaction here could determine the next move up.We will watch for a confirmation candle, and then target the next key level of 108,207.06.Recommend Stop-loss is beyond the current level.
❤️Sending you lots of Love and Hugs❤️

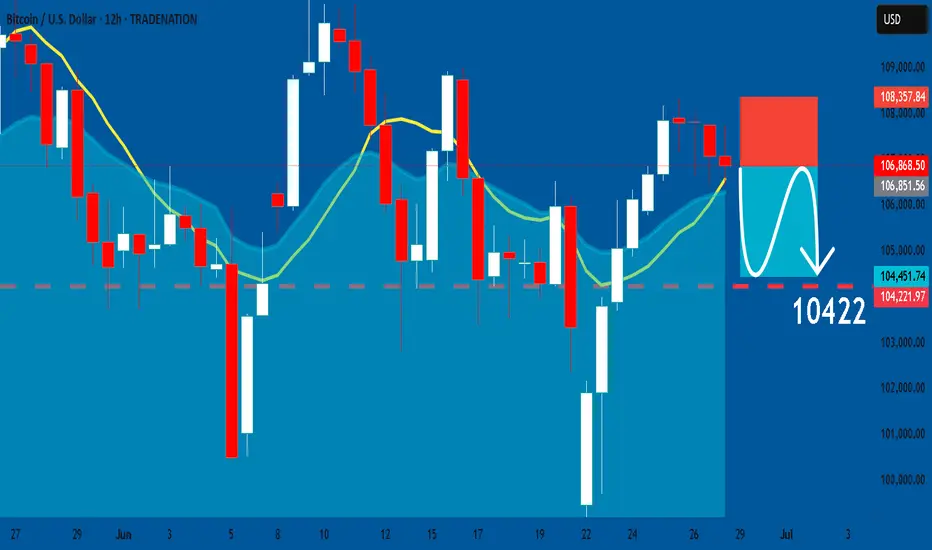
BTCUSD: Bearish Continuation & Short Signal
BTCUSD
- Classic bearish pattern
- Our team expects retracement
SUGGESTED TRADE:
Swing Trade
Sell BTCUSD
Entry - 10686
Stop - 10837
Take - 10422
Our Risk - 1%
Start protection of your profits from lower levels
Disclosure: I am part of Trade Nation's Influencer program and receive a monthly fee for using their TradingView charts in my analysis.
❤️ Please, support our work with like & comment! ❤️
BTC Slumps Below 100000, Rebounds to Test 109500 Short Zone💎 BTC Rebounds After 100000 Drop, Eyes Short at 109500 Resistance 📊
BTC dipped below the 100000 threshold 🔻 before rebounding near 98000 🔺—a move tied to DXY weakness and easing geopolitical tensions. Now challenging the 110000 mark 🔼, it faces stiff resistance at 109500. First-time 110000 tests often spark pullbacks, making shorts the favored play here 📉.
🚀 Sell@108500 - 107500
🚀 TP 106500 - 105500
Accurate signals are updated every day 📈 If you encounter any problems during trading, these signals can serve as your reliable guide 🧭 Feel free to refer to them! I sincerely hope they'll be of great help to you 🌟 👇


BTC Is Replaying a Bullish Fractal >>> Are You Watching?Hello guys!
I see a deja vu here! Let’s look at the historical daily chart (Jan–May 2025):
What happened?
Initial Drop (Yellow Oval): Bitcoin approached a key S&D zone but didn't touch it, triggering a short-lived bounce before dropping again.
Second Drop (Red Ovals): This time, price precisely touched the demand zone, triggering a clean bullish reversal.
What followed was a strong trend breakout, sustained higher lows, and an eventual surge past prior resistance levels.
Current 4H Chart Setup: A Mirror Image?
Yellow Highlight: Once again, we saw a bounce that didn't quite touch the key demand zone ($98K–$100K).
Red Zone Prediction: If this mirrors the historical move, the price is likely to return and touch this S&D area before launching a bullish leg.
Blue Path Projection: A sharp reversal is expected post-touch, aiming toward $111K–$113K as the next key resistance zone.
The descending trendline adds confluence
___________________
History Doesn’t Repeat, But It Often Rhymes
Based on this fractal analysis, Bitcoin is likely forming the same bullish base seen earlier in 2025. The setup hinges on one key event: a return to the $99K–$100K zone, where demand is likely to step in aggressively.
If the pattern repeats, the current market may offer one last high-reward long opportunity before a parabolic rally.

BTCUSD – Major Decision Point at The Edge📍 By: MJTrading |||
Bitcoin has rallied sharply from ~$98K and is now testing a critical confluence zone — the top of the descending channel and a strong supply area, known as "The Edge."
EMAs are turning up, supporting bullish momentum
⏳ What’s Next?
At this stage, two scenarios emerge:
⚠️ This is a make-or-break zone:
🟩 Breakout above the channel signals trend reversal → next resistance: $111K
🟨 Rejection leads to a move back to the $103K or $100K levels
This setup offers a high-RR opportunity for both breakout traders and mean reversion players.
🧠 Trade the reaction at the edge, not the prediction.
Thanks for your attention...
Share your thoughts...
—
#BTCUSD #Bitcoin #CryptoTrading #TheEdge #BreakoutOrBounce #CryptoSetup #DescendingChannel #SmartMoney #TechnicalAnalysis #PriceAction #SwingTrade #EMA #RiskReward #MJTrading #4hChart #TrendDecision #SupplyZone

Bitcoin Pressing Up But This Compression Could Crack LowerBitcoin has been steadily climbing for months, respecting that long-term trendline since last year. Each dip into it brought a strong bounce, showing bulls are still in control of the bigger picture.
But right now price is pressing into a tight descending resistance line. We can see it making lower highs while struggling to break above that red trendline. At the same time, it’s sitting just above a key horizontal range, where buyers stepped in before.
This compression is risky . If BTC fails to push above the descending resistance and breaks back below the box, it could drop toward the next demand zone around the low 100K region .
As long as the major trendline from last year holds, the broader uptrend is intact . But losing this structure would open the door for a deeper correction.
This is the kind of spot where patience pays. Let the breakout or breakdown show its hand before jumping in heavy.
