Bitcoin - This indicator is always right! Crash to 40k in 2026.What we can see on the chart is Bitcoin cycles. We can statistically predict Bitcoin moves with this simple chart, because it's always right and never wrong. What can we say with certainty?
Statistically:
Bitcoin's bull markets last for 742 to 1065 days
Bitcoin's bear markets last for 364 to 413 days
Correction is every time weaker, but still huge
The recent uptrend on Bitcoin started in December 2022 and ended in January 2025 (791 days). We know that statistically bull markets last for 742 to 1065 days, so this indicator tells us that the bull market ended! This indicator was never wrong, so do your own research. It's always like this. Moon boys calling for 300k, 500k, or 1M in 2025 do not follow my TradingView profile because otherwise they would know this strong fundamental fact. The market cap of Bitcoin is already too big, so forget about 500K or 1M in the short term because the market cap would be higher than gold. Gold is the number 1 asset in the world.
Statistically, Bitcoin crashes every 4 years by 86% to 77%. The market cap is getting bigger as institutions step in, so this time I expect a weaker crash (around 65%). Still, it's a huge crash, and many investors will sell at a loss as usual. Knowledge of the Bitcoin cycles will save you a lot of money.
Bitcoin halving is coded to occur once every 210,000 blocks, or roughly every four years, and will continue in this fashion until the final supply of 21 million BTC is reached. It is assumed that the last BTC will be mined in 2140. After that, transaction fees are supposed to be the only source of block rewards for miners.
Write a comment with your altcoin, and I will make an analysis for you in response. Also, please hit boost and follow for more ideas. Trading is not hard if you have a good coach! This is not a trade setup, as there is no stop-loss or profit target. I share my trades privately. Thank you, and I wish you successful trades!
AB=CD

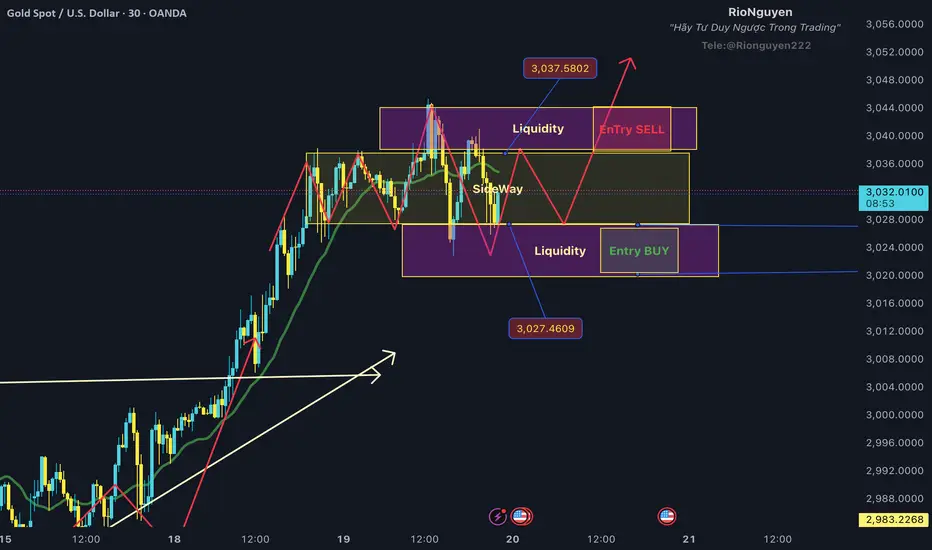
What is Gold Waiting For? Is This the ATH 3045? In our group, we secured profits in two rounds when gold hit an all-time high of $3045. Currently, we are still focusing on selling at $3040-$3045, as this is the liquidity grab zone for sellers.
I believe we can still trade within the sideway range, and be cautious of the two liquidity sweep zones as I have marked in the image.
Sell Liquidity 3040-3045: We can place Sell Limit orders in this area.
Buy Liquidity 3020-3025: We can place Buy Limit orders in this area.
The reason for this sideway phase of gold is that the market is awaiting the Fed meeting at 1:30 AM tomorrow, March 20th. After that, a strong trend will emerge. My plan is still leaning towards the Buy side, as the market is currently concerned about a potential economic recession in the US.
Therefore, we can focus on making small profits during this sideway period and wait for the next upward wave.
Thank you for your review, and I hope you'll stay longer by pressing Follow.
Gold's Crazy Run: New All-Time High of 2994 - Reaching the TopFirst off, congratulations to those who entered a Buy order following yesterday's plan that I posted earlier.
Gold is currently forming a small sideways range around the 2980-2990 area, and I believe there will be another upward push to grab liquidity from those entering SELL orders around this zone. This will create market panic, reaching a peak where no one dares to participate anymore. At that point, Gold will experience a strong correction.
Therefore, today's Asian and European sessions will likely see a sideways range between 2980-2990, and the beginning of the US session will see an upward push to grab liquidity above the 3000 USD/oz level. The US session will then conclude with a price drop. If Gold's scenario plays out as expected, we can anticipate a profit-taking day from investors next Monday
Thank you for your review, and I hope you'll stay longer by pressing Follow.

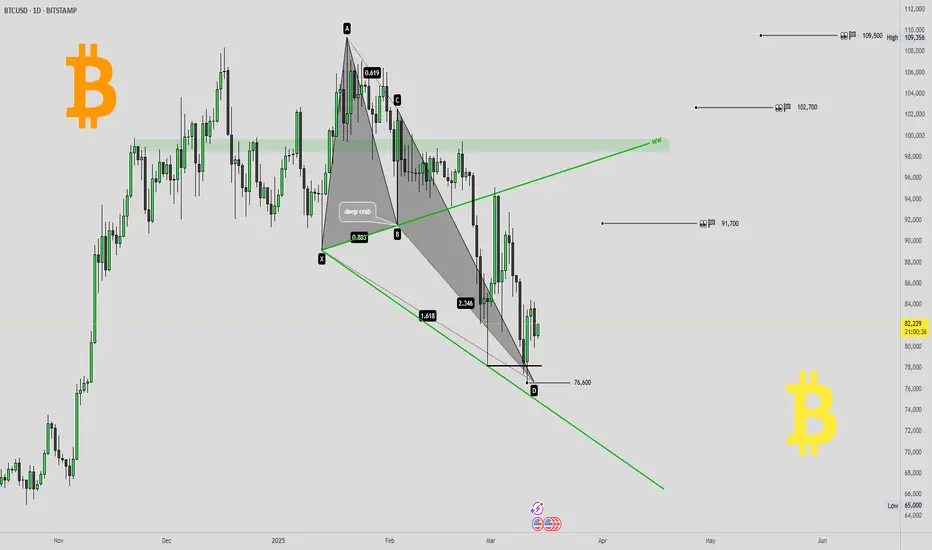
Bitcoin reversal confirmed ?!Bitcoin reversal confirmed ?! 👀
I would like to present you some charts with important levels and relevant patterns.
🖥daily-chart (BITSTAMP) and 💡everything important in the chart 👀
💥Here in the daily chart (BITSTAMP)
- a Deep-Crab harmonic with
- a WolveWave
and the daily-chart of the
🔥Daily MA200 re-test 👀
- gap fill
- support-line 2022 and 2024 TOPs
👉 BITCOIN roadmap/outlook (from 27th february 2024) 💡
🎯 If you like this idea, please leave me a 🚀 and follow for updates 🔥⏰
Furthermore, any criticism is welcome as well as any suggestions etc. - You're also very welcome to share this idea.
Have a nice evening & successful trading decisions 💪
M_a_d_d_e_n ✌
NOTE: The above information represents my idea and is not an investment/trading recommendation! Without any guarantee & exclusion of liability!
Do you think GOLD will go up or down today with the Nonfarm newsDo you think GOLD will go up or down today with the Nonfarm news?
In the Asian and European sessions, gold will still have a sideways range, but the range will be smaller than yesterday.
The price reaction will be from the 2916-2919 area down to 2900. And it's likely that today's Nonfarm news will be a liquidity sweep of buy orders to the 38.2% Fibonacci level, which is the 2970-2980 price range
-In summary, this analysis predicts that:
+ Before the Nonfarm news is released, the price of gold may trade within a narrow range.
+When the Nonfarm news is released, there is a possibility that the price of gold will make a temporary sharp move up to around 2970-2980 to "sweep liquidity" from buy orders, before potentially reversing downward.

Bitcoin - 60% crash to 32K | ETH is dying | Trump scam?Technically, Bitcoin is entering a huge bear market! This is what my charts and fundamentals tell me at the moment.
Trump returned to the White House on January 20, 2025. This day, Bitcoin hit a new all-time high (109,588 USD), and since then, Bitcoin has been going only down! In 2019, Trump said he is not a fan of crypto. x.com
So isn't it weird that Bitcoin has been going down since the beginning of his presidential post? (On January 20). Random or planned? Answer by yourself, but something seems to be fishy here. What about the latest Trump post on TruthSocial about the strategic crypto reserve? The market reacted very positively, but after a few days, the whole market completely crashed and is now finding its new low. Was this another trap? Clearly, everyone who bought into this news is at a loss on his trading account; that's for sure.
What is happening to Ethereum? Ethereum is almost at the same price it was in 2018!! 7 years ago, the price of Ethereum was 1440 USD; the current price is around 1700 USD. I predict ETH to go to 750 USD in 2026. Why is this new technology struggling? Investors all over the world and early adopters are very disappointed by the performance of this coin. It also seems like the crypto market completely collapses, and only Bitcoin is surviving. Even though Bitcoin hit only 109k, which was most likely the ultimate top for the next few years, it was also less than everyone expected. I don't really want to talk about other altcoins because they are down 95% to 99%, and this bull market did nothing (sideways price action). In conclusion, this was the weakest bull market in history.
From a technical point of view, Bitcoin (and all altcoins) is breaking down on the weekly chart! The bullish market structure is broken, and we entered a new downtrend. Where to buy BTC, ETH, SOL, XRP, and other coins? You can write me a comment below, and I will tell you. I start with BTC—buy Bitcoin at the 0.618 FIB retracement. This FIBO is at 32 688 USDT, so we need to wait 1 year for the price to come to this level. Be patient.
So what to buy? Maybe focus on very low-cap coins; they do not follow the general trend (bull or bear). I have a tip for many coins, such as ATC (AutoTCrypto). Contract EQBMxFekc39SONbY8Mes8IwnZZlsPzeZhwz2c7sqMkkjI0uy. Where to buy? Use a decentralized exchange, such as dextools or ston.fi.
Write a comment with your altcoin + hit the like button, and I will make an analysis for you in response. Trading is not hard if you have a good coach! This is not a trade setup, as there is no stop-loss or profit target. I share my trades privately. Thank you, and I wish you successful trades!

3000 Target goldThis is a 1-hour chart of Gold Spot (XAU/USD) from OANDA. The analysis suggests a bullish outlook, with price action currently testing a key resistance level around 2,934. The chart includes the following key elements:
1. Support and Resistance Levels:
A previous resistance zone (marked in dark teal) has been broken and is now acting as potential support.
The next major resistance is around 2,980, with an all-time high target of 3,000.
2. Trendline Support:
A white ascending trendline indicates a bullish structure, with price respecting higher lows.
3. Projected Move:
The yellow arrow suggests a pullback to the support zone (previous resistance) before bouncing higher.
A successful retest could lead to an upward move towards 3,000.
This analysis suggests that gold remains in an uptrend, and traders might look for confirmation of support before entering long positions.

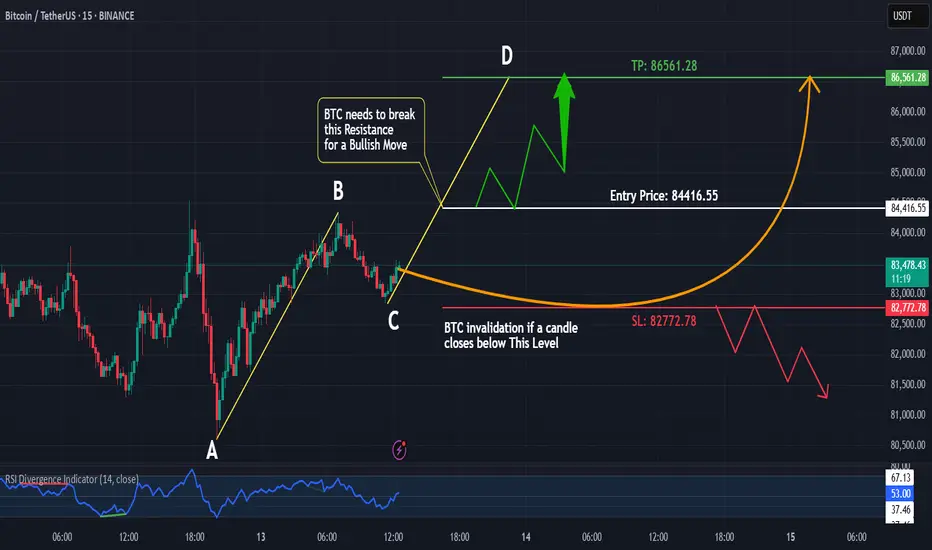
BTC Bulls Are Back? AB=CD + 0.618 Fib Rejection!#Bitcoin is setting up for a potential bullish breakout!
On the 15-minute time frame, #BTC is forming a classic #AB=CD pattern, a strong harmonic signal for a continuation move. Additionally, price has just rejected the 0.618 Fibonacci retracement level, confirming buying pressure from this key zone.
Key Observations:
🔹 Uptrend Intact – Higher highs and higher lows ✅
🔹 AB=CD Completion – Potential bullish price reaction ✅
🔹 0.618 Fib Rejection – Strong demand zone ✅
🔹 Resistance Level Ahead – Awaiting breakout confirmation
Trading Plan:
If #BTC breaks above the resistance level, I’ll be looking for a long trade setup with proper risk management.
🔹 Invalidation: If #BTC breaks below the Fib level, I’ll reassess my bias.
🔹 What are your thoughts? Will #BTC break out or face rejection? Drop your opinions in the comments!
🔹 Like, Comment & Follow for more trade setups and market insights!
Xauusd next move XAUUSD GOLD | Update H4 Timeframe 🙌
- This Analysis is based on Educational Purposes based on Trendline Technical aspect
- We set the trendline accordingly on based of previous All time Highs
Although gold achieved new peak moment
- In our previous Commentary we also been observing the point at 2984
- This is a new Setup on which if candlesticks closed below our trendline we are expecting retracement levels and upcoming benchmark would be 2954.5❗️

Where will gold go after the CPI news? Gold price trends today, The US CPI data yesterday was 2.8%, compared to the previous month's 3%, showing a slight decrease of 0.2%. This has led investors to strongly anticipate that the Fed will cut interest rates twice in 2025.
Our next trading plan, following the successful trading session on March 11th, will be:
Buy when the price has formed a peak and retraced to the 61.8% Fibonacci level (20930-2933). SL (Stop Loss): 5 points, TP (Take Profit): open.
Aggressive Buy when the price is more favorable in the Fibonacci (38.2%-50%) zone (2920-2925). SL: 5 points, TP: Open (maximum of 3 orders for this zone)
Thank you for your review, and I hope you'll stay longer by pressing Follow.

Usdjpy analysis This chart represents a technical analysis of USD/JPY on the 1-hour timeframe from TradingView, outlining potential price movements based on key support and resistance levels.
Support Level: Marked around 147.175, this level is expected to act as a strong demand zone where buyers might step in if the price retraces.
Current Price: USD/JPY is trading around 148.262, showing signs of bullish momentum.
Potential Price Movement: The chart suggests a possible pullback toward the support level before resuming an uptrend.
First Target: Positioned at approximately 149.678, this is the next key resistance level where price action might encounter selling pressure.
Second Target: Identified near 151.002, indicating further bullish continuation if the first target is broken.
Outlook:
The analysis suggests a bullish bias, but a retracement to support may occur before a potential breakout. Traders may look for confirmation signals before entering positions. The volume profile on the right shows strong activity around these levels, reinforcing the importance of these key zones.

A plan for pullback XAU as dump money short termShort term on chart saw the dump money in sell trend.
Looking opportunity Long for completed this pattern at 2685-2605 in extend.

Eurusd outlookThis chart represents a technical analysis of EUR/USD on the 1-hour timeframe, highlighting key support and resistance levels.
Key Analysis:
Resistance Level: Marked around 1.09500, this level serves as a potential selling zone where price may struggle to break higher.
Support Level: Identified near 1.08000, this is a demand area where buying pressure may emerge.
Current Price: EUR/USD is trading at approximately 1.09183, near the resistance zone.
Expected Price Movement: The analysis suggests a potential rejection from resistance, leading to a downward move toward the support zone.
Outlook:
The market structure indicates a possible bearish retracement from resistance. If the price fails to break above 1.09500, a short-selling opportunity may arise with a target around 1.08000. However, if the resistance is broken, further upside momentum could be expected.

KASPA: Soon to switch to being greedy again.Back into the green zone.
Stepping up DCA-accumulation into a more aggressive mode soon, expecting KAS to fall to as low as ~5.4 cents.
FG oscillator is still orange (bearish) on the weekly.
10 bps upgrade and activation incoming. 4 smart contract layers being developed. Tier1 exchange listings to look forward to. KII (Kaspa industrial initiative), and so on.

Exide Pakistan - LongExide is making multiple bullish patterns
1- Inverse head and shoulder
2- Cup and Handle
3- Bullish Flag
4- ABCD pattern
It may go down to 670 at the worst, but may also revert back from here to complete CD leg which may touch 1600.
Short term target: 1100
Medium term target: 1600
Long term target: 2000

What do you think about today's gold price trend on March 10th?t is likely that today, Monday, gold will break below the 2900-2905 support area to move down towards the 50% Fibonacci level to liquidate all BUY orders in the 2880-2900 zone, and will then adjust strongly upwards again in the mid-week and weekend sessions
Wishing you all profitable trading.
RioNguyen


Bitcoin - Historical trap (122k then 60k in 2026)Bitcoin is in the final stage of the bullish cycle, and we want to look for the best price to sell and prepare for the 2025/2026 bear market! The best price to sell Bitcoin is at the 1.618 FIB extension or at the main long-term 2017-2021-2025 trendline. This is exactly at 122,069, as we can see on the chart.
Many people are saying that it's over for Bitcoin and that Trump's post was a giant trap. I think we will see a final 2 waves on Bitcoin to form an ending diagonal wedge pattern (1-2-3-4-5). Bitcoin is in wave 3.
I am also bullish because of the 50-week moving average. Historically, Bitcoin reacted to this MA very precisely. I always recommend using simple moving averages with 20, 50, 100, and 200 periods because this is what the big players are using as well. These MAs are very popular among giant institutions, banks, and investors.
I think a huge altseason should kick in anytime soon now because Ethereum is very undervalued, and BTC.D needs a break as well. ETH could be a much better choice for the final 2025 pump.
Write a comment with your altcoin + hit the like button, and I will make an analysis for you in response. Trading is not hard if you have a good coach! This is not a trade setup, as there is no stop-loss or profit target. I share my trades privately. Thank you, and I wish you successful trades!

#BTC - Major Breakdown! Next Levels?🔸
Bitcoin has dropped to $80K, confirming the anticipated correction. The key question now: Will BTC hold or continue lower?
🔸 Support Zones to Watch:
$80K is a temporary support, but a weak one.
Next Major Support: $75K - $72K → If BTC loses this zone, expect a rapid drop to $60K-$50K.
🔸 Resistance Zones:
If BTC bounces from $80K, expect resistance at $85K-$90K.
$90K-$99K remains a trap zone—breakout traders should be cautious.
🔸 Bearish Outlook (if $80K breaks):
✅ First target $75K
✅ Second target $72K
✅ Final major support at $60K
🔸 Bullish Scenario:
BTC must reclaim $85K-$90K to regain momentum for $100K+.
Failing to hold above $85K keeps bearish pressure active.
A fake bounce is possible, but BTC is at risk of deeper correction. If $80K fails, expect $75K-$72K next. Keep risk management tight!


AB=CD on Chevron. CVXEarly bounce off support now, full steam ahead to the upside , crossing vWAP and US in the second last candle. Now MIDAS crossed. Below oscillators have or are about to turn bullish, reflective of the upgoing candlesticks. This is an AB=CD as far as I'm concerned and Kennedy channeling for stationary goals in any parallelogram structure applies.

Eli Lilly Hit Resistance. LLYMy last idea on LLY proved to be very profitable, so here are the early signs of a pivot at hand. Technically, the indicators flipped almost in unison, MIDAS crossed. And just look at that fat bearish candle setting the tone. It is this constellation of factors that gives one confidence to profit from the plunge. Strap yourselves in.

AUDUSD: Wait for AB=CD pattern to get completed before buying! AUDUSD is currently making AB=CD pattern where AB pattern already formed, however, for CD pattern to be completed we need to wait NFP data to be published which will give inside data of future trend.
Like and comment for more
Thank you
❤️

