total2 altcoins #Altcoins need to bounce off current zone for a #Altcoins need to bounce off current zone for a full reversal!
countdown to recovery
ALTS

People Used To Get Scared - BTC / USDMorning folks,
Read the chart, it contains all information.
I figured since I didn't update my inverted Adam & Even pattern chart much I'd just create a new one, but check it out, its playing marvelously.
Trade thirsty!

Conspicuous - MANA / USDTEvening fellow traders,
Every now and then I ride waves on MANA.
This time it won't be different, as I am already in it.
But I'm looking for an extra touch, that outta the box type thing and buying an extra chunk between the prices shown in the chart.
Please take advantage of this if you get the chance, and let's make a big chunk of money together!
Trade thirsty, my friends!

finally altcoins ready for strong bounce btc Dominance Finally Showing Signs Of Weakness, Formed Rising Wedge, Rejected From Rang,s Top, Counter Trendline Breakout Confirmed, Expecting Move Towards Ascending Trendline In Coming Days, And In Results Altcoins Finally Will Get Some Relief, However Once Ascending Trendline Got Cleared, Alts Can Bounce Sharply After That.

DODO Local trend. 19 04 2025Logarithm. Time frame 3 days. No need for less. Capitulation zone or complete scam. From the breakthrough of support of the long-term horizontal channel -68%. For key local resistance zones in cases of breakthrough of resistance of the descending wedge, percentages for clarity are shown (similarly, as in the previous idea of this coin, reaching the specified % and reversal and super decline).
Secondary trend and this zone in it, for understanding the zone and risks of work.
DODO Secondary trend. 19 04 2025
Long-term as for me, it will be a scam, like all the rest.
Locally you can work with a wedge (breakthrough) and the first targets to the mirror resistance level. Sometimes pumps are “stick” into the depth of the previous channel, but not above its previous resistance level. Probably, these should be your last local-medium-term targets.
The maximum where I can pump crypto wrapper in the future for the big cryptocurrency hype, if it doesn’t crash earlier, is to the median zone, no higher than 0.666. But, as for me, it is more rational to work with local, maximally down-to-earth goals , observing risk and money management.

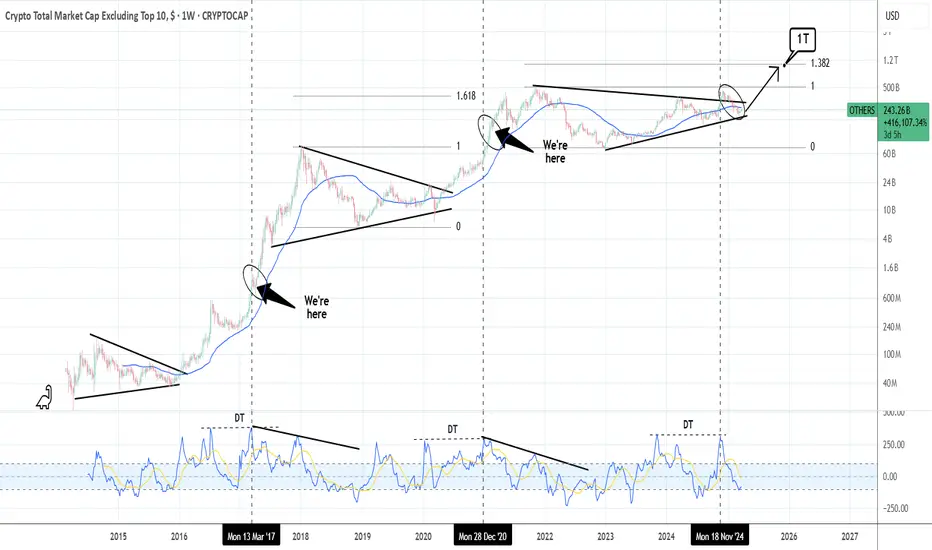
ALTSEASON: Is it really just around the corner?The Crypto Total Market Cap (excluding the Top 10) seems to agree. And it's simply because the price has already broken past the Cycle's Triangle and despite the correction, remains supported on the HL bottom trendline. According to the 1W CCI we are currently well in line with the previous two Cycles and even though the market is unlikely to reproduce the strong returns of especially the first Cycle, it does suggest that there is one last (All Time) High left. A mere 1.382 Fibonacci extension test, will give us the much sought 1 Trillion USD target.
## If you like our free content follow our profile to get more daily ideas. ##
## Comments and likes are greatly appreciated. ##
DODO Local trend. 19 04 2025Logarithm. Time frame 3 days. No need for less. Capitulation zone or complete scam. From the breakthrough of support of the long-term horizontal channel -68%. For key local resistance zones in cases of breakthrough of resistance of the descending wedge, percentages for clarity are shown (similarly, as in the previous idea of this coin, reaching the specified % and reversal and super decline).
Secondary trend and this zone in it, for understanding the zone and risks of work.
DODO Secondary trend. 19 04 2025
Long-term as for me it will be a scam, like all the rest.
Locally you can work with a wedge (breakthrough) and the first targets to the mirror resistance level. Sometimes pumps are "stick" into the depth of the previous channel, but not above its previous resistance level. Probably, these should be your last local-medium-term targets.
The maximum where I can pump crypto wrapper in the future for the big cryptocurrency hype, if it doesn’t crash earlier, is to the median zone, no higher than 0.666. But, as for me, it is more rational to work with local, maximally down-to-earth goals , observing risk and money management.

ALTSEASON | ALTS | BUY Zones SummaryOver the past few weeks I've been gradually analyzing the alts that I believe have great potential for the next cycle.
These include:
✅ ATOM
✅ Litecoin
✅ Fantom
✅ Doge
✅ SUI
✅ SHIB
✅ DOT
✅ PEPE
✅ BNB
✅ Tron
✅ The Graph
✅ Render
✅ Maker
✅ AAVE
Here's your quick video summary on ideal buying zones for the above altcoins. Enjoy!
____________________________

Altcoin Breakout or Breakdown? Key Levels Ahead🤔📉📈 Altcoin Breakout or Breakdown? Key Levels Ahead 🚨🧠
Hey Traders! Let’s talk about what’s really going on in the altcoin scene 👀
We’re still in a heavy Bitcoin-dominated market (BTC.D at 64%), but TOTAL3—the market cap for altcoins excluding BTC and ETH—is setting up for something big.
📊 We’re currently trading in a tight range between $740B support and $779B resistance—both key Fibonacci levels. Sound familiar? That’s because we were in the exact same range back on Nov 24, right before a major move! 🌀
➡️ A confirmed breakout above $780B could send TOTAL3 surging toward the next major resistance at $929B.
⬅️ But if $740B breaks, we’re eyeing a move down to $641B, where crucial trendline support comes into play.
Zooming out, altcoins are still licking their wounds from the trillion-dollar highs. The space has been wild: Trump tokens, meme coin madness, the OM token collapse—volatility is the name of the game. But are you still bullish on real, utility-driven projects?
💬 Let’s discuss:
Are you riding this altcoin wave, or sitting on the sidelines until the storm passes?
Do you have faith in 'Crypto' and can the good projects make history, or will the market suffer indefinitely from Presidents launching meme tokens, Fartcoins and Pumpfuns dominating a space with no ethics or loyalty?
🔗 Check the chart and share your thoughts below.
One Love,
The FXPROFESSOR 💙

ETH | Either OR Scenario | ALTSEASONThe previous update was on the current low that ETH hit a couple of days ago, and what happened the previous time we hit that price:
POTUS Donald Trump signed a bill that exempts DeFi platforms from reporting on their clients' taxes, unlike traditional brokers. This may explain the bullish sentiment we're observing across the market currently.
💥 ALTS Part 1 and 2 below, stay tuned for Part 3 ! 💥
____________
BINANCE:ETHUSDT

XLM/USDT Secondary trend. 14 04 2025Logarithm. Time frame 3 days. After a big pump "with a stick" (so that the "waiters" who want "a little cheaper" would not have time to buy) +8.5X from the accumulation zone of 2.4 years, now a descending wedge is forming on the rollback, similar to 2017. Breaking through its resistance (breaking the downward trend) - the second wave of price growth:
1) through consolidation and sideways movement (cutting the zone, dumping "in waves").
2) aggressive pump as in 2017 "with a stick" and entry into the main distribution zone (late autumn 2025)
The previous idea of the secondary trend was published on 14 01 2024 Exactly when the position was being collected in the horizontal channel in the 4 zones shown, as well as the reversal zone and the percentage of this first strong pump (under XRP).
XLM/USDT Secondary trend. 14 01 2024
XLM/USD Main trend. Timeframe 1 week. Channel. Publication in 2022.
Local wedge breakout zone.

XRPUSD Leading the Alt Market UpwardsXRP a coin that has been bearish for so long is now at the forefront of the bull market for altcoins
It has made the first strong bull move out of the retro altcoin market
Once BTC moves XRP will move

STRK Main Trend 12 04 2025Time frame 1 week for clarity.
Descending channel is the main trend.
Descending wedge is a secondary trend.
Showed the mid-term percentage for targeting potential profit within the channel after breaking through the wedge.
The price reached the lower zone of the descending channel of the main trend -96%.
This is conditionally the bottom for similar assets of such liquidity -95-98% . You can even say the minimums of minimums, beyond which there is only a complete scam, which is probably not distributed as an asset. Throughout the history of the formation of the descending channel, the trading volume was supported, many buybacks. The same volume is also pressuring to buy with “discounts”, what was previously poured "investments for billions of dollars" on Twitter during the listing.
Secondary trend, descending wedge and bearish trend break zone.
Time frame 3 days.

ALTS may be starting an explosive rally.This chart shows the Crypto Total Market Cap (excluding top 10) dominance trading inside a Megaphone pattern that just bottomed. The bearish wave is identical to the first that made a double bottom LL on August 5th and kickstarted an altcoin surge that peaked on December 7th 2024. The first target of this setup is 9.20%.
## If you like our free content follow our profile to get more daily ideas. ##
## Comments and likes are greatly appreciated. ##

Ethereum Failing against BITCION ? Here is a valid reason why.
In a world being thrown upside down and sideways and Markets Rising and falling and Rising again on a few words and actions, there is one Shining Light in the world of Crypto
Ethereum - And its constant DROP when compared to BITCOIN
It is possibly the Only coin in the top 10 that has failed to rally at least once, to any significant degree since 2023, when nearly everything else took off.
It currently sits at the same price it was in May 2020 !
It reached its ATH in Nov 2021 and ever since then, has fallen in what is becoming a parabolic reverse curve;
All this despite coins like BASE, Coinbases Crypto, being based on that ETH Layer.
This is pretty well ALL down to the adoption of BITCOIN by corporate ventures, keeping the Bitcoin Dominance high.
I mentioned in a post back in 2023 ( maybe here but certainly on X) how BTC could be used in the "Financial Wars" to come, as a means to weaken and scupper ALT coins.
They tried to Destroy crypto, they failed and so, by allowing Bitcoin ETF's etc, BTC dominance remains High and ALTS Fail
And that is EXACTLY what we have seen so far. As Corporations continue to Buy Bitcoin, Dominance remains high..... It isd as simple as that.
And this ETH BTC chart shows that very clearly.
The REAL question is why the ETH ETF's failed so much.
Maybe that is because MANY people realised the "energy behind Ethereum" - The American crypto , Protected by Gensler and predecessors. The Not really Descentralised structure and power if you hoold a LOT, something not many independants can do

Is there any chance for an ALTSEASON now??Just some chart fun. Do you think the pattern will be completed and the current altcoin Bull Cycle will follow the previous two? Do you think there will be a new Altseason amidst the tariff chaos?
Whatever happens, the 1W MA100 (green trend-line) has to hold (close 1W candles above it) if that would be the case and it just got breached.
-------------------------------------------------------------------------------
** Please LIKE 👍, FOLLOW ✅, SHARE 🙌 and COMMENT ✍ if you enjoy this idea! Also share your ideas and charts in the comments section below! This is best way to keep it relevant, support us, keep the content here free and allow the idea to reach as many people as possible. **
-------------------------------------------------------------------------------
💸💸💸💸💸💸
👇 👇 👇 👇 👇 👇

FIFA WORLD CUP HISTORIC ROARING 20s QE Restart ScenarioBenjamin Cowen has been truly amazing with his analysis. As per monetary policy it's definitely too early to call the start of QE but we're on the right track.
it almost feels like the true Altseason will start when the FIFA World Cup starts. Every single scenario matches that theory. If you also pay attention to Algorand for instance, it's mimicking the early days of XRP. XRP is also mimicking the early years of Apple.
Can you imagine a scenario where XRP hits 120 dollars and Algorand 1200 dollars? I know I know the market caps etc. But so far it does feel like the markets are brewing for a truly historic roaring 20s scenario that could last for years.
Big question is, who has the first mover's advantage now and needs to catch up in the mean time?
I'm looking at tiny caps like Metastrike, and institutional coins like VeChain. China has already started QE so you may want to play around with VET while the entire market is boring.
JasmyCoin I can't tell yet, it could be but it has that annoying monitoring tag and in my case I've already survived 7 delistings already (dock, ooki, troy, gifto, gemie, kingdomverse, dreamsquest), so not touching it for now.
Looks very promising to be honest. Gotta have a long term vision here.

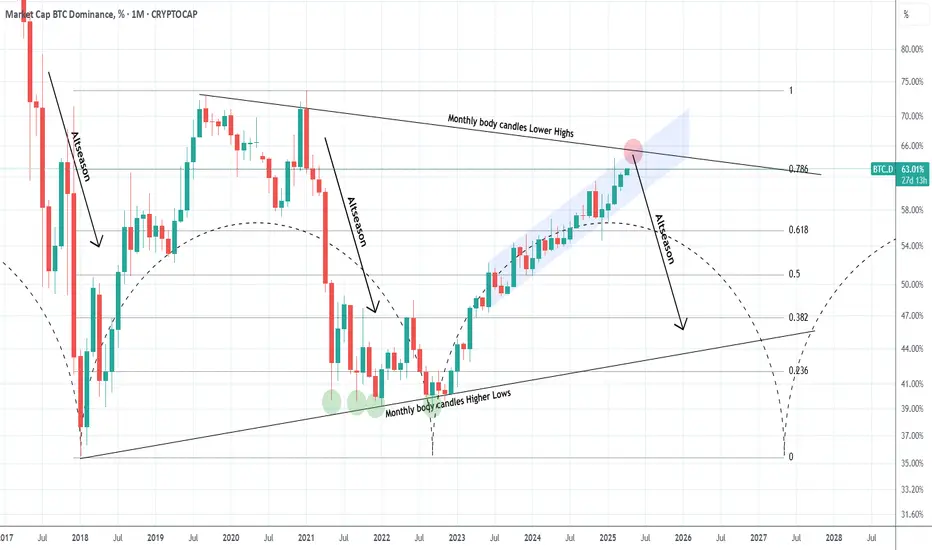
Is BTC Dominance about to reverse and start an Altseason?Well its undoubtedly what the crypto investor wants and what the market would have technically given in February if it wasn't for the tariffs trade war. Bitcoin's Dominance (BTC.D) is trading within a Triangle and February's test of the 0.786 Fibonacci retracement level was the technical level that should have given a rejection.
That rejection technically starts the Altseason which was dominant via a Bearish Leg both in 2017 and 2021. So far though both February's and March's 1M candles closed below the 0.786 Fib and April has an opportunity to even test the monthly body candles Lower Highs, which is the top of the Triangle. This is the last level that a rejection can be technically given.
Can this start an Altseason?
-------------------------------------------------------------------------------
** Please LIKE 👍, FOLLOW ✅, SHARE 🙌 and COMMENT ✍ if you enjoy this idea! Also share your ideas and charts in the comments section below! This is best way to keep it relevant, support us, keep the content here free and allow the idea to reach as many people as possible. **
-------------------------------------------------------------------------------
💸💸💸💸💸💸
👇 👇 👇 👇 👇 👇
AAVE Trying To Bottom 🚨AAVE is looking beautiful 🚨, very interesting chart for more upside
and is now into support and trying to bottom
Do not miss out on AAVE as this is a great opportunity
Watch video for more details

ALTCOINS has already started the new parabolic rally.Altcoins (excluding top 10) are repeating the 2015-2017 market structure.
Based on the 1week RSI we are at levels similar to July 2017 when the market kickstarted the final parabolic rally of the Cycle.
We expect the market to reach the $1 Trillion market cap mark before the end of 2025 and peak the Cycle there.
Follow us, like the idea and leave a comment below!!

SNTUSDT Analysis: Avoid Getting Stuck in Mid-RangesI don’t want you to get lost in the mid-range areas . For SNTUSDT, I believe the blue box is a high-value demand zone . Given that overall market conditions are weak , I’ve identified a lower entry point that aligns with a safer and more strategic approach.
The blue box holds significance from multiple perspectives . I used heatmap , cumulative volume delta (CVD) , and volume footprint techniques to determine this precise demand region where buyers could potentially regain control.
Key Points:
Avoid Mid-Ranges: Focus on clear demand zones to avoid indecision.
Blue Box: A critical demand zone identified as a potential buyer area.
Techniques Used: Heatmap, CVD, and volume footprint for accuracy and precision.
If you'd like to learn how I use these tools to pinpoint such precise demand zones, just DM me!
If you think this analysis helps you, please don't forget to boost and comment on this. These motivate me to share more insights with you!
I keep my charts clean and simple because I believe clarity leads to better decisions.
My approach is built on years of experience and a solid track record. I don’t claim to know it all, but I’m confident in my ability to spot high-probability setups.
If you would like to learn how to use the heatmap, cumulative volume delta and volume footprint techniques that I use below to determine very accurate demand regions, you can send me a private message. I help anyone who wants it completely free of charge.
My Previous Analysis
🐶 DOGEUSDT.P: Next Move
🎨 RENDERUSDT.P: Opportunity of the Month
💎 ETHUSDT.P: Where to Retrace
🟢 BNBUSDT.P: Potential Surge
📊 BTC Dominance: Reaction Zone
🌊 WAVESUSDT.P: Demand Zone Potential
🟣 UNIUSDT.P: Long-Term Trade
🔵 XRPUSDT.P: Entry Zones
🔗 LINKUSDT.P: Follow The River
📈 BTCUSDT.P: Two Key Demand Zones
🟩 POLUSDT: Bullish Momentum
🌟 PENDLEUSDT.P: Where Opportunity Meets Precision
🔥 BTCUSDT.P: Liquidation of Highly Leveraged Longs
🌊 SOLUSDT.P: SOL's Dip - Your Opportunity
🐸 1000PEPEUSDT.P: Prime Bounce Zone Unlocked
🚀 ETHUSDT.P: Set to Explode - Don't Miss This Game Changer
🤖 IQUSDT: Smart Plan
⚡️ PONDUSDT: A Trade Not Taken Is Better Than a Losing One
💼 STMXUSDT: 2 Buying Areas
🐢 TURBOUSDT: Buy Zones and Buyer Presence
🌍 ICPUSDT.P: Massive Upside Potential | Check the Trade Update For Seeing Results
🟠 IDEXUSDT: Spot Buy Area | %26 Profit if You Trade with MSB
📌 USUALUSDT: Buyers Are Active + %70 Profit in Total
🌟 FORTHUSDT: Sniper Entry +%26 Reaction
🐳 QKCUSDT: Sniper Entry +%57 Reaction
I stopped adding to the list because it's kinda tiring to add 5-10 charts in every move but you can check my profile and see that it goes on..

Good r:r on alts.I have made market watch baded on indicator on main screen. It aggregate view on main alts. Fat dot is bullish. Thin coloured dot is signaling possible entry. Gray dot is bearish. No dot is just downtrend. Solid line is showing how market is performing. Now its valie is 1. In the recent past it was good place to enter long trades. Marked with yellow lines. Be aware. If this is entry into bear market there will be dead cat bouces so manage your risk.

XRP in BIG TROUBLE | BearishXRP is known as the "PUMP and DUMP" alt for a reason.
If you look at this chart from the macro timeframe, it clearly shows how XRP dumps hard after every parabolic increase - and this isn't even the entire price history..
The lower highs and lower lows we currently observe are not helping its case, either.
Pulling up the technical indicator in the weekly timeframe and we see a clear SELL - indicating that the price/trend has turned bearish.
And from what we know of XRP - it's likely that the price will drop ALL the way back to the lows, aka the beginning of the parabolic rally - possibly even further down.
______________________
BINANCE:XRPUSDT

#Altcoins running it!Altcoins index OTHERS was rejected from the uptrend support and is then preparing for another run
