AAPL AMD NVDA AMZN TSLA 8/23 jtgladiator #thestratWe are looking for continuation on the swings we entered on 8/22. If there are any reversals to the upside, be sure to secure put profits and take calls
NASDAQ:AAPL chart www.tradingview.com
AAPL Enter calls > 169.86 watch for reversal off gap or this level for puts
AAPL Enter puts < 167.14 for gap fill down. Watch for reversal here. PT 165 PT 163
NASDAQ:AMD chart www.tradingview.com
AMD Call swing > 95.02 with PT1 99.25 - not likely imo
AMD finally broke the double inside weekly to the downside. Swinging them 85p all the way out to 9/16 or longer
NASDAQ:NVDA chart www.tradingview.com
NVDA Enter 178c > 175.58 make sure BOH. Watch for reversal
NVDA puts enter 168p < 170.30. Be aware of reversal. Possible Gap fill to 164.24. PT for weekly is 164.78. Grab 9/2 or 9/16 :p
Or grab for earnings lotto
NASDAQ:AMZN chart www.tradingview.com
AMZN Grab calls > 136.32 or puts off the rejection pt 138 141
AMZN Grab puts < 132.85 for huge swing with PT of 120 and a gap fill all the way down
NASDAQ:TSLA chart www.tradingview.com
TSLA Call Swing 920c > 877.20 - watch for reversal pt 901 944
TSLA Put Swing 800p < 858.90 855 838 785
NYSE:BAC chart www.tradingview.com
BAC Daily Swing Calls BOH 34.75 PT 35.30 36.00
BAC D/W put /swing < 34.45 PT 34.15 33.40 Swing 8/26
-jtgladiator
AMZN

AMZN Technical Update 8/23/22🔸️Ticker Symbol: AMZN 🔸️Timeframe: 4 Hour 🔸️Investment Strategy: Long
TECHNICAL ANALYSIS: AMZN is primed for an increase in value as long as we can continue in this bull trend. The price of AMZN is currently testing the bottom deviation level on our regression trend indicator which has acted as a strong level of support in the past. We also have our white line on the bottom dashboard representing money momentum in the green buying stage or accumulation stage which does indicate we could see an increase in value as long as we are heading in an upward direction. The take profit area on AMZN if we do continue in this bull trend would be approx. $140 which is the strongest level of support. Thank you for watching. Have a great day!
🔔 Follow for daily stock, crypto and forex technical analysis.
⚠️ Trading is risky, and I understand nothing is guaranteed. Proper risk management should be in place at all times to minimize losses. Please consult a financial advisor before trading. All Inclusive Trading LLC is not a financial advisor and may not be held liable for any losses which may occur.


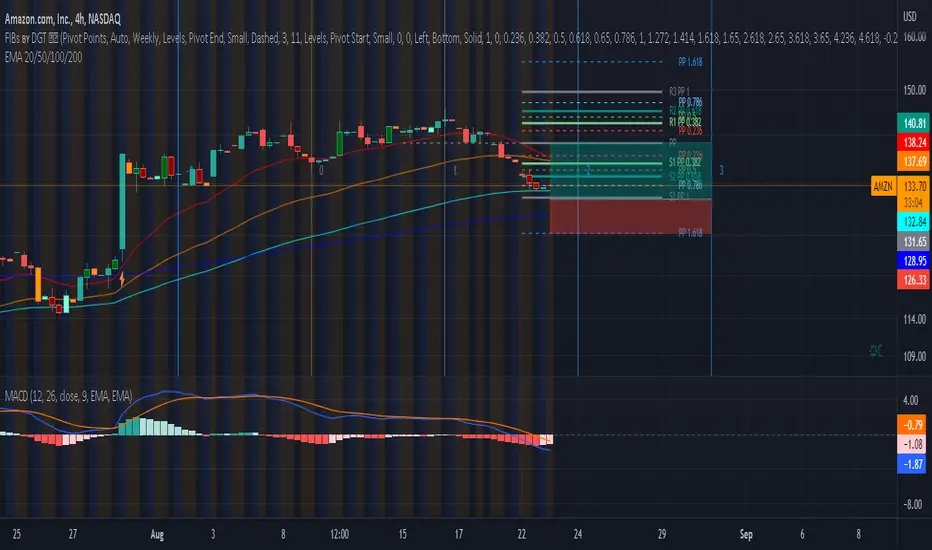
AMZN- Bullish PositionCurrently trading below 20 and 50-day EMA moving average investors can see that the underlying share price of amazon is undervalued. Valued at $133.35 AMZN is trading in line with its 100-day EMA average, it’s important to mention that there is still a strong possibility that the stock will fall even further in line with it’s 200-day EMA before bullish corrections occur. Regardless these technical signals indicate to investors that we should anticipate bullish momentum for this stock.
When looking more closely at the stock and its performance, Fibonacci retracement pivot points shows investors that it’s currently trading at a strong support level of 0.786; further supporting this undervalued and bullish notion. Investors should anticipate corrections towards its resistance level. Investors should also take due care to the strong possibility that the bearish sell trend might reach a stronger support level before bullish corrections occur.
Based on the above technical indication, we have set a buy price in line with the Fibonacci’s lower 1.00 support pivot. We have also set a sell price just above the 20-day EMA level. Based on Fibonacci, we have set a sell price in line with the central PP level, in between it’s resistance and support.
AMZN | Bearish still potentially continueAmazon is one of growth stocks with more than 20% growing sales per year. This growth sales likely will continue in future potentially with larger reached customers by Amazon. I do not have any significant complaint about the fundamental of Amazon, except for the high valuation of stock. According to the lowest P/E in the last 7 years, US$ 109 seems reflected the P/E. Probably that is the reason, AMZN rebounded around 101.87 lately.
But, technically, I still see bears pressure strong on the AMZN. And AMZN still has a high chance to breakdown 101.87 and going lower. Right now, AMZN moving sideways and has a high chance to test again near resistance around 125-129. Only if bulls can break the resistance, and maintain price above it, then we can expect AMZN will stop the dropping. Otherwise, AMZN is continuing going lower and making P/E lower and more attractive to investors.

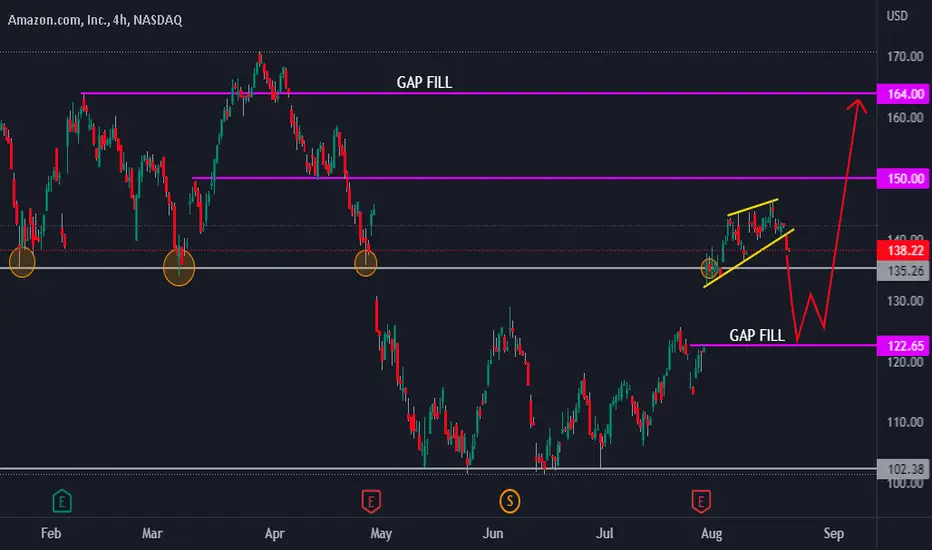
2X $AMZN 1D Tech. Analysis!AMAZON is coming out of a small rising wedge; we can see a retracement of the 20% push up, go fill the gap around the $123 area. Then there will probably be a bullish confirmation to continue the push up to fill the gap area around $164
AMZN on Critical support Entering buy area around 138.. Entry can be lowered since we are now sitting on major support, providing a better R:R ratio.This horizontal levels must hold the following days.. One could even think of selling a part at 144.5 and holding the rest to 150 area. Althought the market is looking quite weak, breakdown volumes havent been so high. please comment your thoughts.NFA

AMZN H4: 30% CORRECTION PT BEARS 90 USD SHORT IT(SL/TP)(STOCKS)Why get subbed to me on Tradingview?
-TOP author on TradingView
-15+ years experience in markets
-Professional chart break downs
-Supply/Demand Zones
-TD9 counts / combo review
-Key S/R levels
-No junk on my charts
-Frequent updates
-Covering FX/crypto/US stocks
-24/7 uptime so constant updates
AMZN H4: 30% CORRECTION PT BEARS 90 USD SHORT IT(SL/TP)(STOCKS)
IMPORTANT NOTE: speculative setup. do your own
due dill. use STOP LOSS. don't overleverage.
🔸 Summary and potential trade setup
::: AMZN H4 chart review and outlook
::: maxed out already
::: Currently DISTRIBUTION already completed
::: we broke down on heavy volume
::: this is NASTY looking chart
::: BAD for the BULLS / stay out
::: FED rate hikes incoming / FED PUT is GONE
::: short sell rips/rallies in the throwback move
::: expecting backtest of the recent Distribution Range
::: recommended strategy: SHORT IT / STAY OUT
::: up to 40% correction still possible from here
::: fair value for AMZN is 85/95 USD
::: DO NOT BUY/HOLD here this is NOT A DIP
::: This is stock market meltdown in progress
::: be careful / don't get ran over by the FED
🔸 Supply/Demand Zones
. N/A
RISK DISCLAIMER:
Trading Crypto, Futures , Forex, CFDs and Stocks involves a risk of loss.
Please consider carefully if such trading is appropriate for you.
Past performance is not indicative of future results.
Always limit your leverage and use tight stop loss.

Amazon Bear RetracementSign of Bearish trend continuation
-Candlesticks are moving below MA200
-Magnitude of Downtrend Line B is much stronger than of downtrend Line A, confirming strong bearish trend
-Candlestick fail to stay above MA200 after retracement R1
Strength of Retracement line R2 is stronger than of R1, signifying more uptrend momentum. However, candlesticks might have issues challenging hurdles of 0.618 fib retracement of Line B and MA 200.
Heavy selling might occur around the range of 151 to 164, where there is much higher trading volume. Holders that bought at this range or higher might choose to sell in order to breakeven or recoup losses.(Boxed)
If the expected long-term downtrend continues, Strong support might only be found at 88 to 95 range, where the highest volume have been traded for past 900 days since March 2020. (Boxed)

AMZN LONGLooking for support from EMA 200 1D and previous horizontal support @ 140. Stop Loss 1 ATR on the Daily. Target next horizontal support @ 150, R:R 2.2

AMZN gearing up for gap fill @123The AMZN is showing the exhaustion in the trend and bearish divergence on Daily chart. It has to contributor to the NDX pull back too. so expecting it to fill the gap.
lets see when it comes.

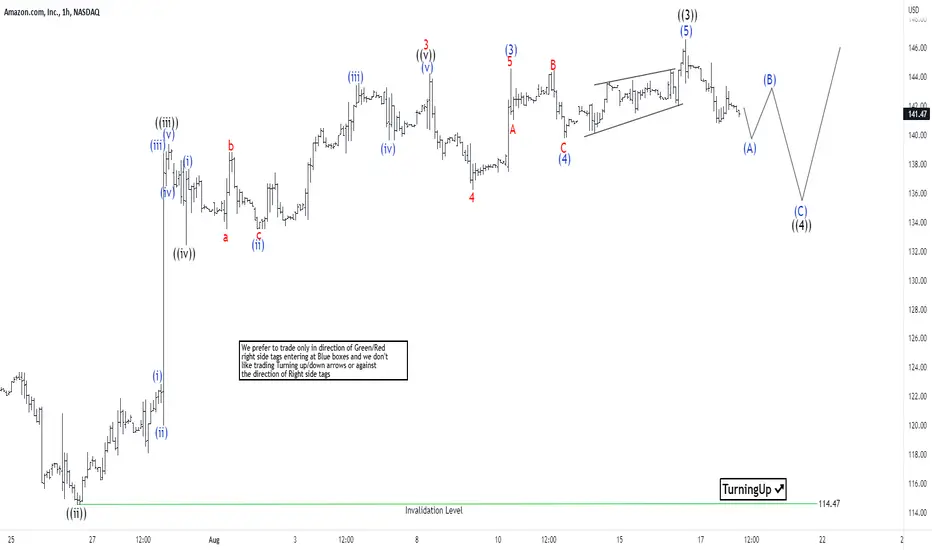
Elliott Wave View: Amazon (AMZN) in Wave 4 PullbackShort Term Elliott Wave View in Amazon ($AMZN) suggests the rally from 5.24.2022 low is unfolding as a 5 waves impulse Elliott Wave structure. Up from 5.24.2022 low, wave ((1)) ended at 128.99 and pullback in wave ((2)) ended at 101.43. The stock has resumed higher in wave ((3)) with internal subdivision as an impulse in lesser degree. Up from wave ((2)), wave (1) ended at 118.09 and dips in wave (2) ended at 102.52.
Stock resumes higher again in wave (3) towards 144.60, and pullback in wave (4) ended at 139.76. Final leg higher wave (5) ended at 146.57 which completed wave ((3)). Pullback in wave ((4)) is in progress to correct cycle from 6.15.2022 low in 3, 7, or 11 swing before the rally resumes. Down from wave ((3)), wave (A) should end with 1 more push lower as 5 waves. Pair should then bounce in wave (B) before turning lower again in wave (C) to end wave ((4)). Per guideline, ideally wave ((4)) ends somewhere at 23.6 – 38.2% Fibonacci retracement of wave ((3)) which comes at 129.4 – 136. Afterwards, the stock should extend higher 1 more leg in wave ((5)). This would complete the 5 waves rally from 5.24.2022 low.
AMZN: BREAK OF TREND LINE COULD SEE $136🔸️Ticker Symbol: AMZN🔸️Timeframe: 4 Hour 🔸️3X Bear Pattern 🔸️Investment Stratey: Short
TECHNICAL ANALYSIS: Amazon is currently trading in an upward trend however on our dashboard we do have our money momentum shifting to the downside along with a "red dot" meaning a key EMA crossover. The middle band has now shifting over to red meaning bear market momentum. If we end up breaking out of this trend the next level of support will be around $136
4X 🟢 Bull Pattern Confirmation Requirements
✅️ Linear Regression Indicator Increasing
✅️ Money Momentum Shifting Higher
✅️ Green Dot: Key EMA Crossover to Upside
✅️ Green Middle Band: Bull Market Momentum
4X 🔴 Bear Pattern Confirmation Requirements
🔻 Linear Regression Indicator Declining
🔻 Money Momentum Shifting Lower
🔻 Red Dot: Key EMA Crossover To Downside
🔻 Red Middle Band: Bear Market Momentum
🔔 Follow for daily stock, crypto and forex technical analysis.
⚠️ Trading is risky and I understand nothing is guaranteed. Proper risk management should be in place at all times to minimize losses. Please consult a financial advisor before trading. All Inclusive Trading LLC is not a financial advisor and may not be held liable for any losses which may occur.

FUBO WEEKLY HARMONICFUBO with a weekly crab harmonic PRZ around 3$ level
first trade at $3.80 C leg a smidge higher than ideal but fits the bill of a Harmonic Crab barring that,
Long @$3.80
T1 @ $15.03
T2 @ $22.74
SL (moved to entry following move up) @$3.80

Buy or Sell ?Uber's strategy to make profit:
1. Charging customers for subscription.
2. Cheating on restaurants more than ever.
3. Reducing the payment to drivers.
And the result of this "smart strategy" is dissatisfying everybody, and ultimately loosing the market!
Capture this image and see me at the end of the year...

Amazon Stock Monthly Chart AnalysisAmazon #AMZN Stock from Nasdaq Monthly Chart Analysis %95 Accurate Trade Setup 🎯 Enjoy🎉 🎊 ( NOTE : The tips of the arrows indicate TP levels ! )

AMZN consolidatingBouncing nicely from support/previous resistance
I like an entry above 140.50 Which will be a break of the trendline.
Target at 144.
A break below support at 138 could give a setup to the downside targeting previous support at 133.50

AmazonOn the Nasdaq correction wave B should lead to the price range of 123-128, there you can safely buy more. At the moment the paper is oversold by momentum and waiting for correction.

Amazon potential sellWill amazon reach 150 area and get rejected on the third touch of the trend line? ill have a sell order for 148.50 down to target level.
its mad to think it would of nearly rallied 50% from the bottom and there was multiple chances after the split to buy the stock. what a miss by myself! I was debating it for too long reading to much into the fun and missed out on a major opportunity.

Amazon could go down around 50% If we see a stock selloff, AMZN could go down to the $1200-$1300 range

AMZN3 confirmations to go short. 1st we have a bearish macd divergence on 1H
2nd We reache dstrong Sup zone yesterday and rejected it. 3rd mrkt is starting to go for a correction. Most of the super trends flipped to sell sign.

Buy AMAZON now!! Huge discount sale for an ecommerce behemoth!
Technical Analysis
- Triple bounce off $101 level with big reaction upwards,
- this region used to be resistance now flipped support.
- Its also the 61.8% retracement level (golden zone for a rebound)
- stochastic RSI was in oversold, now rebounding
Trades:
Short term traders can look for a LONG from current level
For long term traders this is a good region to BUY MORE AMAZON

AMZN Potential for Bullish Continuation | 8th August 2022On H4, with the price moving above the ichimoku cloud and the MACD histogram is above zero while RSI is also moving along the ascending channel , we have bearish bias that the price may rise from the buy entry at 145.05, which is in line with the 61.8% fibonacci retracement to the take profit at 156.74, which is in line with 78.6% fibonacci retracement . Alternatively, the price may drop to the stop loss at 133.77, which is in line with the 23.6% fibonacci retracement .
Any opinions, news, research, analyses, prices, other information, or links to third-party sites contained on this website are provided on an "as-is" basis, as general market commentary, and do not constitute investment advice. The market commentary has not been prepared in accordance with legal requirements designed to promote the independence of investment research, and it is therefore not subject to any prohibition on dealing ahead of dissemination. Although this commentary is not produced by an independent source, FXCM takes all sufficient steps to eliminate or prevent any conflicts of interest arising out of the production and dissemination of this communication. The employees of FXCM commit to acting in the clients' best interests and represent their views without misleading, deceiving, or otherwise impairing the clients' ability to make informed investment decisions. For more information about the FXCM's internal organizational and administrative arrangements for the prevention of conflicts, please refer to the Firms' Managing Conflicts Policy. Please ensure that you read and understand our Full Disclaimer and Liability provision concerning the foregoing Information, which can be accessed on the website.

AMZN Potential for Bullish Continuation | 8th August 2022On H4, with the price moving above the ichimoku cloud and the MACD histogram is above zero while RSI is also moving along the ascending channel, we have bearish bias that the price may rise from the buy entry at 145.05, which is in line with the 61.8% fibonacci retracement to the take profit at 156.74, which is in line with 78.6% fibonacci retracement. Alternatively, the price may drop to the stop loss at 133.77, which is in line with the 23.6% fibonacci retracement.
Any opinions, news, research, analyses, prices, other information, or links to third-party sites contained on this website are provided on an "as-is" basis, as general market commentary, and do not constitute investment advice. The market commentary has not been prepared in accordance with legal requirements designed to promote the independence of investment research, and it is therefore not subject to any prohibition on dealing ahead of dissemination. Although this commentary is not produced by an independent source, FXCM takes all sufficient steps to eliminate or prevent any conflicts of interest arising out of the production and dissemination of this communication. The employees of FXCM commit to acting in the clients' best interests and represent their views without misleading, deceiving, or otherwise impairing the clients' ability to make informed investment decisions. For more information about the FXCM's internal organizational and administrative arrangements for the prevention of conflicts, please refer to the Firms' Managing Conflicts Policy. Please ensure that you read and understand our Full Disclaimer and Liability provision concerning the foregoing Information, which can be accessed on the website.
