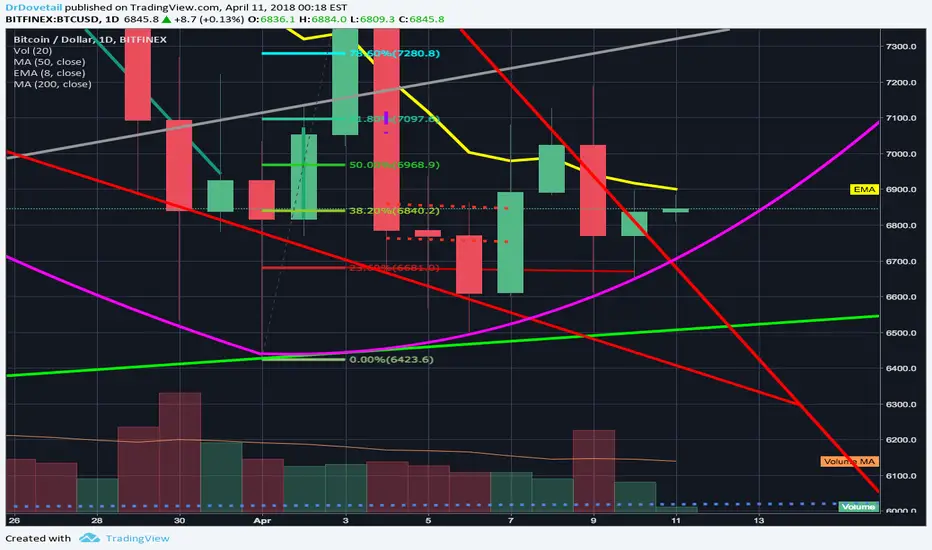
BTC reaching the apex of falling wedge; Adam & Eve still in playA quick update we are reaching a pivotal point as we approach the apex of this falling wedge as well as continuing to follow this potential eve bottom quite precisely. You can see here on the 1 day chart we are currently up outside the falling wedge on the current 1 day candle...like the previous 1day candle, it is finding strong resistance at the t line(in yellow) However this candle has a double reinforced support of both the eve bottoms trendline, and the 23.60% fibonacci retracement line(in red at 6680). This retracement line has served as both very strong support and very strong resistance over the last week or so as the eve bottom has been slowly rounding out and making its turn back upwards, and now that we are above that fib line as well as having it double reinforced with the eve trendline, should prove to provide enough support to keep the price action up out of the falling wedge...which should result in a big bullish volume spike in the coming few days. It could by chance drop back down into the falling wedge and wait until closer to the end of it to breakout which would invalidate and eve bottom but instead likely result in a more traditional standard double bottom considering the falling wedge ends at the exact same pricepoint as february's low....either way we have good odds in favor of one of the 2 double bottoms so I will side with that probability while at the same time of course being prepared for the exact opposite outcome should it occur, where if we dip and stay below 6400 we can trigger a massive head and shoulders that could take us down as far as the 3,000s(less likely in my opinion) If we can find a way to close above the tline on this current candle I'd say we will likely see a big bullish volume spike to confirm the breakout on the follow up candle..for now we shall wait and see.
Apex

Reference Chart for 3 Apex variants, Bolli's, DMI, and VPVR This chart shows 3 variant apex points.
HOW TO USE THIS CHART:
A. Triangles 1, 2, and 3 can be used to identify potential support and resistance levels.
B. Bolli's serve as good reference point to plot feasibility of intra, day or swing targets, up or down, within 1d ATR.
Is your target within these ranges? Confirm logic before you 100x from price at the edge of upper or lower bands.
C. Volume Profile Visible Range on far right to show price where majority of market is trading, and short or long interest at each level. Note VPVR will only show volume of positions on visible candles .
D.Use DMI to judge strength of up or downward momentum based on -Di or Di .
Di (- or +) above value of 25 is considered trending.
E. ADX is blue line within DMI, and can be used to confirm trend strength identified with Di. Note: ADX measures the strength of the trend and tends to go down before reversal. It measures the strength of the CURRENT trend [i.e. ADX at 50 can confirm strength of down or up move. Invest in yourself, do your homework.
www.tradingview.com(DMI)
Don't be fooled in to thinking that money only flows if you can hit the tops or the bottoms.
Trade the range and secure profit on every run up or down.
THE MARKET WILL NEVER RUN OUT OF ENTRIES.
Appreciate the risk.

Litecoin(LTC) Update : Double Truncation & Double Apex.
In a recent movement of LTC/BTC, I observed double truncation pattern and double apex pattern(To say 'Double' is may not be a good word in this situation, but is used for emphasize the pattern is repeated.).
In the chart above, Apex pattern was shown after Truncation pattern, and now the LTC is moving towards the 'e' point on the second Apex. As showed in a first Apex, LTC price can be droped a littlebit more than the 'e' point but price will be rising up soon.
* Personal opinion
I think the price of bitcoin in the current cryptocurrency market is working like the stock price index. Frankly, I do not like this situation but the market movement is very strongly related with the bitcoin price and is true. So, when I analize about altcoin I always try to analyze it through Altcoin / BTC charts.

EthereumClassic(ETC) Update : Viewpoint of Apex pattern.As like as other altcoins, ETC is on a tough price trip. During in few months of declining, the price tried to rise in a while but it soon turn to downtrend again. In this confusion, I have assumed several scenarios for future trend of ETC. And today I suggest a scenario, 'Viewpoint in Apex pattern'.
In this 'Viewpoint in Apex pattern' scenario, ETC is on a 'c' wave. I think the 'c' wave is not completed, and ETC price can go lower lows in a few days. When the price approaches the 'c' point, the MACD line will start curving up.
The important thing in this scenario is that the price trip can be more boring than you think. The chart calculates ETC price trips per day per candle. And the 'e' point at which Apex is expected to end (where the new trend starts) is about the end of June. Given the amplitude is getting smaller, a change in price for about three months may not meet your expectations.

GBPCHF Bearish Continuation!Here we have FX:GBPCHF we can see that the price has slumped recently, currently the price is forming a rising wedge to confirm bearish continuation.

VEN, pending breakout of key apexI think that VEN is currently correcting and squeezing into a key apex which it will break out of. The first impulse wave up appears to be already completed and following a 1-1 extension VEN has the potential for a 40% gain. The blue box represents an early accumulation zone at the 618 fib retracement level, however I would suggest buying in on confirmation of an uptrend following the breakout of the key apex, placing your stop loss below the apex. VEN has already bounced of the 0.5 fib region for its whole wave retracement so I do believe the market sentiment to be overall bullish for VEN.

ICX/BTC Ascending Triangle near Apex (Target 0.0011-0.0013 BTC)ICX is in a bullish ascending triangle with an imminent breakout near the apex. Target is 0.0011-0.0013 BTC.

ETC’s Time To Shine!As we can see on the chart above ETCBTC is trading within the trading year at 2 year lows. The rapid price increase in BTCUSD has pushed this pair down significantly. We expect ETC growth to outperform BTC growth in the first two quarters of 2018 and recover BTC value.

LONG Gold (swing setup)TP 75% 1314-1320Mid range my bias toward price of gold is uptrend because confirmation on 12/12/2016 confirm the down trend is over. Now gold is developing triangle or Apex between range @50% fibo ( swing trade setup)


EURUSD Forecast 240After a nice bearish rising wedge and some consolidation. I'm looking for the next drop around 1.10000

CrossroadsWe are in a crossroads between major trendlines here.
This forms a triangle pattern on which you can apply fib-time lines to predict a breakout (0.764 fib-time).
I added some interesting levels and other trend lines aswell.
How to trade it:
Depending on what side of the triangle (bottom / top)
the price is closer to while approaching the 0.764 fib-time,
you can start scaling into the respective trade.
For buys you can wait for breaks of:
231 level
yellow trend line / H&S neck line
blue triangle top
log downtrend (red)
260 level
For sells you can wait for breaks of:
apex level 218.33
210 level
200 level / triangle bottom
192 level
Targets are based on projections of the widest distance within the triangle, down / up from the apex.
For the up target the absolute value is used, for the down target the % value.
If you have any questions please leave a comment !
Good Luck ! : ]
