GOLD → Correction for accumulation of potentialFX:XAUUSD is growing during the week. The asset enjoys interest on the background of economic risks and dollar correction. After a small correction, the train may move north again
Markets are watching the US-China trade talks, easing fears of a global trade war, as well as Trump's initiatives on the Middle East, weakening demand for the USD as a safe-haven asset. In addition, a rising yen is pressuring the USD, supporting gold.
Investors' focus is on Friday's NFP data, which could influence the Fed's next steps. Attention is also paid to weekly jobless claims and Fed comments. The market is quite aggressive on any drastic action by Trump as this assessment is correlated relative to global risks
Technically, the price is correcting to accumulate liquidity and potential for possible upside. Below are quite strong support areas that could push the price back.
Support levels: 2845-2850, 2830
Resistance levels: 2860, 2872, 2882
As part of the correction in the uptrend, the price may test 0.5-0.7 Fibo as well as the previously broken resistance of the ascending channel. There are no technical and fundamental reasons to break the trend, the growth may continue after a false breakdown.
Regards R. Linda!
Ascending Channel

OMUSDT → Consolidation in a triangle before the rallyBINANCE:OMUSDT is a paranormal coin in this case, as it is one of the few projects that shows bullish dynamics while all altcoins are finding bottom after bottom.
Perhaps the situation partly depends on BINANCE:BTCUSD . If it starts to fall even deeper, nothing and no one will help here. But locally bitcoin is forming a resistance breakout and if the bulls hold this trend, the BINANCE:OMUSDT.P coin may have a bullish driver that can support the bullish movement.
At the moment, the focus is on the triangle (wedge) resistance and the base of the 5.6756 pattern. Two bullish scenarios should be considered: Growth after a resistance breakout or growth after a false breakdown of support.
Resistance levels: 5.9821, 6.30
Support levels: 5.75, 5.6756
At the moment, a consolidation within the triangle boundaries is being formed. But when the resistance is broken, the market may move to the realization phase and the impulse may be quite sharp. Ahead, beyond 6.3, there is no resistance...
Regards R. Linda!

DOGE About to Moon? Yes, But Watch for One Last Dip!Since 2013, CRYPTOCAP:DOGE has been following a massive long-term ascending channel.
Every major pump and dump has played out within this channel.
Right now, BINANCE:DOGEUSDT is forming a similar pattern to the one before its last bull run.
In both cases, you can draw a downtrend line from the previous cycle’s peak.
Before the real breakout (purple arrow), there was always a failed breakout attempt (light blue arrow) followed by a sharp correction.
Last cycle’s correction: -61%
This cycle’s correction so far: -64%
After the first correction, DOGE broke the downtrend line (purple arrow) but then had another 56% pullback, retesting the lower boundary of the descending channel.
If DOGE follows this same script, we’ve already seen a 57% drop as of 2/3.
But is the correction over? Not sure yet.
If there’s one last dip before the real pump, it could drop to the lower boundary of the descending channel.
Based on past support/resistance levels, the buy zone could be between $0.215 - $0.151.
Then comes the dawn after the coldest night—
The party will start suddenly, so hold on tight.
[ Follow me ] for more future script "guesses" like this!
🔴 Bitget 20% Trading Fee Off:
lihi2.com

DE30 Strengthens Within Ascending Channel, next at 652.00?DJ:DE30 remains within a well-defined ascending channel, with price recently rebounding from a key support level. This suggests a continuation of the uptrend, with the next target near 652.00, aligning with the upper boundary of the channel.
A short-term pullback could present a buying opportunity, particularly if bullish candlestick patterns like an engulfing or hammer formation emerge, confirming buyer strength. A decisive move above recent highs could reinforce momentum toward the expected target.
But if we get a break below the channel’s lower boundary, it would invalidate the bullish outlook and signal a potential shift in market direction.

XAUUSD - Gold need correction till golden zone of retracement!Hello Mates!
As we all watching XAUUUSD making ATH from last Two weeks and every time breaking its Higher Highs but here we need a good correction in gold to continue its trend here i have shared my analysis for gold read chart carefully and description.
As gold has made two parallel channels in bullish trend internal and external parallel channels and following respecting external channel for impulsive wave and internal channel for pull back/retest/ and correction.
i have drawn those both channel and marked all levels of movement!
Gold Next Move
Gold needs to take a corrective move till internal channel's down trendline which is very good zone of support and buying zone. where market can react with high volume candle to make a new ATH.
Key Points
Support: 2791
Resistance: 2895
Fib Golden Zone: 2815-2827
OB and FVG Level:2771-2792
Gold will give good move till 2791 and this is my target for sell, and buying zone for gold
if you like my analysis support me and like my ideas

GOLD → Price enters buying zone ahead of NonFarmsFX:XAUUSD resumes gains Friday after brief pause, retesting liquidity accumulation support, but traders cautious ahead of US NFP release
NFP decline may support gold - if the actual NFP comes in below forecast (169K), it will reinforce expectations of an imminent Fed rate cut.
Weaker labor market → pressure on the dollar → gold rises.
Fed and policy:
At 15:00, the Fed's monetary policy report will be released, which could clarify the regulator's future course.
If signaling easing → gold up. If there will be hawkish notes → pressure on XAUUSD, but we should also take into account Trump's policy on economic risks
Conclusion on XAUUSD:
In the medium term there is every chance to reach $3,000, locally it all depends on the news: weak NFP and lack of wage growth could send gold above $2,900.
If the data turns out to be strong → a downward correction is possible
Resistance levels: 2870, 2882
Support levels: 2858, 2848
Technically, the focus is on the 2870 resistance. If the price can break this resistance and consolidate above, this maneuver will open the way to further upside. I do not rule out a retest of the channel boundary or 2858 before further upside.
Regards R. Linda!

GOLD: Correction for potential accumulation.is growing during the week. The asset is performing well in the face of economic uncertainty and a dollar drop. After a minor modification, the train might go north again.
Markets are keeping an eye on US-China trade talks, which are alleviating fears of a global trade war, as well as Trump's Middle East efforts, which are reducing demand for the US dollar as a safe-haven asset. Furthermore, a rising yen puts pressure on the US dollar, which supports gold.
Investors are focused on Friday's NFP report, which may influence the Fed's future measures. Weekly jobless claims and Federal Reserve statements are also monitored. The market is quite aggressive on any radical action by Trump because this evaluation is tied to global concerns.
Technically, the price is correcting to gather liquidity and potential for future gains. Below are some strong support levels that could send the price back.
Support levels: 2845-2850 and 2830.
Resistance levels: 2860, 2872, and 2882.
Trade Active
Gold is testing the previously defined support zone.
The accent is on 2845-2840. If the bulls keep the defense above this zone, it is worth waiting for gains in the short-term.
As part of the upward corrective, the price may test the 0.5-0.7 Fibo level, as well as the previously broken ascending channel barrier. There are no technical or fundamental grounds to break the trend; growth may continue despite a fake collapse.
By Nexus Trades Zone

XAUUSD → Will Retrace till 2802-2794 but after hitting 2835Hello Traders!
As gold has made its ATH 2830 which was also a trendline where gold respect that trend line and down now every thinking for retracement but gold will do a breakout till 2835 as gold done on previous trendline
gold can hit 2835 easily before drop to retracement level of 2794, so for now i am bullish till 2835 in that zone i will see a good entry for sell.
Support: 2802
Resistance:2830
Fib Golden Zone: 2794-2796
Liquidity Zone: 2794
Gold will continue its trend after retracement but we need a good entry for sell almost from 2835

Gold Retracement has begun and will end on the order block.Hello, Traders!
As gold dropped from 2830 and is now trading between 2812-2813, this decline is true and valid till 2772-2773 since I identified significant liquidity, an order block, FVG, and parallel channel trendline support.
So gold should make this extremely serious and genuine move in order to continue the bullish trend.
Support number: 2801-2796.
Resistance: 2830.600.
Order Block: 2771–2778
Fair Value Gap: 2778–2779
Golden Zone of Fib: 2794-2801
We will trade in tiny time frames with other confirmations like morning star or any bullish engulfing candle, with suitable stop loss below order block and liquidity zones.
If you liked my analysis, please support my idea and follow me.

XAUUSD GOLD ⇒ Sellers interested in retesting gold.Hello, Traders!
As we all know, this week gold made ATH with a red candle and also did a retest to 2799, but this retest is not enough for the continuation of the bullish trend. Here I have presented my analysis regarding gold.
Currently, gold is trading at 2799 at the gold support level, as the new week begins in three hours, so gold can do a gap down opening with a strong volume candle, and we can see 2774 in gold because gold is in a strong bullish trend, so it should touch 2774, which is the golden zone of fib to continue its bullish trend.
Support Level: 2758 – 2767
Resistance Level: 2815 – 2819
Fib Golden Zone: 2773 – 2763.
Liquidity Zone: 2730 (strong low)
Because gold is trading in an ascending channel, our aim would be the ascending trendline, but our entry point should be the golden zone of fib.
Do not enter at ATH because it is the initial technical analysis, thus our buy entry is quite dangerous, so we will wait for a retest.
For now, we can take sell trades for scalping, but always utilize SL because SL is better than liquidation, thus I'm in for sell until 2763.
If you enjoy my analysis Please support my concept and follow me for more analysis.
Have a wonderful day, thank you!

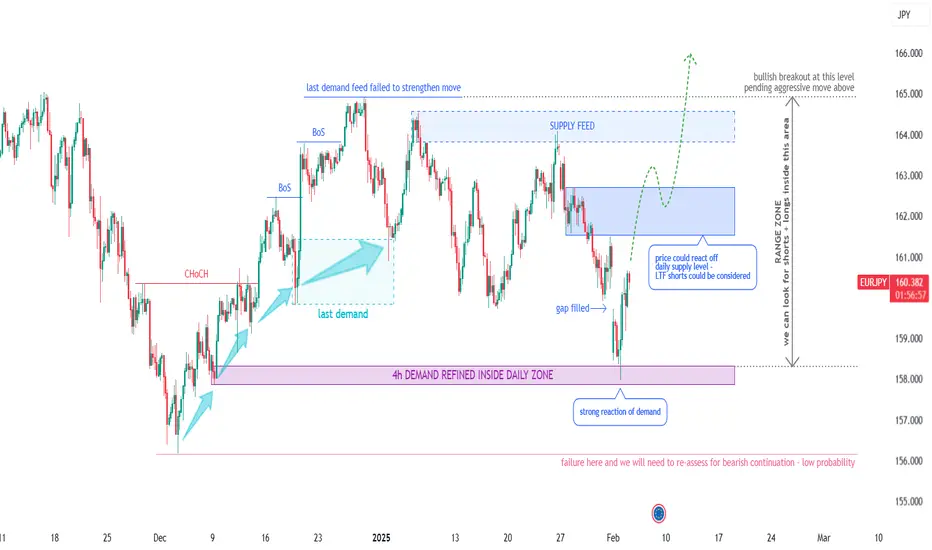
EURJPY Potential Longs - Short & Long Term (Technical Analysis)Technical Outlook:
Looking at previous price movement, we see it's been trending up since August 2024, with the last reaccumulation phase ending in early 2024. We recently saw a demand chain, but the last push couldn't quite hit new highs. Supply then took over, driving the price back down to a daily demand level. At this point, we've seen some strong bullish reactions on the lower timeframes, which is interesting and here's why -
Potential Scenarios & Probabilities:
Scenario 1 (High Probability) – Demand should regain control, leading to a bullish breakout.
Scenario 2 (Medium Probability) - Price could range within the ascending channel for a while.
Scenario 3 (Low Probability) – The bulls might disengage, resulting in a bearish break and continuation thereafter.
Trading Considerations:
Price is currently in a discounted zone within the ascending channel (158.000 – 168.000) . We can look for trading opportunities within this range, focusing on strong supply and demand areas, anticipating the eventual bullish breakout. A long position closer to the bottom of the range could turn into a swing trade. If you're trading inside the range on lower time frames, it's smart to keep an eye on volume, overbought/oversold levels, and relative currency strength.
Final Notes:
With the price moving sideways for a good six months, range trading is definitely a possibility. But the real goal is to catch that bullish breakout when it happens, and it looks like it's getting close. As always, manage your risk carefully, and don't hesitate to take the trade when the setup is right – assuming you've got a solid plan and a clear target in mind.
OANDA:EURJPY
GOLD → Price is susceptible to manipulation. Correction?FX:XAUUSD amid high risks of tariff wars and high inflation reaches a new ATH and trend resistance, but due to manipulation by politicians there is a possibility of a small correction.
Gold price is consolidating above $2,800 after an all-time high of $2,831, awaiting US employment data and Fed speeches. Volatility increased amid manipulations about Trump's tariff policy: first they set tariffs, then a few hours later they cancel them. In a word, “politicians”. Gold is going into correction after a false breakout of resistance of the ascending channel and on the news about temporary suspension of tariff increase by the USA. Overall gold is holding its ground as the Fed remains cautious on rate cuts.
Resistance levels: 2817, 2830
Support levels: 2811, 2801, 2790
If the price breaks 2811 and consolidates below this area, we should expect a correction to 2800 - 2790 in the short term, there is no hint of a trend change, growth may continue from the key support areas.
Regards R. Linda!

Gold Retracement started and will stop on order blockHello Traders!
As gold dropped from 2830 and now trading between 2812-2813 this drop is genuine and valid till 2772-2773 because there i found strong liquidity, order block, FVG and also parallel channel's trendline support.
so gold should do this move which is very real and genuine for a bullish trend continuity.
Support: 2801-2796
Resistance: 2830.600
Order Block: 2771-2778
Fair Value Gap:2778-2779
Golden Zone of Fib: 2794-2801
we will trade in small time frame with some other confirmations like morning star or any bullish engulfing candle with proper stop loss below order block and liquidity zones
if you like my analysis kindly boost my idea and follow me

USDCHF → The bullish trend may get its continuationFX:USDCHF is entering the realization phase after a prolonged correction. A favorable background is created by the uptrend and rising dollar...
The technical outlook on the daily timeframe is very good. The price after breaking the trend resistance tested the previously broken line. The currency pair after the false breakout managed to consolidate above the key point, marking an interim bottom and further prospects.
Technically, the focus is on the resistance at 0.911, if the bulls can overcome this area and consolidate above this level, the currency pair will be able to realize a rise to 0.918 - 0.93.
Resistance levels: 0.911
Support levels: 0.90555
Before breaking the resistance, the currency pair could test 0.90555 due to the liquidity generated below this area. But, the trigger that can provoke further growth is 0.911
Regards R. Linda!

GOLD → Sellers taking interest for retesting in goldHello Traders!
As we all know that last week gold has made ATH with red candle and also did a retest to 2799 but this retest is not enough for continuation of bullish trend here i have shared my analysis about gold
Currently gold is trading on 2799 at gold support level as next week is going to start in 3 hours so gold can do a gap down opening with strong volume candle and we can see 2774 in gold because gold is in strong bullish trend so it should touch 2774 which is golden zone of fib to continue its bullish trend.
Support Level: 2758-2767
Resistance Level: 2815-2819
Fib Golden Zone: 2773-2763
Liquidity Zone: 2730 (also strong low)
As gold is trading in a ascending channel so our target would be the trendline of ascending trendline but our entry should be at golden zone of fib.
Do not take entry at ATH that is the first of technical analysis so here our entry for buy would be very risky so we will wait for retest.
For Now we can take sell trade for scalping but always use SL because SL is better than liquidation so i am in for sell till 2763
If you like my analysis kindly boost my idea and follow me for more analysis
Analysis By: PIPsOptimizer
Have a nice day thank you!

USDJPY → Trump crashes the market, dollar ralliesFX:USDJPY breaks downtrend structure. Monday started unexpectedly for traders with Trump's actions, which gutted localized situations not only in the forex...
The imposition of tariffs, another batch of statements about the Eurozone, BRICS, and also this: “Trump said that the Fed made the right decision last week to suspend rate cuts” produced a corresponding reaction in the market. On the back of inflation expectations, the dollar is accelerating its growth, thus provoking a rally in USDJPY.
Technically, the focus is on the resistance at 155.95 and the support of the previously broken channel, which can be tested before further growth.
Resistance levels: 155.95, 156.6
Support levels: 155.0, 153.6
The price is trying to consolidate in the buying zone, but the resistance at 155.95 is holding the price back from active strengthening. Breakdown and consolidation of the price above this area may provoke growth to the trend resistance.
Regards R. Linda!

XRP Dip to $2.6 Before Hitting $5.5-$6 ?Since December, XRP has been moving within an ascending channel for 3 months.
After hitting the upper boundary and pulling back, it has been consolidating with low volume and doji candles for the past 2 weeks.
Now, it has dropped below the key resistance level.
Technically, CRYPTOCAP:XRP hasn't confirmed a direction yet.
However, there's a high risk that it could suddenly break down below the previous W-bottom neckline (orange line).
It already wicked below it once, and another breakdown could also take it below the ascending channel’s lower boundary.
This move could trigger panic selling, allowing smart money to accumulate more XRP.
Long-term, XRP remains bullish.
Any short-term dip is a buying opportunity.
If it breaks above the ascending channel, it could target $5.5 - $6.
But in this bull cycle, I believe XRP’s upside won’t be limited to just that.
for more future script "guesses" like this!
💰 Bitget 20% Trading Fee Off:
lihi2.com

SWFT is showing bullish strength upon breakout of bullish flag!It appears as though the RSI is cooling off and SWFT may consolidate in the .035c-0.030c range before the next leg up....
One thing I have noticed is the price does not consolidate for too long which indicated a whale or two are gobbling up any SWFT they can get their hands on...
Expect a gap up to the top of the ascending channel in the immediate term.
Where are all my Swifties at!!!
If we do see a sell off I dont expect the price to stay in the 0.03c range for very long.
Don't swim against the current, ride the wave & be brave!

Gold (XAU/USD) Reverses from Resistance – Is a Sell-Off UnderwayGold (XAU/USD) Hits Resistance and Faces Reversal – Is the Sell-Off Beginning?
Gold surged to test the upper boundary of its ascending channel, touching key resistance. However, bullish momentum seems to be fading as sellers step in, pushing prices lower. This could signal the start of a pullback, potentially targeting mid-channel support or even the 200 EMA.
If buyers fail to reclaim control, we may see a deeper correction. Eyes are now on the next key support levels—will gold find strength, or is a larger sell-off underway?

Bitcoin Faces Resistance for the 7th Time—Breakout or Rejection?Bitcoin ( BINANCE:BTCUSDT ) is attacking the Resistance zone($107,300-$105,400) for the seventh time ; even in one of these attacks , it created a Bull Trap .
During the last two to three days , Bitcoin has formed an Ascending Channel(Black) and another Ascending Channel(Purple) in the 15-minute time frame .
According to the theory of Elliott waves , Bitcoin seems to be completing microwave 5 of the main wave 5 , and we can expect corrective waves at least up to the upper line of the descending channel(broken) .
I don't expect Bitcoin to succeed in breaking the Resistance zone($107,300-$105,400) in the seventh attack , although there is positive news around the crypto market , but I think we need a stronger stimulus to break this resistance zone (real news) .
Cumulative Short Liquidation Leverage: $108,218-$106,476
Cumulative Long Liquidation Leverage: $104,460-$103,911
Note: The negative point is that the upper line of the descending channel was not broken with a large volume, so we hope for the break of the Resistance zone($107,300-$105,400).
Note: If the lower line of the ascending channel(Black) is broken, we can expect further decline and filling of the CME Gap($101,525-$100,375).
Note: If Bitcoin goes over $108223, we can expect more pumps and maybe a new ATH.
Can Bitcoin break the Resistance zone($107,300-$105,400) and create a new All-Time High(ATH)!? Please share your ideas in the comments.
Please respect each other's ideas and express them politely if you agree or disagree.
Bitcoin Analyze (BTCUSDT), 15-minute time frame.
Be sure to follow the updated ideas.
Do not forget to put Stop loss for your positions (For every position you want to open).
Please follow your strategy and updates; this is just my Idea, and I will gladly see your ideas in this post.
Please do not forget the ✅' like '✅ button 🙏😊 & Share it with your friends; thanks, and Trade safe.

GOLD → The new ATH is not the limit. What are the new targets?FX:XAUUSD updates ATH to 2800 and at the same time bulls are consolidating above the previously broken high, trying to form a base for continued gains
Gold updates all time high to $2800, amid a weaker US dollar and the threat of high tariffs from Trump, who again warned of possible 100% duties against BRICS countries, as well as a 25% tax on imports from Canada and Mexico, which boosted demand for protective assets. Investors are waiting for the US PCE Core Price Index data to gauge the Fed's next steps.
Technically, now the focus is on 2 levels: 2798.5, which is a trigger for the continuation of growth and support at 2785, behind which there is a huge pool of liquidity. Gold needs to overcome 2798.5 to continue rising, but before that a retest of the support may be formed due to the liquidity under the level.
Resistance levels: 2798.5, 2800, 2810-15
Support levels: 2790, 2785, 0.5 fibo
In general, gold has a bullish price movement. There are no hints of a trend breakdown, so the chance for the continuation of the growth is quite high and it can happen either when the trigger is broken or after a small consolidation or correction before the news. Emphasis on the previously mentioned levels and news.
Regards R. Linda!

USDCHF → The bullish trend may get its continuationOANDA:USDCHF is entering the realization phase after a prolonged correction. A favorable background is created by the uptrend and rising dollar
The technical outlook on the daily timeframe is very good. The price after breaking the trend resistance tested the previously broken line. The currency pair after the false breakout managed to consolidate above the key point, marking an interim bottom and further prospects.
Technically, the focus is on the resistance at 0.911, if the bulls can overcome this area and consolidate above this level, the currency pair will be able to realize a rise to 0.918 - 0.93.
Resistance levels: 0.911
Support levels: 0.90555
Before breaking the resistance, the currency pair could test 0.90555 due to the liquidity generated below this area. But, the trigger that can provoke further growth is 0.911
Regards MARKET ANALYZER

EUR/GBP Collapses Bearish Breakout SetupThis chart shows a short trade setup based on the price action and trendline analysis of the EUR/GBP pair on the 2-hour timeframe. The price was moving within an ascending channel, defined by two parallel white trendlines. The ascending channel suggests a temporary bullish trend where the price consistently made higher highs and higher lows.
At the top of the channel, the price experienced resistance, which led to a breakdown below the lower trendline. This breakdown signals a potential reversal of the bullish trend and marks the start of bearish momentum. The break of the lower trendline is the key signal for the short entry.
The breakdown also aligns with a shift in market sentiment, as the price failed to maintain its position within the channel. The sell-off that followed confirmed the validity of the breakout. The price is now trending downward toward a lower level, which could act as a support area.
The key levels to watch include the recent breakout point, which could act as resistance if the price attempts a pullback, and the lower support level near 0.82856. This support level aligns with a previous price range and serves as the potential target for the short position.
The descending movement following the channel break suggests strong selling pressure. To confirm the continuation of the bearish trend, the price should not re-enter the ascending channel. A retest of the lower trendline could provide further confirmation of the breakdown, while a failure to hold below it could invalidate the bearish bias. This setup reflects a clear trend reversal strategy focusing on trading the breakout of an ascending pattern.
